In This Article
Most resilience reporting counts activity, not risk reduced. How to separate outputs, potential benefits and outcomes, set targets and report pace.
Last updated
How to measure climate resilience progress, honestly
Most climate resilience reporting measures how busy a program has been, not how much risk it has removed. The IPCC's latest assessment found that the majority of adaptation monitoring has focused on processes and outputs rather than achieved outcomes, and a global review of 1,682 adaptation studies found negligible evidence of risk-reduction outcomes. Even the UK's statutory adviser, scoring 46 adaptation outcomes in 2025, did not find a single one with evidence of good delivery.
To measure climate resilience progress, track three things separately: outputs, meaning what was built or done; potential benefits, meaning what those projects are modeled to deliver; and verified outcomes, meaning what changed after a hazard tested them or monitoring confirmed it. Set targets with dates, report pace against them, and never let a modeled number stand in for a measured one.
We hold ourselves to that rule because we build for it. Council Fire built Aptation, the resilience planning platform behind the Resilience Authority of Annapolis and Anne Arundel County's public portfolio, to record every benefit as potential until it is measured; we worked with the Authority on the Annapolis Maritime Resilience Initiative. In our work with public agencies, the fastest way for a resilience program to lose the trust it needs for its next grant or bond is a modeled number presented as a result.
Why do most resilience metrics count activity?
Because activity is what a program controls and can count this year. The European Environment Agency's 2025 review of national adaptation reporting found that monitoring rarely focuses on the outcomes of adaptation actions, which makes effectiveness hard to evaluate, and that no country has set clear, measurable adaptation targets in its climate laws. A global stocktake found that more than 60% of countries with a national adaptation plan do not systematically assess whether it is being implemented.
Good programs fall into the same habit. California attaches a time-bound metric to each action in its adaptation strategy and reports on them every year; at the start of 2025, 92% of the 2021 strategy's metrics were underway, nearing completion or complete. That is a useful implementation measure, and it says nothing about risk reduced. Honolulu's charter-mandated annual report lists resilience highlights such as 1,449 trees planted by city departments in 2025.
Counting is not the mistake. The mistake is presenting a count as an outcome, because the first time a storm tests the work, the gap shows.
What is the difference between outputs, potential benefits and outcomes?
An output is something you did, a potential benefit is what it should deliver, and an outcome is what it did deliver. The NERRS Resilience Metrics toolkit, built with NOAA funding, makes the point with flood damage: counts such as homes elevated measure actions taken, as opposed to actual outcomes. Until a storm tests the work, the honest outcome metric is modeled damage with and without the action.
We keep these in three ledgers, using a living shoreline as the example.
Ledger | What it records | Living shoreline example | Evidence behind it | Who reads it first |
|---|---|---|---|---|
Outputs | What was built, adopted or delivered | 1,200 feet of shoreline restored; design and permits complete | Construction records, invoices, inspections | Program staff and funders checking delivery |
Potential benefits | What the work is modeled or estimated to deliver | Erosion and flood damage avoided over the project's life, from a benefit-cost analysis | Models, benefit-cost analysis, engineering estimates | Boards and grant reviewers comparing projects |
Verified outcomes | What changed after a real event or a monitoring period | Shoreline position and damage after the next major storm, against a baseline | Monitoring data, post-event loss avoidance studies | Auditors, legislators and residents asking "did it work?" |
Who this is for: resilience directors, sustainability officers and grant managers who report to a board, a funder or the public and want numbers that survive scrutiny.
The federal government draws the same line. GAO describes two FEMA methods: benefit-cost analysis, which estimates benefits over a project's life, and loss avoidance studies, which measure benefits during actual hazard events. In the 20 years before GAO's 2021 report, FEMA ran 22 loss avoidance studies: 15 after floods, six after hurricanes and one after a tornado. Verification is rare because it waits on disasters.
Potential benefits are also sensitive to assumptions. Since April 2025, FEMA's benefit-cost analyses discount future benefits at 7%, up from 3.1%, which shrinks the modeled value of losses avoided decades out. Our climate adaptation cost calculator gives a first estimate of avoided losses, and our piece on the ROI of climate adaptation covers the economic case.
Why are resilience outcomes so hard to prove?
Because the evidence arrives late and mixed with everything else. The IPCC names the obstacles: it is hard to attribute a change in risk to the adaptation response when other factors are in play, the repeat risk assessment needed to show change is rarely done, outcomes appear over long horizons, and avoided impacts are hard to measure. A 2019 paper in Nature Climate Change put it plainly: the measurement of adaptation success remains elusive.
The NERRS toolkit adds the practical problem: success can only be known after some "stress testing" at a future time, and long-term monitoring is notoriously hard to fund. A program that waits for proof before it reports anything will report nothing for a decade.
The IPCC's fix is to write the causal chain down at the start, outlining the expected relationship between each response and its outcome during planning. That is the job of a baseline. FEMA's 2025 planning handbook suggests that plan evaluation establish baseline risk and resiliency metrics and document losses avoided after hazard events, which is how a potential benefit eventually becomes a verified one. A climate risk assessment done before the work is the baseline the outcome is measured against.
Which climate resilience indicators should you track?
Track a few of each type, chosen from the actions you are actually taking. The EU's adaptation platform advises a combination of process, output and outcome indicators, because some outcomes cannot be measured in the near term. Massachusetts' 2025 ResilientMass Metrics started from nearly 200 candidates and sorted them into four types: inputs, process, outputs, and outcomes and impacts.
Indicator type | What it answers | Example for a coastal county | Typical source |
|---|---|---|---|
Inputs | Do we have the means? | Dollars secured by source; staff assigned to resilience | Budget, funding library |
Process | Are we doing the work well? | Share of plan actions with an owner, a date and a funding source | Plan and project records |
Outputs | What did we deliver? | Projects completed; acres of wetland restored; homes elevated | Construction and grant records |
Potential benefits | What should it deliver? | Modeled flood damage avoided; people in protected areas | Benefit-cost analysis, models |
Outcomes | What changed? | Repetitive flood claims, road closure days, damage after storms, against a baseline | Insurance, public works and monitoring data |
Who this is for: teams setting up a metrics framework for a resilience plan, a hazard mitigation plan or a grant portfolio.
The NERRS toolkit recommends tying indicators to the strategies a community chooses rather than to a generic list, and walks through six steps, from setting the context and a shared vision of success to using the metrics. A 2024 White House Council on Environmental Quality paper split indicators into process-related and outcome-related, and called a common set of outcome indicators that works across more than 20 federal agencies very challenging. ISO's new local adaptation planning standard, ISO 14092:2026, builds monitoring into the planning cycle.
For the mechanics of measurement and verification, our guides to metrics, monitoring and verification for municipalities, balancing quantitative and qualitative metrics and monitoring ecosystem services over time go deeper, and participatory monitoring brings residents into the data.
How do you set targets and report pace?
Give every headline metric a target and a year, then report whether you are ahead of or behind the line between where you started and where you said you would be. The UK's Climate Change Committee found that across nearly all its indicators, assessing progress was harder because of the lack of targets to compare observed progress against; only six had formalized targets or commitments. A count without a target cannot be behind schedule, which is exactly why boards cannot use it.
Pace also exposes the delivery risk that totals hide. If a county commits to two miles of living shoreline by 2030 and has built a third of it with most of the funding still pending, a running total looks like progress while the pace says the target is slipping. A vulnerability assessment and equity mapping tells you where to set targets so the benefits reach the people most at risk.
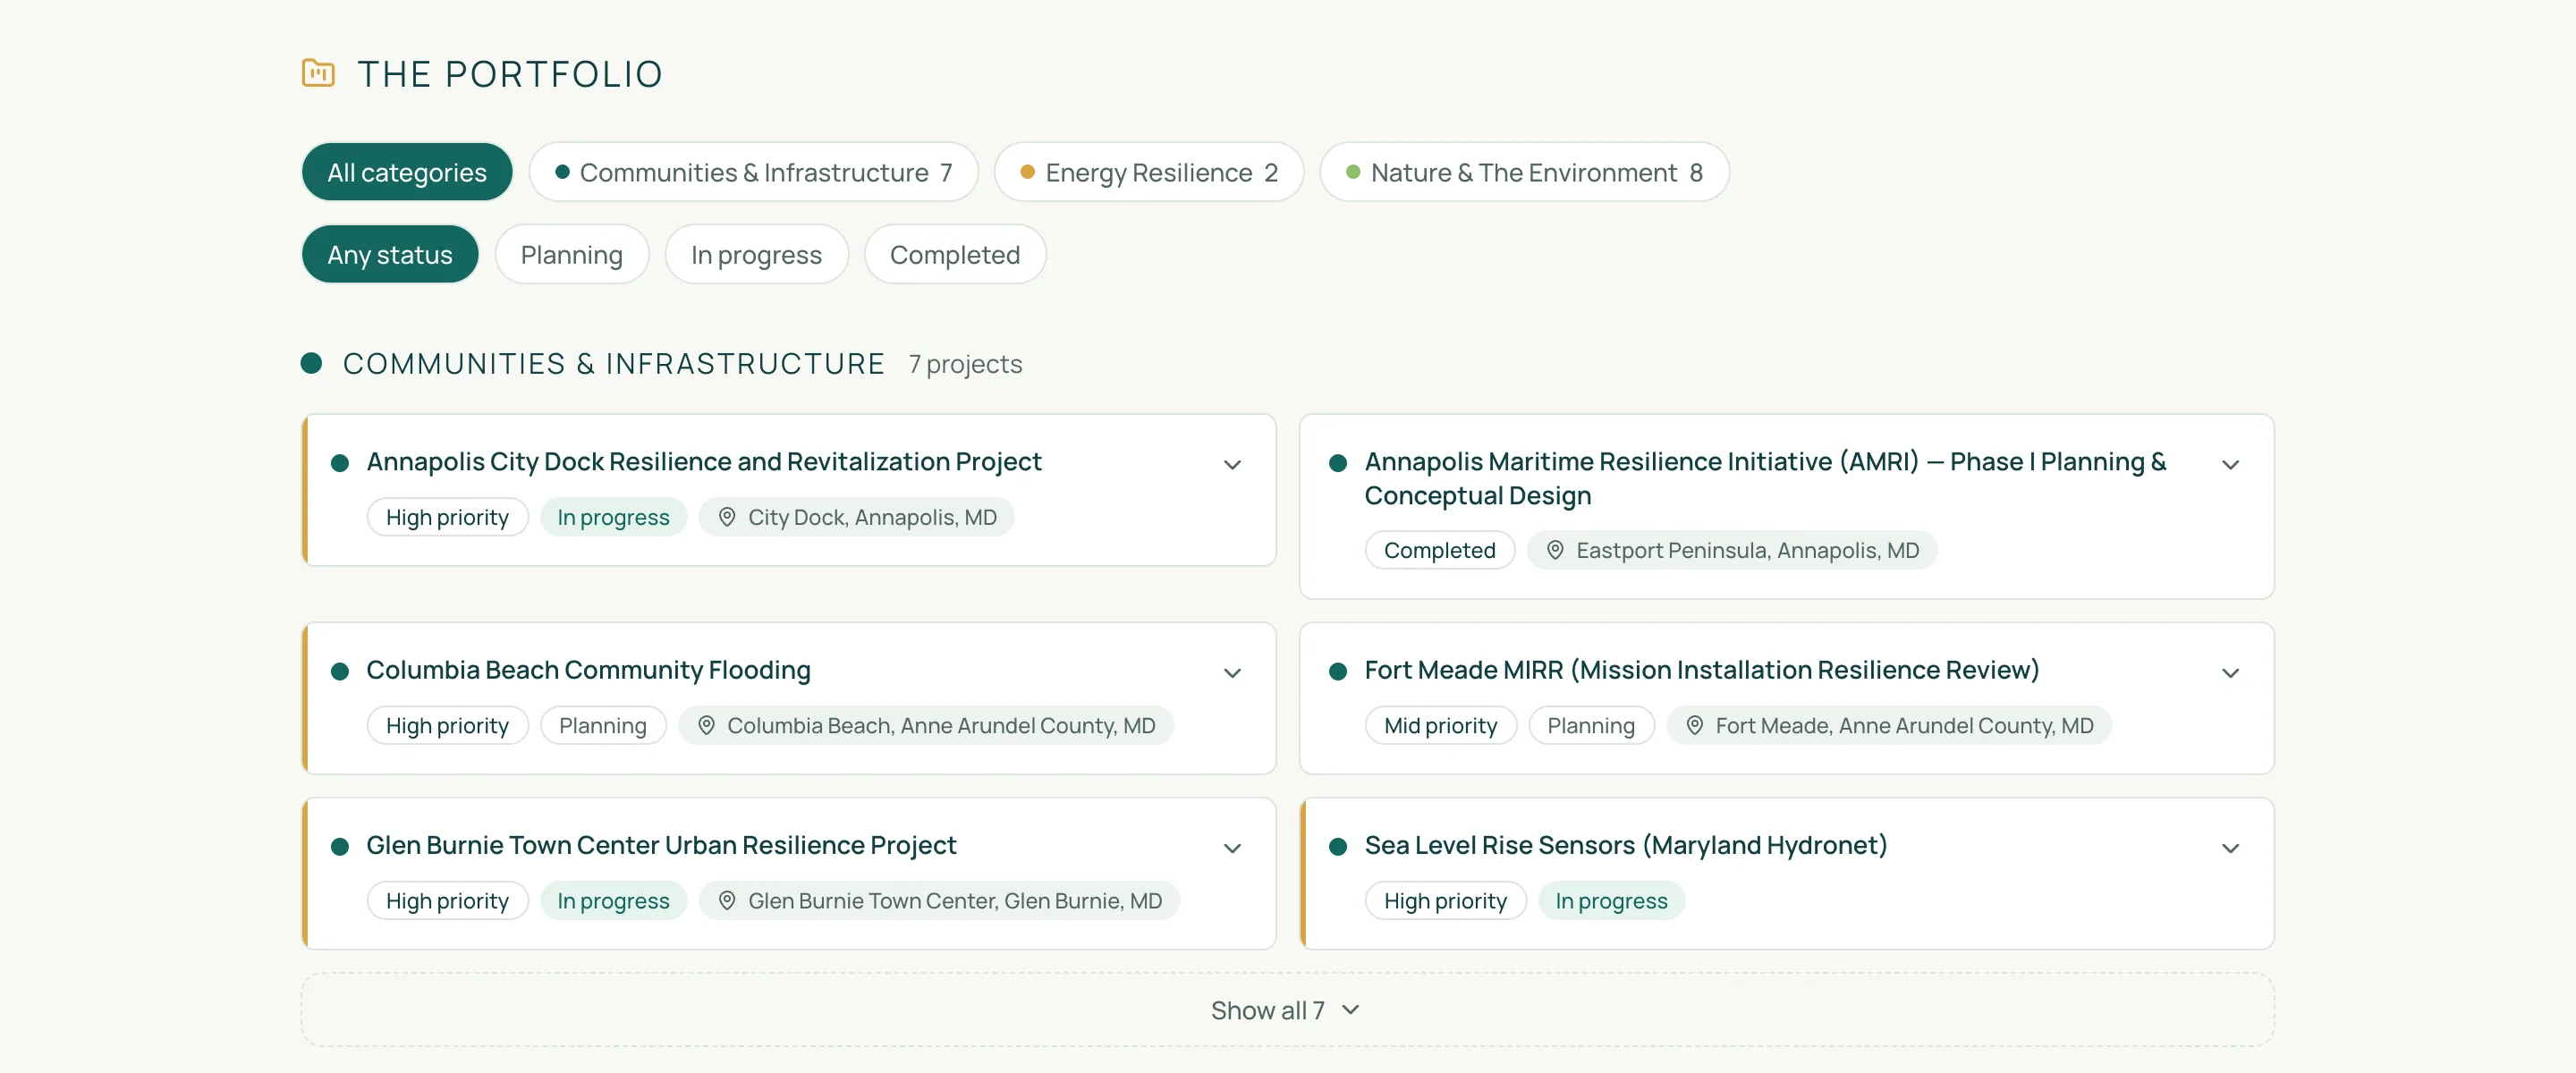
This is how Aptation measures a portfolio. Every project moves from planning to in progress to completed, every benefit is labeled as potential, and each portfolio target shows whether it is met, on track, behind pace or past its target year. A forecast models the portfolio's potential through any year, and what happens if projects finish earlier or later.
How should you report resilience progress to boards, funders and residents?
From one record, with the ledger labels intact, at the level of detail each audience needs. Funders increasingly ask: the reopened FY2024–25 BRIC round requires every applicant to explain how progress will be measured, and GAO found that FEMA itself did not consistently establish methods and targets to measure BRIC's results. Maryland's resilience authorities must report every year on the projects they funded and the sources of revenue.
Boards need pace against targets and the funding gap. Funders need outputs and their own dollars traced to projects; our grant reporting audit covers which questions funders can stop asking. Residents need a map of what is being built near them and an honest note on what is planned versus proven. Storytelling and data visualization each have a role; the labels keep both honest.
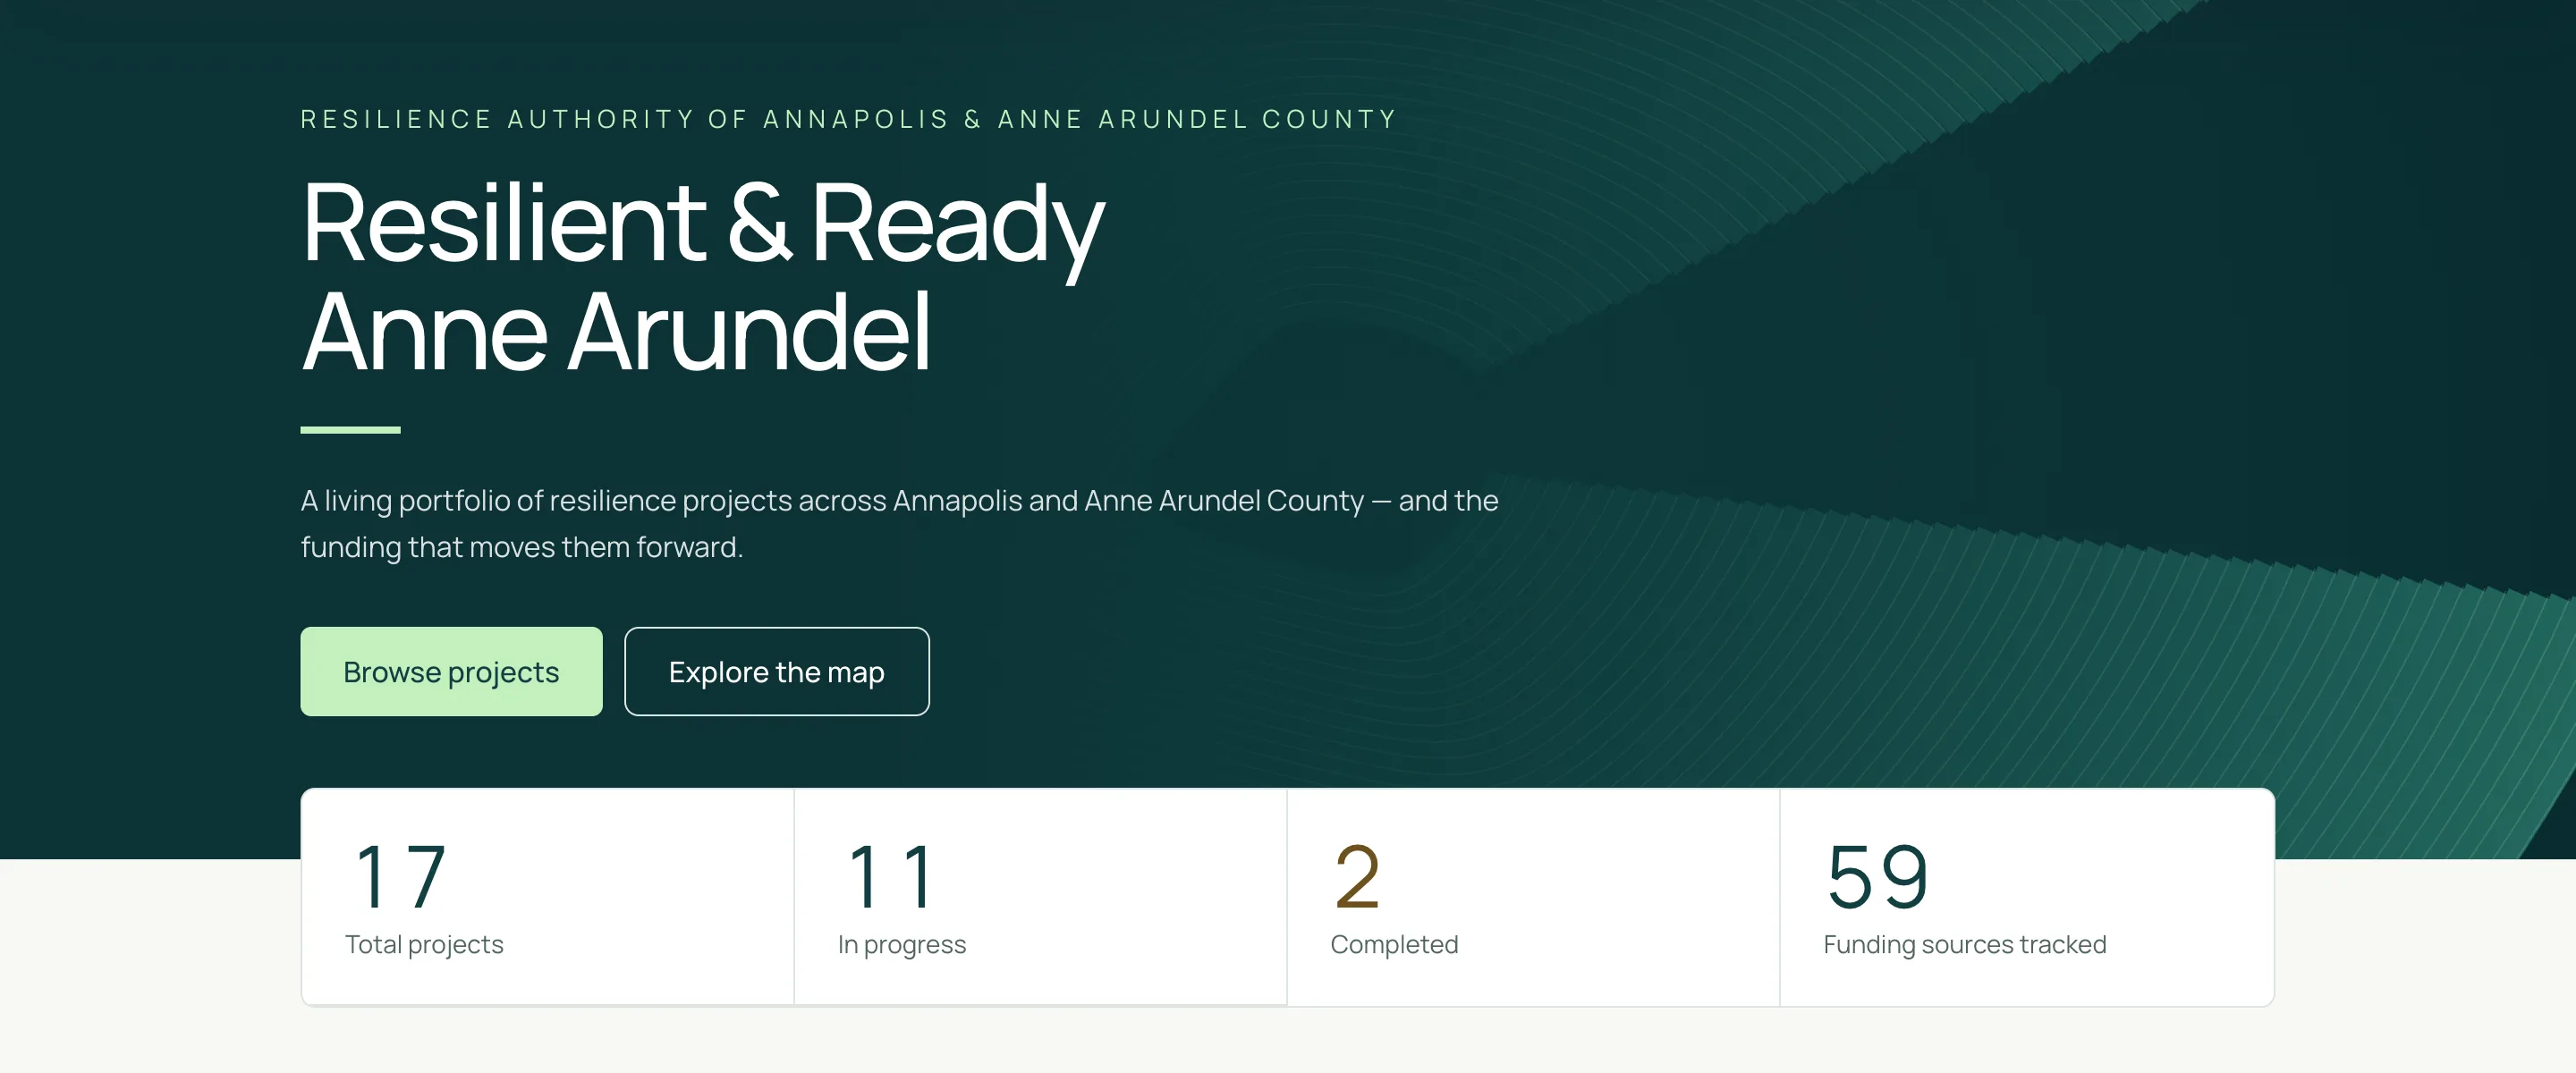
Aptation produces the board's printed portfolio and project reports, view-only links for partners that staff can scope, expire and revoke, and a public portfolio and map. Resilient & Ready Anne Arundel is that public portfolio for the Annapolis and Anne Arundel County Resilience Authority, and every figure on it comes from the same records staff manage.
If your portfolio needs a measurement framework before it needs software, that is advisory work our climate resilience practice does with municipalities and government agencies. When the reporting needs a system no product offers, Council Fire Labs builds it.
Frequently asked questions
01How do you measure climate resilience?
Measure climate resilience in three ledgers: outputs such as projects completed, potential benefits such as modeled damage avoided, and verified outcomes such as reduced losses after a real event, against a baseline. Give headline metrics targets and dates, and report pace. Never present a modeled benefit as a measured result. Aptation labels every benefit as potential.
02What is the difference between outputs and outcomes in resilience?
Outputs are what a program delivers, such as feet of shoreline restored or homes elevated. Outcomes are what changed as a result, such as lower flood damage after a storm. The NERRS Resilience Metrics toolkit warns that counts of actions taken should not be equated with adaptation success, because they assume the actions work.
03What are good climate resilience indicators for a local government?
Use a few of each type: inputs such as dollars secured, process such as actions with an owner and date, outputs such as projects completed, potential benefits such as modeled damage avoided, and outcomes such as repetitive flood claims against a baseline. Tie each to a strategy you are pursuing. Our MRV guide for municipalities covers the mechanics.
04Why is it hard to prove that adaptation worked?
The IPCC lists four reasons: changes in risk are hard to attribute to one response, the repeat risk assessment needed to show change is rarely done, outcomes take years to appear, and avoided impacts are hard to measure. As of 2021, FEMA had run only 22 loss avoidance studies in 20 years, each after a real disaster.
05What is a potential benefit in climate resilience reporting?
A potential benefit is what a project is expected to deliver, estimated by a model, an engineering study or a benefit-cost analysis, before any event or monitoring confirms it. It is legitimate to report, labeled as potential. FEMA's 7% discount rate, in place since April 2025, lowers modeled benefits that arrive decades out.
06How often should you report on resilience progress?
At least once a year, with status updates between. FEMA's 2025 planning handbook gives an example schedule that collects action status twice a year and evaluates the plan once a year or after a disaster. Maryland's resilience authorities must report to the legislature every year on projects funded and revenue sources.
07What software tracks climate resilience progress?
Many teams combine spreadsheets, GIS dashboards and grant trackers, with no shared definitions. Aptation tracks each project from planning to completion, records benefits as potential, shows portfolio targets as met, on track or behind pace, and shares progress through reports, view-only links and a public portfolio. Council Fire Labs builds custom systems when needed.
Related Resources
Measuring and reporting impact
- How to develop metrics, monitoring and verification for municipalities: the mechanics of MRV.
- How to measure and communicate collective impact for municipalities: reporting across partners.
- Impact measurement: the definition and its methods.
- Grant reporting: which questions can you stop asking?: reporting funders can use.
Planning and prioritizing resilience
- How to implement a hazard mitigation plan between updates: tracking every action to the five-year update.
- How to build resilience into your capital improvement plan: where resilience meets the budget.
- What is a resilience authority, and when do you need one?: the reporting duties of Maryland's authorities.
- How to prioritize climate resilience projects that get done: the ranking that comes before measurement.
- ISO 14092:2026 and what it means for local governments: the new adaptation planning standard.
- Climate resilience planning guides: the library's planning guides.
- Climate risk assessment tool: a first pass at the baseline.
Proof and tools
- Annapolis Maritime Resilience Initiative: our work with the Resilience Authority.
- Climate adaptation cost calculator: avoided losses and benefit-cost estimates by hazard.
- Aptation: the resilience planning and delivery platform.
Put a measurement framework under your portfolio
Send us what you report today, whether that is a board deck, a grant report or a spreadsheet of completed projects. We will sort it into outputs, potential benefits and outcomes, and show where targets and baselines would make it hold up. Talk to us on our contact page and choose Climate resilience or Software & AI (CF Labs).
About the Author
George Chmael II is Council Fire's Founder & CEO. He has led the firm since its founding and through its B Corp certification in 2010. Council Fire's climate resilience practice works with cities, counties, ports and authorities on planning, funding and delivery, and Council Fire Labs builds the software that holds that work together.
Cover photograph: Pexels — Green Grass Field and River, by Mirco Violent blur. Illustrative stock photograph, not a Council Fire project.





FAQ