In This Article
How to prioritize climate resilience projects so the ranking reaches the budget: shared criteria, open weights, funding fit and honest progress reports.
Last updated
How to prioritize climate resilience projects that get done
A county rarely runs short of resilience projects. It runs short of a shared answer to which one goes first, and of a way to carry that answer from the plan into the capital budget and the grant calendar. In a peer-reviewed study of 44 U.S. local adaptation plans, the average plan listed 93 strategies and most did not prioritize them; only a third assigned timelines or responsibility for carrying them out.
To prioritize climate resilience projects, score every candidate against criteria your community agreed on, publish the weights, and rank across the whole portfolio. Then test the top tier against funding fit and readiness before it reaches the capital program, and re-score on a schedule. A ranking that never reaches the budget is only a list.
We learned where the real work sits on the Annapolis Maritime Resilience Initiative, where Council Fire's climate resilience practice served as an implementation and engagement partner for the Resilience Authority of Annapolis and Anne Arundel County. Annapolis is a city NOAA expects to see 15 to 19 high tide flood days between May 2026 and April 2027, and 75 to 115 a year by 2050 under its low-intermediate sea level scenario. Over 18 months, residents named 38 sites of concern. Partners evaluated them on climate vulnerability, ecological function, equity, community interest and feasibility, and ten advanced to concept design, spanning a range of nature-based solutions, each with a planning-level cost estimate and an implementation roadmap.
Scoring 38 sites was the easy part. The Authority, established in 2021 as the first multi-jurisdictional resilience authority in the nation, had 32 projects completed or underway and more than $50 million secured by April 2026, according to the County. Keeping a portfolio like that in one record that a board, a funder and a resident can all follow is the harder part. That is why we built Aptation with the Authority.
Why do resilience project lists stall before construction?
They stall in the handoffs, and federal rules already expect those handoffs to work. A local hazard mitigation plan must explain how its actions will be prioritized, with special emphasis on a cost-benefit review, describe how it will be incorporated into planning mechanisms such as capital improvement plans, and be revised to reflect progress and resubmitted within five years to stay eligible for mitigation grants.
Implementation is where plans score worst. In a 2025 review of 61 Pennsylvania county hazard mitigation plans, implementation was the lowest-scoring element and only 39% tracked how post-disaster funds were used. As one interviewee put it, with so many mitigation actions, "not everybody knows what they're responsible for."
In our resilience work, each of those systems tends to live in its own file: the plan as a PDF, the capital program in the budget office, the grant tracker in a spreadsheet, the board update in a slide deck. When the ranking cannot be traced through all four, it gets argued again at every meeting, and the project with the loudest sponsor tends to win.
Money awarded is not money delivered, either. Before the program was frozen in 2025, FEMA had allocated about $2.5 billion to 1,245 BRIC subgrants but reimbursed $62 million, and 37 had completed work. GAO also found FEMA had not consistently set methods and targets to measure the program's results. The fix is less about a better scoring model than about one record, so the answer to "why this one first?" is the same in the plan, the budget and the board room.
What criteria should a resilience prioritization framework use?
Use criteria that measure what a project changes, not only where the hazard is. GAO's six steps for prioritizing resilience investments run from setting goals and assessing risk to implementing when funds arrive and monitoring results, and its call for a federal body to do this nationally was still open as of February 2026. For now, prioritization is a local job.
A strong framework asks how much risk a project reduces, who benefits, what else it delivers, whether it is worth the cost and whether it can start soon. Start from a climate risk assessment, then score each candidate against criteria like these.
Criterion | What it answers | Evidence to score it | Common trap |
|---|---|---|---|
Risk reduction | How much harm does the project avoid? | Hazard and flood studies, exposure of people and assets | Scoring the size of the hazard instead of the reduction |
Community need and equity | Who benefits, and who has carried the risk so far? | Engagement records, social vulnerability data | A yes/no checkbox instead of a weighted criterion |
Co-benefits | What else does it deliver: habitat, heat relief, mobility? | Design concept, nature-based performance evidence | Counting the same benefit under two criteria |
Cost and benefit-cost | Is it worth what it costs, and to whom? | Planning-level estimate, benefit-cost analysis | Letting one ratio stand in for the ranking |
Readiness | Can it start in the next funding window? | Design stage, land control, permits, a local sponsor | Ranking concepts that cannot be built this decade |
Community support | Will the people affected back it? | Public comment, partner commitments | Treating the loudest meeting as the community |
The economics favor acting early. The National Institute of Building Sciences found that federal mitigation grants save about $6 for every $1 spent, and adopting current building codes about $11, though it notes the ratios vary by place. Our piece on the ROI of climate adaptation covers the wider case.
Use benefit-cost analysis as a screen, not the ranking. FEMA generally treats a project as cost-effective at a benefit-cost ratio of 1.0 or more, and since April 8, 2025 its analyses discount future benefits at 7%, up from 3.1%. A higher discount rate shrinks benefits that arrive decades out, such as flood losses avoided in 2060. Our climate adaptation cost calculator gives a first estimate by hazard.
Readiness now carries real weight with funders. In the reopened BRIC round, projects at 90% design or greater earn 30 points, the largest single scoring criterion, and applicants are also scored on how they will measure progress.
Keep funding out of the criteria. Whether a grant exists for a project is a filter you apply after ranking, not a reason to rank it higher. A portfolio that ranks by available money ends up with the projects funders like rather than the ones the community needs.
Who this is for: counties, cities and regional authorities with more than a handful of candidate projects and more than one department involved in delivering them.
How should you weight and score the projects?
Score on a short scale with written guidance, publish the weights, and set tiers by rank. A 1-to-4 scale with a sentence describing each score is easier to apply consistently than a 1-to-10 scale, and it leaves fewer arguments about the difference between a 6 and a 7. The Government Finance Officers Association recommends a rating system for capital requests for the same reason.
Weights are where values show. If equity carries 25 percent of the score, say so in the plan and in the public view. Communities accept a ranking they disagree with far more readily than one they cannot inspect.
That matters more now. FEMA's FY2023 BRIC round prioritized disadvantaged communities under Executive Order 14008; that order was revoked in January 2025, and Justice40 prioritization left BRIC scoring with it. If equitable adaptation matters to your community, your own criteria now have to carry it. Our guide to embedding equity in local resilience planning covers the methods.
Set tiers by position in the ranking, not by fixed thresholds. "High priority" should mean the top third of this portfolio, so the tiers stay meaningful when scores drift upward over time. Fixed cut-offs invite the quiet inflation that eventually turns every project into a top priority.
AI can help with the first pass. In Aptation, staff can ask the platform to draft scores against their written scoring guidance, and the drafts arrive as suggestions a person confirms. The tiers still come from the ranking across the whole portfolio, never from the model. We build these tools, which makes us more careful about where they stop, not less.
Re-score on a schedule: once a year, after a major storm, and whenever new hazard data or a new plan arrives. A ranking from 2021 describes the risks and the costs of 2021.
How do you match priorities to funding without letting the money set them?
Rank first, then match. Keep every source you pursue in one funding library, with its eligibility, amount range, match requirement and deadline, and link each source to the projects it fits. Then the question for each top-tier project becomes concrete: which sources fit, what has been awarded, and what gap remains.
Federal money has been the least predictable part of that library. FEMA announced in April 2025 that it was ending BRIC; a federal court ruled the termination unlawful in December 2025, in a suit a coalition of states including Maryland brought. FEMA reopened the program with a combined $1 billion round whose applications closed on July 23, 2026, and selections had not been announced as of late October 2026.
Demand outran supply even before the freeze: across FY2020 to FY2023, communities requested $15.7 billion for $4.8 billion of BRIC funding. And according to the Congressional Research Service, the Hazard Mitigation Grant Program has not been approved for any major disaster declared since March 18, 2025, though FEMA continues to fund projects under earlier declarations. Our federal climate funding playbook for 2026 tracks the programs in more detail.
FEMA's grants generally cover up to 75% of eligible costs, or 90% for small impoverished communities, so every federal application also needs a local match in the library. That volatility is the strongest argument for diversifying: federal and state programs, bonds, stormwater or resilience fees, philanthropy and private capital, side by side. In Maryland, state law since 2020 lets counties and municipalities create resilience authorities that can issue tax-exempt bonds for resilience infrastructure.
Our guides to funding resilience without federal grants and identifying and securing funding for resilience projects cover the local options, and the resilience funding hub collects the programs we track.
Watch the calendar as closely as the criteria. A top-tier project that misses an application window waits a year. Sort deadlines soonest first and flag the ones closing within two weeks, so readiness work starts before the funding notice arrives.
How do you show progress without overstating it?
Report what each project is set to deliver as potential until it is measured. The evidence base is thin everywhere: a global review of 1,682 adaptation studies found negligible evidence of risk-reduction outcomes. Funders and residents can tell a planned benefit from a verified one, and a portfolio that blurs them loses credibility the first time someone checks. Our guide on how to measure climate resilience progress covers the three ledgers that keep them apart.
Track every project through plain delivery stages: planning, in progress, completed. Record the benefits each one is expected to deliver by type, roll them up across the portfolio, and compare them with your targets and their pace: met, on track, or behind. The federal Climate Resilience Toolkit asks plans to describe how progress and results will be monitored and reported over time, and a forecast that shows how targets move if projects finish earlier or later is more useful in a budget hearing than a single projected total.
Then give each audience the view it needs from the same records. A board wants a printed report. A partner needs a link it can open without an account.
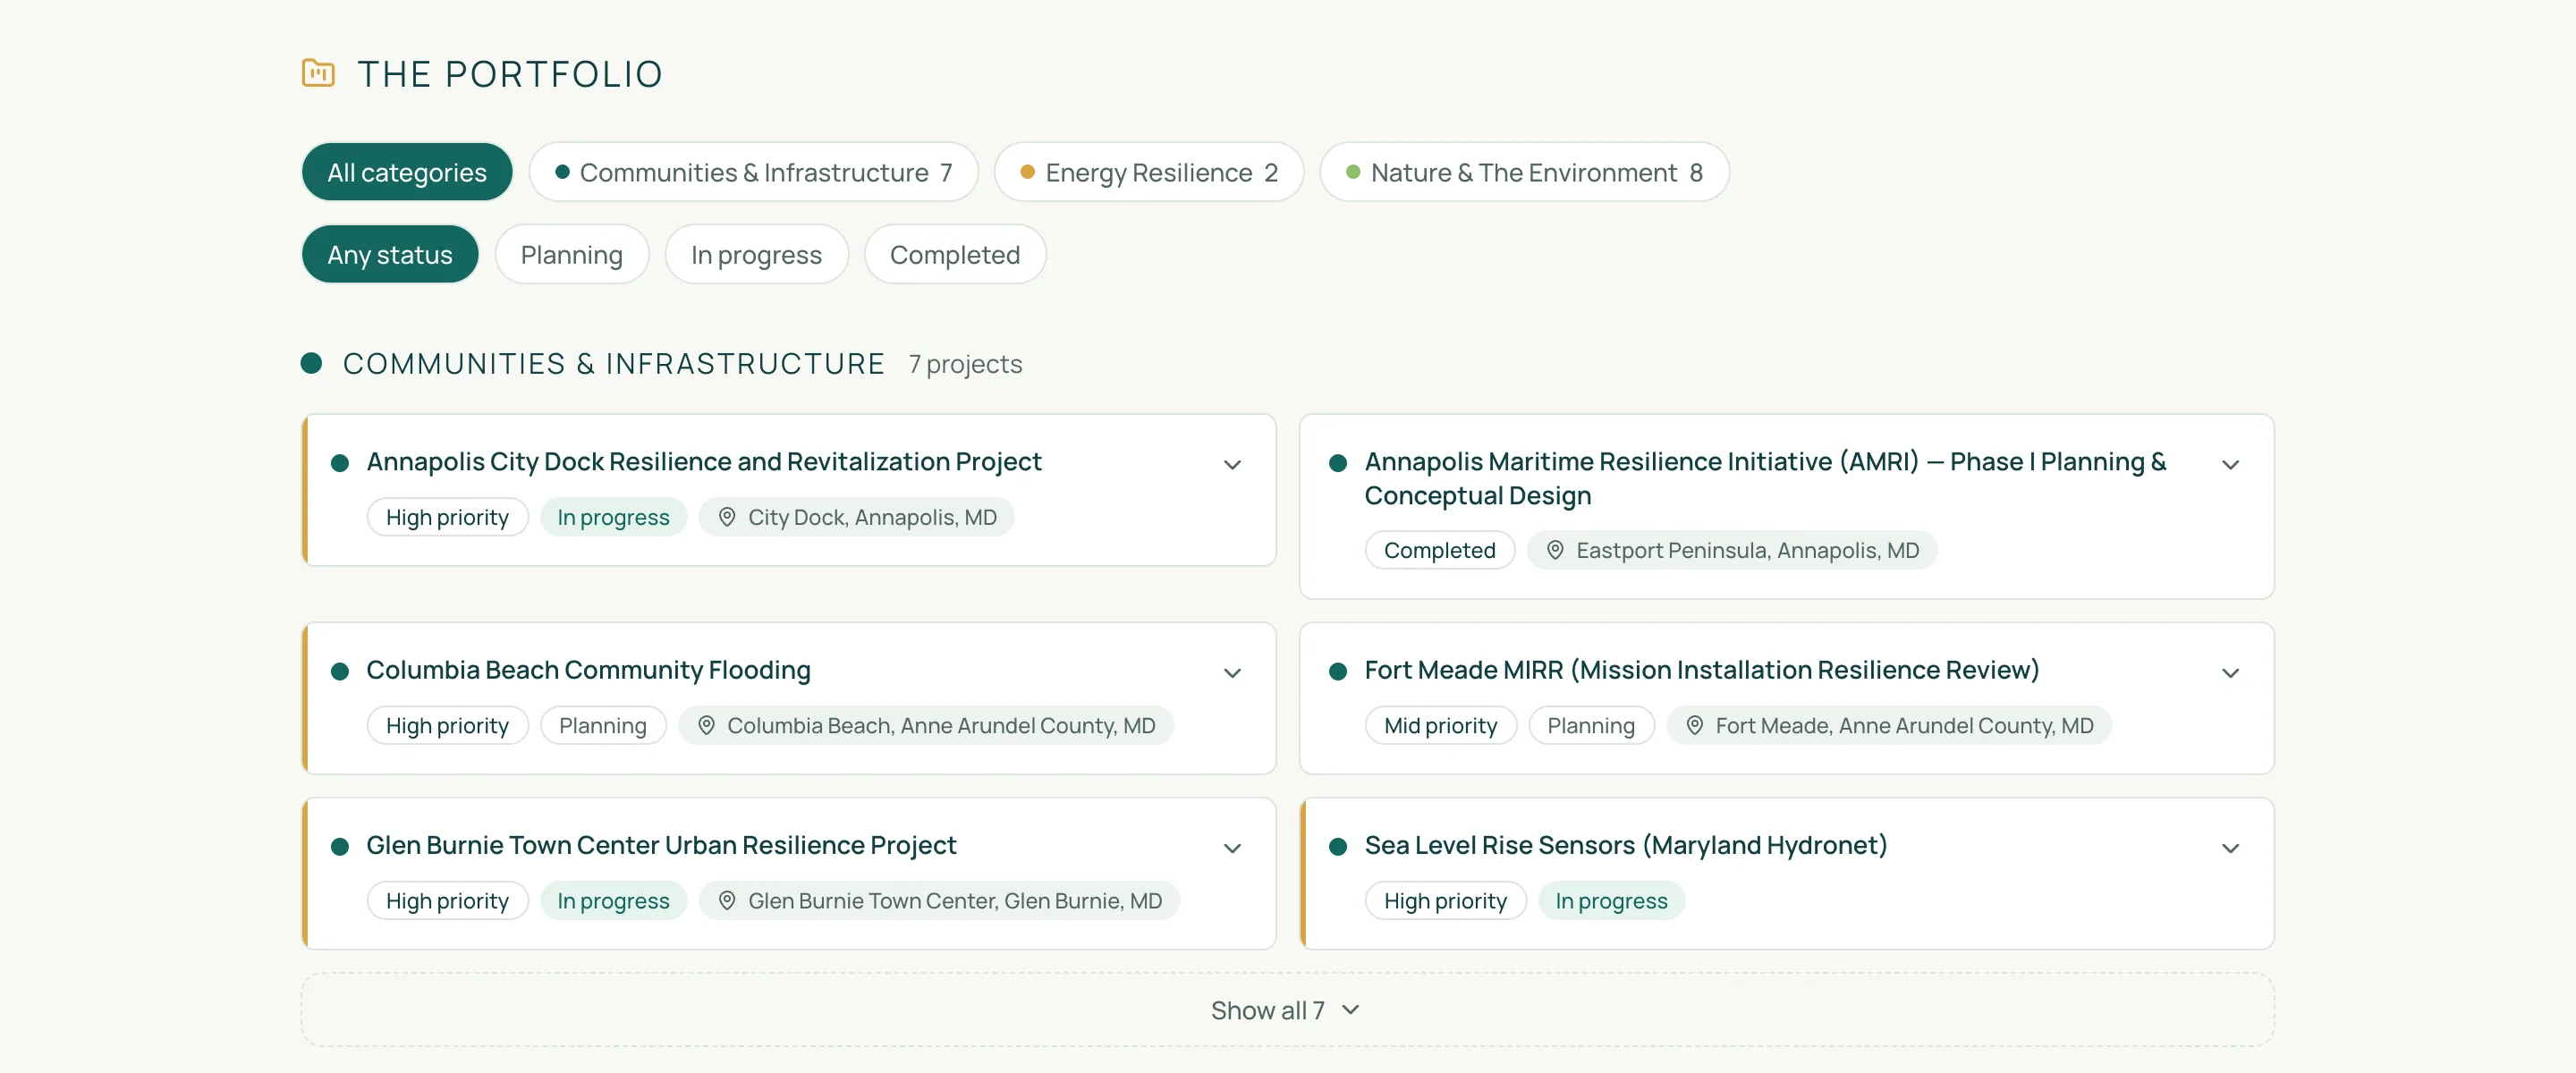
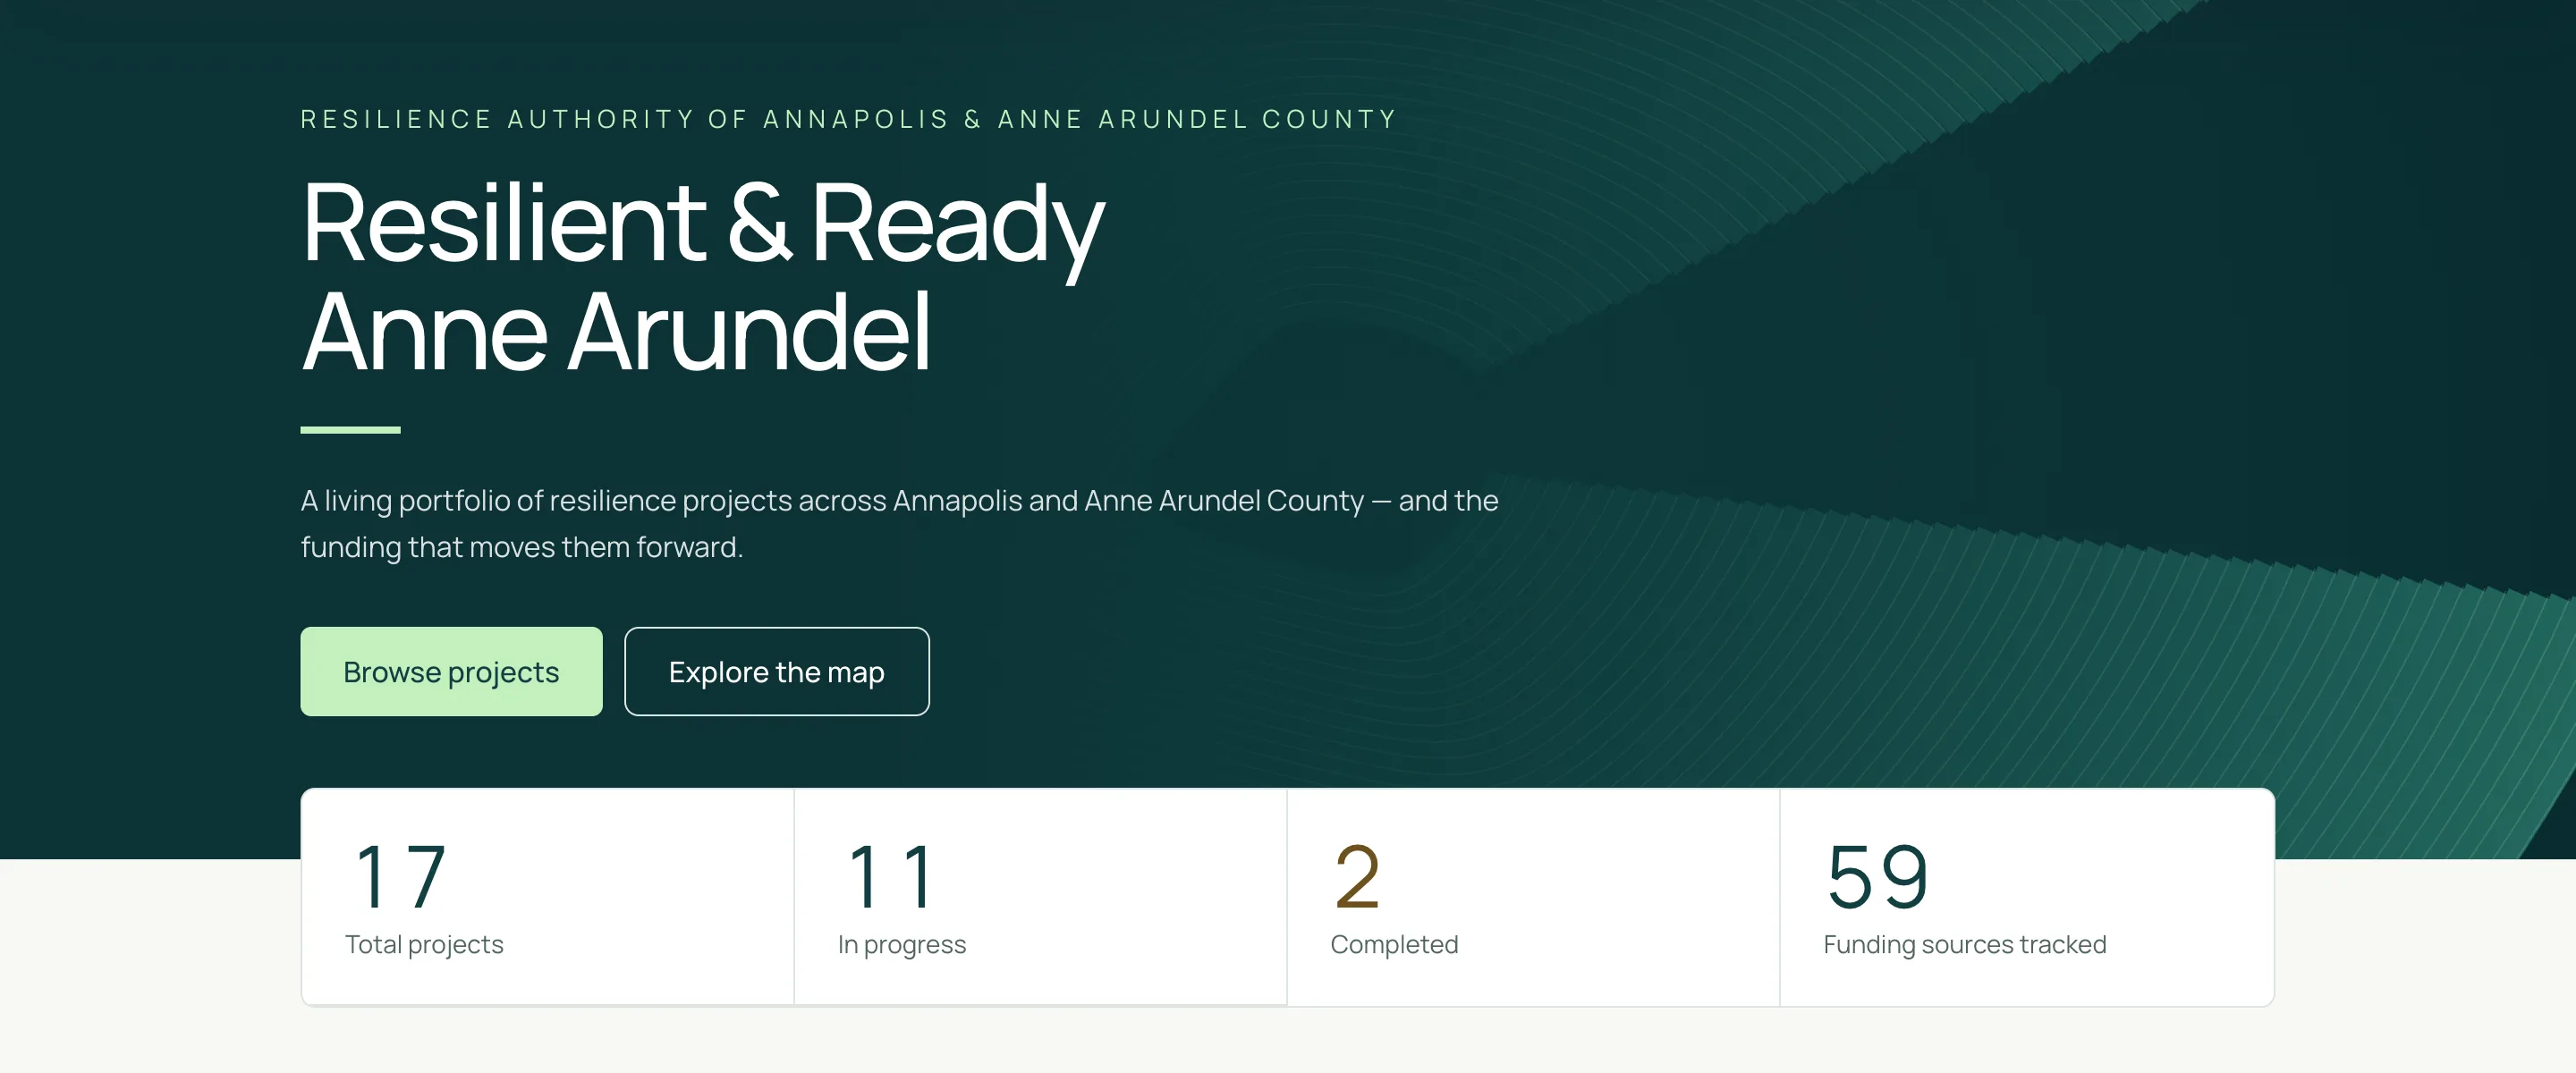
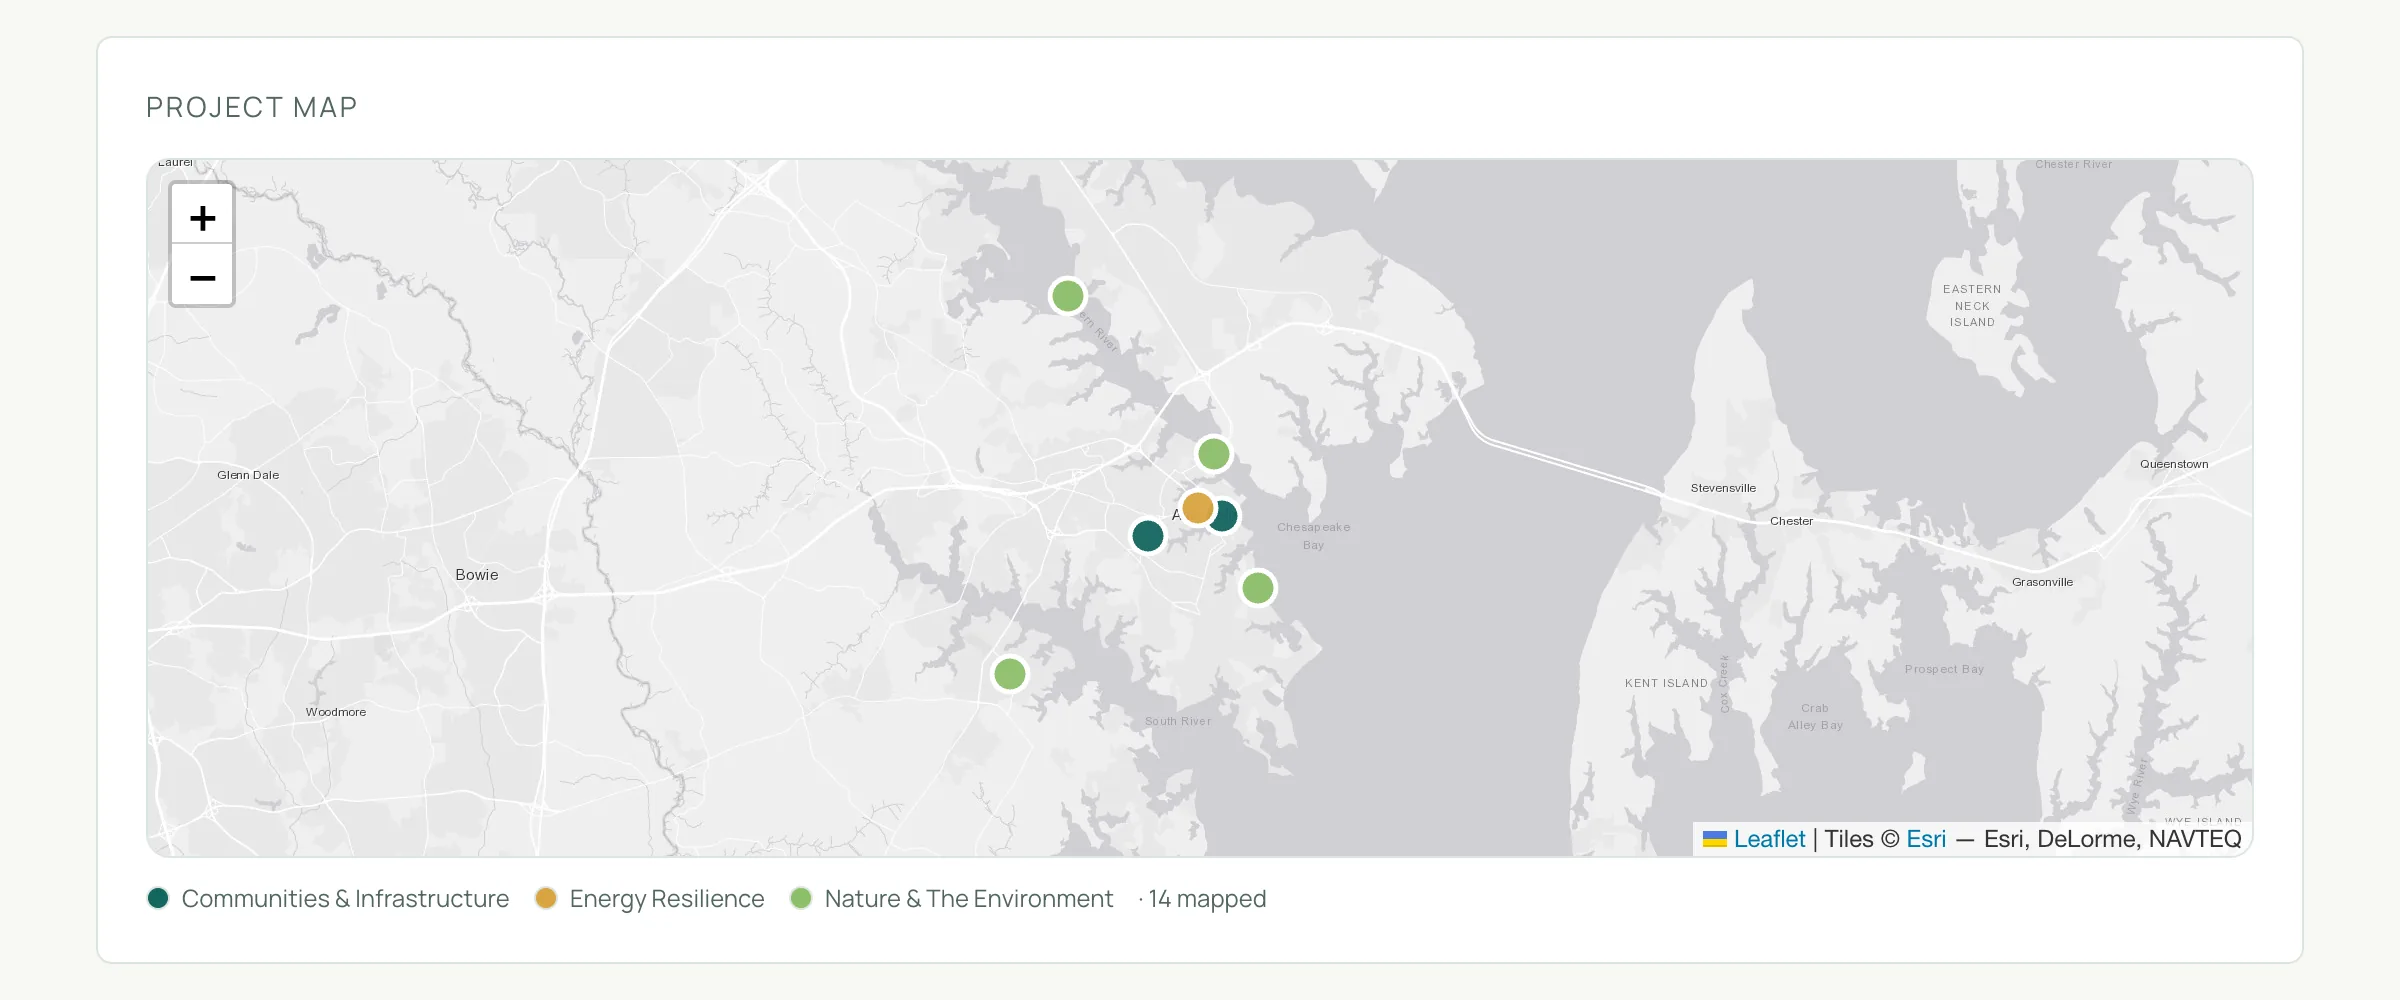
Residents need a public map, and the Resilience Authority runs its public portfolio, Resilient & Ready Anne Arundel, on Aptation, so the projects residents see are the projects staff manage. The county's climate risk and resilience profile shows the hazards behind it.
Spreadsheet, GIS or a portfolio platform: what should hold the list?
Pick the smallest tool that keeps one record from plan to delivery. The right answer depends on how many projects you carry, how many departments touch them and who needs to see them.
Option | Best for | Who this is for | Where it breaks |
|---|---|---|---|
Spreadsheet | Scoring a short list once | A small town with one owner and fewer than 20 projects | Versions multiply, no audit trail, no public view |
GIS map or story map | Showing where projects are | Teams with GIS staff and a public-facing goal | Weak on scoring, funding and delivery status |
Grants management software | Applications, awards and compliance | Grant offices managing many awards | Sees grants, not the portfolio's priorities |
Capital planning software | The capital improvement program and budget | Finance and budget offices | Resilience criteria and benefits are rarely modeled |
A resilience portfolio platform such as Aptation | Planning, ranking, funding, tracking and sharing in one record | Counties, cities and authorities running a portfolio across departments | Needs an owner and agreed criteria before it helps |
A custom build | A workflow no product fits | Agencies with unusual processes or data | Cost and upkeep; overkill if a product already fits |
Aptation is the platform we built for the fifth row. It places every project on a map, scores them on your own criteria and weights, sets tiers by rank, and keeps a funding library linked to the projects each source fits. It tracks budget and deadlines by fiscal year, records benefits as potential against your targets, and shares the result through printed reports, view-only links and a public portfolio. Plans and studies can be uploaded and read for candidate projects, which wait in a review queue for staff to confirm.
It does not find grants for you: the library holds the programs your team adds. It does not decide anything either. AI drafts scores, matches and edits; people confirm them. Council Fire works with municipalities and government agencies on the strategy around it.
When a workflow does not fit any product, Council Fire Labs builds the smallest system that does. If you are weighing that route, start with how to choose sustainability software, then what drives the cost of custom sustainability software and how to write a one-workflow build brief.
Frequently asked questions
01How do you prioritize climate resilience projects?
To prioritize climate resilience projects, score each candidate against criteria your community agreed on, such as risk reduction, equity, co-benefits, cost and readiness, on a short scale with published weights. Rank across the whole portfolio, set tiers by rank, then check the top tier against funding fit and deadlines. Our climate resilience planning guides cover each step.
02What criteria should a resilience project scoring system include?
Most frameworks combine risk reduction, community need and equity, co-benefits, cost, readiness and community support. In the Annapolis Maritime Resilience Initiative, partners evaluated 38 resident-identified sites on climate vulnerability, ecological function, equity, community interest and feasibility, and advanced ten to concept design. Treat funding availability as a filter applied after ranking, not a criterion.
03Should benefit-cost analysis decide which project goes first?
No. FEMA generally treats a mitigation project as cost-effective at a benefit-cost ratio of 1.0 or more, and since April 2025 its analyses discount future benefits at 7%, which shrinks benefits that arrive decades out. Use the ratio as an eligibility screen and one weighted criterion, not as the ranking itself.
04How often should a resilience portfolio be re-scored?
At least once a year, and again after a major storm, a new hazard study or a plan update. Federal rules require local hazard mitigation plans to be revised to reflect progress and resubmitted within five years to stay eligible for mitigation grants, but costs, risks and funding move faster than that.
05How do you include equity in resilience project prioritization?
Make equity a weighted criterion with written scoring guidance, not a checkbox, and ground it in engagement records and social vulnerability data. Publish the weight. With Justice40 prioritization gone from BRIC scoring since 2025, local criteria now carry it. Council Fire's guide to embedding equity in local resilience planning covers the methods.
06What software do local governments use to track resilience projects?
Many governments use spreadsheets, GIS story maps, grants management systems or capital planning software, and each holds part of the picture. A resilience portfolio platform such as Aptation keeps planning, scoring, funding, delivery status and public sharing in one record. The Resilience Authority of Annapolis and Anne Arundel County runs its public portfolio on it.
07Can AI score climate resilience projects?
AI can draft scores against your written scoring guidance and read plans for candidate projects, which shortens the first pass. It should not set priorities. In Aptation, AI drafts arrive as suggestions staff confirm, and tiers come from the ranking across the whole portfolio. Treat any AI score as a draft with a named reviewer, as you would a consultant's.
Related Resources
Plan and prioritize
- How to measure climate resilience progress, honestly: reporting what the portfolio delivers.
- How to implement a hazard mitigation plan between updates: keeping the plan's actions moving.
- Climate resilience planning guides: the library's planning, assessment and adaptation guides in one place.
- How to build a climate resilience plan for municipalities and government agencies: the plan the portfolio comes from.
- How to write an RFP for a climate adaptation plan: scope the planning work before you hire it.
- Climate risk assessment tool: a first read on the hazards your criteria should weigh.
Fund the portfolio
- How to build resilience into your capital improvement plan: getting ranked projects into the budget.
- What is a resilience authority, and when do you need one?: the financing vehicle some regions create.
- Navigating federal climate funding in 2026: a resilience finance playbook for municipalities.
- How to identify and secure funding for climate resilience projects: building the funding library.
- How to write an RFP for a resilience funding strategy: when you want outside help assembling the money.
- Climate adaptation cost calculator: avoided losses and benefit-cost estimates by hazard.
- The ROI of climate adaptation: the economic case for acting early.
Tools and proof
- Aptation: the resilience planning and delivery platform described in this article.
- Annapolis Maritime Resilience Initiative: from 38 sites of concern to ten priority projects.
- Anne Arundel County climate risk and resilience profile: the hazards behind one public portfolio.
- Sustainability strategy for municipalities and government: how Council Fire works with public agencies.
Bring us your project list
Send us the list you are working from, whatever shape it is in: a spreadsheet, a hazard mitigation plan or a capital program. We will talk through how Aptation would hold it, scored, funded and tracked, and where your criteria may need work first. Start the conversation on our contact page and choose Climate resilience or Software & AI (CF Labs).
About the Author
George Chmael II is Council Fire's Founder & CEO. He has led the firm since its founding and through its B Corp certification in 2010. Council Fire's climate resilience practice works with cities, counties, ports and authorities on planning, funding and delivery, and Council Fire Labs builds the software that holds that work together.
Cover photograph: Pexels — Aerial View of Coastal Highway Over Mudflats, by Fu Shan Un. Illustrative stock photograph, not a Council Fire project.





FAQ