
Jul 10, 2026
Policy Alignment for Social and Environmental Goals
Sustainability Strategy
In This Article
Turn climate, equity, and resilience aims into everyday rules: map policies, resolve conflicts, set measurable targets, and track outcomes.
Policy Alignment for Social and Environmental Goals
If your rules for spending, hiring, buying, and reporting do not match your stated goals, your plan will fail. I’d sum up the article this way: policy alignment is how an organization turns climate, equity, resilience, and financial aims into day-to-day decisions that hold up under pressure.
A few facts make the case plain. CDP found that 215 major companies face nearly $1 trillion in climate-related risk, much of it likely within about five years. At the same time, disclosure demands are growing, and communities, staff, investors, and boards want proof that policies match public promises.
Here’s the core message in simple terms:
I need one decision system that links goals, rules, metrics, and accountability
I should map current policies to spot conflicts, gaps, and weak enforcement
I need to turn broad aims into clear requirements, named owners, deadlines, and reporting
I should track outcomes, not just activity, with data broken out by race, income, and place
I need review triggers so bad results lead to policy changes, not just dashboards
I should treat alignment as a repeat cycle: diagnose, design, implement, evaluate
The article also makes one point that stands out: a policy can look fine on paper and still work against the goal. A travel rule can undercut an emissions target. A grant rule can block the very groups a funder says it wants to reach. A capital plan can support growth while adding flood, heat, or pollution risk.
What I take from this is simple: aligned policy is not a statement. It is a set of rules that guides procurement, budgets, investment, community input, and review in the same direction.
A short comparison helps frame the article’s main ideas:
Focus area | What it does | What to look for |
|---|---|---|
Integrated impact framework | Connects goals, policies, metrics, and responsibility | Targets, baselines, review cycles, owners |
Policy alignment | Makes sure rules support the same outcomes | Fewer conflicts across departments and decisions |
Impact measurement | Shows whether conditions changed | Health, emissions, access, cost, exposure gaps |
Social impact assessment | Shows who gains, who pays, and why | Community effects, cumulative burdens, course correction |
Bottom line: if I want social and climate goals to matter, I have to build them into the rules people use every day.
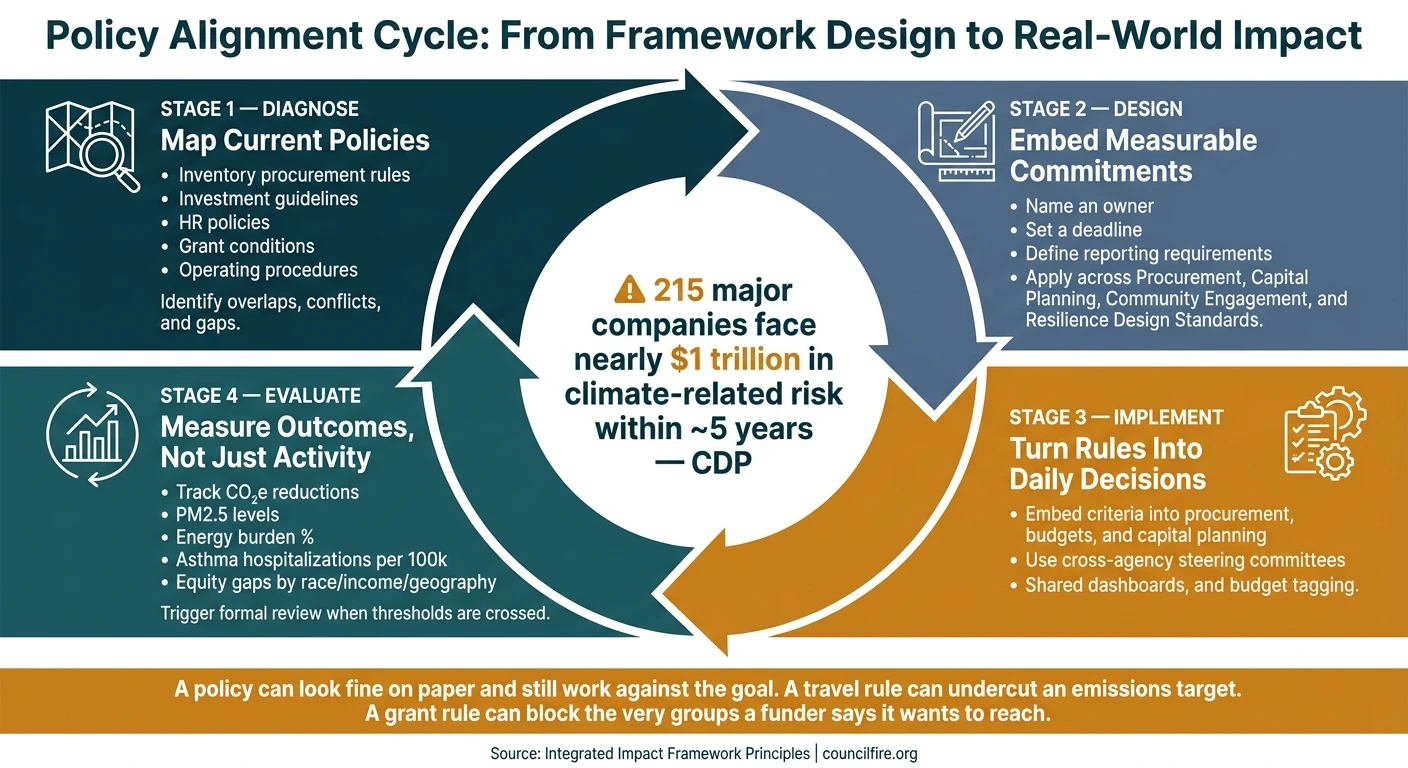
Policy Alignment Cycle: From Framework Design to Real-World Impact
ClimEQ webinar: Climate-SDG interaction and policy coherence for a post-2030 Agenda
1. Defining Integrated Impact Frameworks and Policy Alignment
Start with the terms. Integrated impact frameworks connect goals, policies, indicators, and accountability. Policy alignment keeps all of that aimed at the same outcomes.
An integrated impact framework brings social, environmental, and economic goals into one decision system. It ties big commitments - like a net-zero pledge or an equity goal - to specific policies, measurable indicators, and clear lines of accountability.
Policy alignment is the aim: policies should support shared outcomes rather than pull in different directions. Policy coherence helps avoid conflict across sectors and levels of government. Policy integration builds climate, equity, and health into core policy design. Social impact assessment tests likely effects on communities and vulnerable groups.
Those differences matter. If a team mixes these terms up, it can choose the wrong tools or miss a conflict that should have been caught early.
How Integrated Impact Frameworks Work in Practice
A strong integrated impact framework works as a continuous feedback loop. In plain terms, it is not a one-time plan that sits in a slide deck. It is a system that gets used, checked, and adjusted.
It usually includes five core parts:
Time-bound targets, such as reducing community-level greenhouse gas emissions by 50% by 2035
Indicators with baselines tied to those targets
Impact pathways that show how a policy is expected to lead to outcomes
Governance roles that assign responsibility across departments and partners
Regular review cycles that feed lessons back into decisions
The impact pathway matters a lot because it makes the logic visible. For example, building standards paired with retrofit incentives and workforce training can cut energy use, create local jobs, lower emissions, and improve indoor air quality. That chain of effects is easy to miss when each program gets tracked on its own. An integrated framework keeps those cross-effects in view.
Governance is what keeps the system alive. Cross-functional steering committees, sustainability offices, and formal community engagement mechanisms help make sure the framework is managed in practice, not just written down for show.
Goal Sets Used as Alignment References
Most organizations anchor alignment to a small group of reference points. These often include the SDGs, federal sustainability directives, environmental justice commitments, science-based targets, and internal ESG goals.
Those references give teams a shared basis for hard calls. They can help settle trade-offs, shape budgets, guide policy design, and steer performance management when priorities start to compete.
Table: Policy Coherence, Policy Integration, and Impact Management Compared
The table below separates closely related terms so teams can use them with care.
Concept | Definition | Typical Instruments | Relevance to Social & Environmental Goals |
|---|---|---|---|
Policy Coherence | Policies across sectors and levels of government are mutually supportive and don't contradict each other | Interagency reviews, regulatory impact assessments, cross-department coordination | Prevents situations where economic incentives undermine climate targets or housing policy conflicts with equity goals |
Policy Integration | Building climate, equity, and health into the core design of policies and institutions | Mainstreaming requirements, sustainability criteria in budgeting, integrated planning mandates | Ensures sustainability and equity are built into mandates - not added on separately |
Governance and Disclosure Policies | Organizational policies governing how environmental, social, and governance factors are managed and reported | Board oversight rules, disclosure frameworks, supply-chain standards, stakeholder engagement policies | Provides an accountability structure and investor-relevant metrics |
Social Impact Assessment | Process for assessing the social effects of a proposed policy, program, or project | Community surveys, distributional analysis, stakeholder participation, mitigation planning | Core analytic tool for anticipating who benefits and who bears costs |
Impact Management | Ongoing process of measuring and improving social and environmental outcomes across a portfolio | Impact pathways, IRIS+ metrics, theory of change models, review cycles | Shifts focus from compliance reporting to active management of real-world outcomes |
With those core terms in place, the next section turns to governance structures and the trade-offs that determine whether alignment holds up under pressure.
2. Foundations of Effective Policy Alignment
Once the framework is set, the next job is making alignment hold up in day-to-day decisions. That takes clear commitments, long-range planning, and policies built to support social, environmental, and economic goals at the same time. In plain terms, these are the rules that shape procurement, budgets, hiring, and investment choices.[3][6]
Building Synergies and Managing Trade-Offs
When policies are designed well, they can deliver more than one gain at once. Sustainable procurement, for example, can lower emissions, support inclusion, and strengthen local resilience.
Still, synergies are only part of the picture. Unresolved trade-offs are a major source of policy incoherence.[10][11] A highway expansion may improve access while also increasing vehicle emissions and converting open land. An energy tax may speed up decarbonization while making energy poverty worse for low-income households. When these trade-offs are ignored, implementation tends to break down. The better path is to identify them early, spell them out plainly, and pair the main policy with support measures in mobility, land use, or social protection.[10][11]
Once those trade-offs are on the table, governance has to make clear who is responsible for dealing with them.
Governance Structures That Support Alignment
Good governance is what keeps alignment from turning into nice language on paper. The structures that work best tend to share the same traits: clear authority, enough resources, and accountability.[3][6]
In practice, that often means a cross-functional steering group with executive and board oversight.[4][8][7] These groups work when the basics are in place:
named owners for each goal
a set budget for analysis and engagement
a scheduled review calendar
Without those concrete pieces, even well-meaning committees tend to drift.
That setup also depends on something more basic: each policy needs a clear chain of intended effects.
Connecting Policies to Impact Pathways
A policy is not ready until its path from action to outcome is easy to follow. Impact pathway mapping makes that chain visible before approval.
Take an investment guideline that favors renewable energy and energy efficiency. That choice can lead to more deployment of clean technologies, lower greenhouse gas and pollutant emissions, better air quality, fewer respiratory and cardiovascular health impacts, lower health costs, and higher productivity.[5][9] Tracing these pathways also brings distributional effects into view. You can see who benefits, who carries the costs, and whether the policy eases or deepens existing inequities.
3. A Step-by-Step Process for Aligning Policies Within an Integrated Framework
Once governance and impact pathways are set, the next move is to turn them into policy requirements, named owners, and review cycles. That sounds dry on paper, but it’s where a framework starts doing actual work. The same process fits public agencies and private organizations, and it can be repeated as goals, data, and operating conditions shift.
Map Current Policies Against Priority Goals
Begin with a full inventory of the policy tools that shape how the organization runs: procurement rules, investment guidelines, HR policies, grant conditions, design standards, and operating procedures. For each one, note its stated purpose, who owns it, what it covers, and how it is enforced.
This mapping step checks whether strategy, governance, and desired outcomes line up in day-to-day practice. Match each policy instrument against priority goals such as emissions reduction, climate resilience, environmental justice, workforce well-being, resource efficiency, and biodiversity. The point is simple: find overlaps, conflicts, and gaps before they turn into drift or mixed signals.
A 2019 analysis found that every U.S. state has environmental procurement policies and guidelines, yet the quality of those policies varies significantly.[12] That matters because many organizations already have policy language in place, but the inventory often shows a familiar problem: coverage exists on paper, while enforcement and measurement are still thin.
Use this inventory as the baseline for revision priorities and indicator selection.
Revise Policies to Embed Measurable Commitments
After gaps are identified, convert each one into a measurable requirement. Every revision should name an owner, set a deadline, and spell out what must be reported. Without those three pieces, policy can drift into good intentions and little else.
Apply that approach across four core domains:
Procurement: Require third-party verified greenhouse gas inventories from suppliers, set minimum recycled content percentages, and weigh sustainability performance in contract award decisions.
Capital planning: Require climate resilience and environmental justice screens for projects above a defined dollar threshold, with documented findings reviewed at the board level.
Community engagement: Specify the minimum number of public meetings, outreach milestones for underrepresented groups, and how community input must be incorporated and documented.
Resilience design standards: Reference specific parameters - flood elevations, heat stress thresholds, redundancy requirements - based on current climate projections, with scheduled reviews as new data become available.
Set time-bound revision cycles that call for updated design documents, monitoring plans, and verification. That cadence helps keep policies tied to current conditions instead of last year’s assumptions.
Table: Policy Instruments Mapped to Goals
Use this matrix to track how core policy instruments support the framework's priority goals. It helps teams spot where coverage is strong, weak, or missing.
Key: ● Strong alignment | ○ Weak or partial alignment | – Absent
Policy Instrument | Equity | Climate Mitigation | Resilience | Biodiversity |
|---|---|---|---|---|
Procurement Standards | ● Supplier diversity clauses | ● Low-carbon requirements | ○ | – |
HR Policies | ● DEI targets | – | ○ Workforce safety | – |
Capital Planning Criteria | ○ | ● Energy efficiency screens | ● Design standards | ○ |
Investment Guidelines | ○ | ● ESG metrics | ○ | ○ |
Operating Procedures | ○ | ○ Waste reduction | ○ | ○ |
Grant Conditions | ● Community benefit requirements | ○ | – | – |
'–' marks the highest-priority revision targets. '○' means the policy needs measurable commitments or clearer accountability. Update the table regularly as policies change and new goals are added.
4. Measurement, Indicators, and Impact Assessment
Measurement only matters when it shows that conditions are changing, not just that activity took place. Once a policy includes measurable commitments, indicators help show whether those commitments are shifting outcomes in the world people actually live in.
Choosing Indicators That Reflect Real Outcomes
Outcome indicators ask the harder question: did anything get better?
For environmental goals, that means tracking metrics such as annual CO₂e reductions, changes in ambient PM2.5 concentrations measured in µg/m³, per-capita potable water use reduction, and landfill diversion rate as a share of total waste. On the social side, useful indicators include asthma hospitalizations per 100,000 people, the share of low-income households with access to clean transit options within a 10-minute walk, energy burden as a percentage of household income, OSHA recordable incident rates, and service and exposure disparities by race and income.[19]
In the U.S., organizations can pull from federal, state, local, and community-level data sources, including EPA air and water quality monitoring networks, CDC and local health department records, the American Community Survey, Department of Labor and OSHA databases, and equity-focused tools like the National Equity Atlas. Research shows that Black, Asian American, Latinx, and low-income communities in the U.S. face a disproportionate share of air pollution exposure,[19] so indicators need to be broken out by race, ethnicity, income, and geography. Without that, measurement can miss the people carrying the heaviest burden.
Before locking in any indicator, put it through five tests:
Relevance to the policy’s intended outcome
Measurability with the data on hand
Sensitivity to the changes the policy is meant to produce
Data availability at the needed reporting frequency
Interpretability for the people expected to act on the results
It also helps to test the shortlist with community representatives. A metric may look fine on paper and still fail to reflect what success looks like on the ground.
Integrating Social Impact Assessment Into Policy Cycles
Indicators show what changed; social impact assessment explains why it changed and who felt the effects.
Social impact assessment, or SIA, works best when it runs through the full policy cycle instead of showing up once as a compliance task.
During policy design, SIA teams map affected populations, study how benefits and burdens may fall across demographic groups, and assess cumulative impacts. That includes overlapping stressors like pollution, flood risk, and economic insecurity hitting the same community at the same time. The EPA has identified cumulative impact assessment as a key mechanism to address environmental injustice and has committed research resources to build robust scientific approaches.[14][15] At this stage, scenario analysis and community co-design help build safeguards before a policy is adopted.
During implementation, SIA shifts toward live monitoring. Teams track indicators such as displacement risk, service access, health complaints, and employment quality. Community feedback, gathered through advisory boards, participatory mapping, or online portals, can then trigger changes to siting, eligibility, or outreach. That kind of loop keeps policy from drifting away from its stated purpose.
In the evaluation phase, SIA looks at longer-term effects: intergenerational impacts, shifts in social cohesion, and whether the policy has reduced or widened systemic inequities. Findings should tie directly to formal decision points like policy renewals, budget cycles, and regulatory updates, and they should be shared publicly to keep accountability in place. When SIA is built in this way, it becomes a governance tool rather than a reporting exercise. It also supports environmental justice by making sure cumulative burdens on historically marginalized communities are tracked, named, and addressed.[17]
Feedback loops keep measurement from turning into a static archive. Policies should include clear triggers. If a key indicator crosses a set threshold - say, PM2.5 levels rise in an overburdened neighborhood, or an equity gap does not close within a defined timeframe - a formal review process should start on its own. Linking indicator reviews to quarterly dashboards, annual impact reports, and capital planning cycles helps ensure that what gets measured also shapes where money and attention go next.[16][18] Council Fire designs integrated dashboards and governance routines that connect metrics to planning and operations.
Table: Indicator Sets for Policy Evaluation Compared
Use these three indicator sets together to connect broad goals, organizational performance, and community-level change.
Indicator Set | Outcome Type Measured | Likely Data Source | Reporting Cadence | Suitability for Policy Evaluation |
|---|---|---|---|---|
SDG Indicators | Broad societal outcomes (e.g., poverty rates, emissions per capita, health coverage) | National statistical offices, international agencies, large-scale surveys | Annual or multi-year | Strong for long-term policy coherence and global benchmarking; less granular for local decisions |
ESG KPIs | Organizational performance and risk (e.g., GHG intensity, water use, board diversity) | Corporate reporting systems, utility data, HR systems, third-party audits | Quarterly or annual | Strong for capital allocation and corporate accountability; more disclosure-oriented than outcome-focused |
Social Impact Metrics | Direct changes experienced by target populations (e.g., reduced disease incidence, improved employment, service access) | Program monitoring data, community surveys, qualitative research, administrative records | Monthly or quarterly | Strong for course correction and equity analysis; requires investment in primary data collection |
Effective policy evaluation uses all three together. SDG-aligned indicators offer global coherence and broad outcome coverage. ESG KPIs link organizational performance to capital flows. Targeted social impact metrics show what is changing for specific communities in day-to-day life. Put together, this hybrid set gives organizations both the big-picture view and the ground-level detail needed to act.
The next step is turning these findings into operating changes, budgets, and review cycles.
5. Moving From Framework Design to Sustained Implementation
Indicators and review triggers should shape procurement, budgets, and program design. Measurement tells you whether a policy is working. Implementation decides whether that policy changes anything on the ground. That’s the hard part: turning an integrated framework into daily choices about infrastructure, purchasing, supply chains, and community programs.
How Systems Thinking Improves Policy Decisions
Siloed policy design creates contradictions and misses co-benefits.[21]
Systems thinking helps fix that by showing how sectors affect each other. Electrifying a city bus fleet, for example, doesn’t just change transportation. It also affects grid capacity, neighborhood air quality, and workforce training. Miss those links, and an agency can end up buying buses before the charging setup and labor pipeline are in place.
Causal loop diagrams and scenario modeling help teams spot leverage points, such as procurement shifts that improve emissions, local hiring, and public health at the same time.[21]
That kind of analysis only matters if it shows up in how decisions get made. It has to be built into decision rights, budget reviews, and shared dashboards. Cross-agency steering committees, MOUs, shared dashboards, and budget tagging help keep climate and equity decisions lined up.[2][13]
Council Fire's Role in Turning Strategy Into Implementation
The next step is turning analysis into operating rules. Council Fire works with governments, foundations, NGOs, and companies to turn integrated impact frameworks into operating roadmaps. That includes sequencing investments, embedding procurement criteria, and building measurement systems that guide day-to-day decisions.[20][1]
Conclusion: What Aligned Policy Looks Like in Practice
Aligned policy is one operating model that runs across planning, budgeting, procurement, and review. The table below shows what each phase needs.
Alignment Stage | Consulting Support Function | Key Activities |
|---|---|---|
Diagnosis | Systems Analysis | Mapping current policies, infrastructure, and impact pathways to identify misalignments and trade-offs |
Design | Impact Design & Stakeholder Engagement | Facilitating stakeholder engagement to co-create policy options; setting integrated impact targets; planning regenerative infrastructure and circular economy interventions |
Implementation | Infrastructure Planning & Program Management | Detailed infrastructure planning, program management support, and embedding impact criteria into procurement, capital planning, and governance processes |
Evaluation | Impact Measurement & Data-Driven Tracking | Impact measurement frameworks, dashboard design, and learning processes that use data to refine policies and investments over time |
Each stage builds on the one before it. Diagnosis without design creates insight with no direction. Design without implementation creates plans that stall out. Implementation without evaluation creates activity with no accountability.
Organizations that treat diagnosis → design → implementation → evaluation as a continuous cycle, not a one-time effort, are the ones that close the gap between what policy says and what changes in the world.
FAQs
How do I find policy conflicts fast?
Use a systems-thinking approach to spot conflicts early. Look at how policies, resources, and stakeholder interests affect one another. Tools like systems mapping and causal loop diagrams can help you see where one policy may undercut another.
It also helps to run regular stakeholder materiality assessments and keep a central tracking system, such as a stakeholder register. That gives teams one place to flag misalignments before they turn into delays or strategy breakdowns.
Which metrics show real impact?
Real impact shows up in Triple Bottom Line metrics that turn broad goals into data teams can act on. That means looking at three areas at once:
Financial: cost savings and revenue from sustainable products
Social: employee turnover and community investment
Environmental: Scope 1, 2, and 3 emissions and resource efficiency
This matters because good intentions don’t tell you much on their own. Numbers do. If a company says it cares about sustainability, these metrics show whether that work is cutting costs, bringing in sales, supporting people, and reducing harm.
Using frameworks like GRI or SASB helps keep reporting rigorous, credible, and aligned with organizational and stakeholder priorities. In plain terms, they give teams a shared playbook, so reporting isn’t scattered or shaped by guesswork.
Who should own policy alignment internally?
Organizations should assign an internal owner to each stakeholder group. That simple step keeps messaging aligned and cuts down on silos, where different teams reach out to the same people with mixed signals.
This matters even more when you look inside the organization. Employees, executives, and board members often care about different things, ask different questions, and respond to different messages. Without clear ownership, it's easy for communication to drift or clash.
Tools like RACI charts help sort this out. They spell out who is responsible, accountable, consulted, and informed, so everyone knows their role before messages go out.
Related Blog Posts
Latest Articles
©2026

Narrative Change and Power Building: The Missing Half of Advocacy
Narrative change is the process of disrupting dominant narratives that normalize inequity and advancing new narratives from historically marginalized communities.

Funding Resilience Without Federal Grants
BRIC is unreliable and FEMA is shrinking. Here's how cities fund climate resilience with dedicated revenue, blended finance, and a coordinating authority.

The ESG Blind Spot: How AI Is Finding Risks in Companies Nobody Else Is Watching
Norway's sovereign wealth fund uses AI to screen 7,200 portfolio companies for forced labor and corruption within 24 hours. The real story is the emerging-market coverage gap that traditional ESG data vendors miss — and what it means for any company with a global supply chain.
Narrative Change and Power Building: The Missing Half of Advocacy
Narrative change is the process of disrupting dominant narratives that normalize inequity and advancing new narratives from historically marginalized communities.
Funding Resilience Without Federal Grants
BRIC is unreliable and FEMA is shrinking. Here's how cities fund climate resilience with dedicated revenue, blended finance, and a coordinating authority.
The ESG Blind Spot: How AI Is Finding Risks in Companies Nobody Else Is Watching
Norway's sovereign wealth fund uses AI to screen 7,200 portfolio companies for forced labor and corruption within 24 hours. The real story is the emerging-market coverage gap that traditional ESG data vendors miss — and what it means for any company with a global supply chain.
FAQ
01
What does it really mean to “redefine profit”?
02
What makes Council Fire different?
03
Who does Council Fire work with?
04
What does working with Council Fire actually look like?
05
How does Council Fire help organizations turn big goals into action?
06
How does Council Fire define and measure success?
07
How does technology fit into Council Fire’s work?
Jul 10, 2026
Policy Alignment for Social and Environmental Goals
Sustainability Strategy
In This Article
Turn climate, equity, and resilience aims into everyday rules: map policies, resolve conflicts, set measurable targets, and track outcomes.
Policy Alignment for Social and Environmental Goals
If your rules for spending, hiring, buying, and reporting do not match your stated goals, your plan will fail. I’d sum up the article this way: policy alignment is how an organization turns climate, equity, resilience, and financial aims into day-to-day decisions that hold up under pressure.
A few facts make the case plain. CDP found that 215 major companies face nearly $1 trillion in climate-related risk, much of it likely within about five years. At the same time, disclosure demands are growing, and communities, staff, investors, and boards want proof that policies match public promises.
Here’s the core message in simple terms:
I need one decision system that links goals, rules, metrics, and accountability
I should map current policies to spot conflicts, gaps, and weak enforcement
I need to turn broad aims into clear requirements, named owners, deadlines, and reporting
I should track outcomes, not just activity, with data broken out by race, income, and place
I need review triggers so bad results lead to policy changes, not just dashboards
I should treat alignment as a repeat cycle: diagnose, design, implement, evaluate
The article also makes one point that stands out: a policy can look fine on paper and still work against the goal. A travel rule can undercut an emissions target. A grant rule can block the very groups a funder says it wants to reach. A capital plan can support growth while adding flood, heat, or pollution risk.
What I take from this is simple: aligned policy is not a statement. It is a set of rules that guides procurement, budgets, investment, community input, and review in the same direction.
A short comparison helps frame the article’s main ideas:
Focus area | What it does | What to look for |
|---|---|---|
Integrated impact framework | Connects goals, policies, metrics, and responsibility | Targets, baselines, review cycles, owners |
Policy alignment | Makes sure rules support the same outcomes | Fewer conflicts across departments and decisions |
Impact measurement | Shows whether conditions changed | Health, emissions, access, cost, exposure gaps |
Social impact assessment | Shows who gains, who pays, and why | Community effects, cumulative burdens, course correction |
Bottom line: if I want social and climate goals to matter, I have to build them into the rules people use every day.
Policy Alignment Cycle: From Framework Design to Real-World Impact
ClimEQ webinar: Climate-SDG interaction and policy coherence for a post-2030 Agenda
1. Defining Integrated Impact Frameworks and Policy Alignment
Start with the terms. Integrated impact frameworks connect goals, policies, indicators, and accountability. Policy alignment keeps all of that aimed at the same outcomes.
An integrated impact framework brings social, environmental, and economic goals into one decision system. It ties big commitments - like a net-zero pledge or an equity goal - to specific policies, measurable indicators, and clear lines of accountability.
Policy alignment is the aim: policies should support shared outcomes rather than pull in different directions. Policy coherence helps avoid conflict across sectors and levels of government. Policy integration builds climate, equity, and health into core policy design. Social impact assessment tests likely effects on communities and vulnerable groups.
Those differences matter. If a team mixes these terms up, it can choose the wrong tools or miss a conflict that should have been caught early.
How Integrated Impact Frameworks Work in Practice
A strong integrated impact framework works as a continuous feedback loop. In plain terms, it is not a one-time plan that sits in a slide deck. It is a system that gets used, checked, and adjusted.
It usually includes five core parts:
Time-bound targets, such as reducing community-level greenhouse gas emissions by 50% by 2035
Indicators with baselines tied to those targets
Impact pathways that show how a policy is expected to lead to outcomes
Governance roles that assign responsibility across departments and partners
Regular review cycles that feed lessons back into decisions
The impact pathway matters a lot because it makes the logic visible. For example, building standards paired with retrofit incentives and workforce training can cut energy use, create local jobs, lower emissions, and improve indoor air quality. That chain of effects is easy to miss when each program gets tracked on its own. An integrated framework keeps those cross-effects in view.
Governance is what keeps the system alive. Cross-functional steering committees, sustainability offices, and formal community engagement mechanisms help make sure the framework is managed in practice, not just written down for show.
Goal Sets Used as Alignment References
Most organizations anchor alignment to a small group of reference points. These often include the SDGs, federal sustainability directives, environmental justice commitments, science-based targets, and internal ESG goals.
Those references give teams a shared basis for hard calls. They can help settle trade-offs, shape budgets, guide policy design, and steer performance management when priorities start to compete.
Table: Policy Coherence, Policy Integration, and Impact Management Compared
The table below separates closely related terms so teams can use them with care.
Concept | Definition | Typical Instruments | Relevance to Social & Environmental Goals |
|---|---|---|---|
Policy Coherence | Policies across sectors and levels of government are mutually supportive and don't contradict each other | Interagency reviews, regulatory impact assessments, cross-department coordination | Prevents situations where economic incentives undermine climate targets or housing policy conflicts with equity goals |
Policy Integration | Building climate, equity, and health into the core design of policies and institutions | Mainstreaming requirements, sustainability criteria in budgeting, integrated planning mandates | Ensures sustainability and equity are built into mandates - not added on separately |
Governance and Disclosure Policies | Organizational policies governing how environmental, social, and governance factors are managed and reported | Board oversight rules, disclosure frameworks, supply-chain standards, stakeholder engagement policies | Provides an accountability structure and investor-relevant metrics |
Social Impact Assessment | Process for assessing the social effects of a proposed policy, program, or project | Community surveys, distributional analysis, stakeholder participation, mitigation planning | Core analytic tool for anticipating who benefits and who bears costs |
Impact Management | Ongoing process of measuring and improving social and environmental outcomes across a portfolio | Impact pathways, IRIS+ metrics, theory of change models, review cycles | Shifts focus from compliance reporting to active management of real-world outcomes |
With those core terms in place, the next section turns to governance structures and the trade-offs that determine whether alignment holds up under pressure.
2. Foundations of Effective Policy Alignment
Once the framework is set, the next job is making alignment hold up in day-to-day decisions. That takes clear commitments, long-range planning, and policies built to support social, environmental, and economic goals at the same time. In plain terms, these are the rules that shape procurement, budgets, hiring, and investment choices.[3][6]
Building Synergies and Managing Trade-Offs
When policies are designed well, they can deliver more than one gain at once. Sustainable procurement, for example, can lower emissions, support inclusion, and strengthen local resilience.
Still, synergies are only part of the picture. Unresolved trade-offs are a major source of policy incoherence.[10][11] A highway expansion may improve access while also increasing vehicle emissions and converting open land. An energy tax may speed up decarbonization while making energy poverty worse for low-income households. When these trade-offs are ignored, implementation tends to break down. The better path is to identify them early, spell them out plainly, and pair the main policy with support measures in mobility, land use, or social protection.[10][11]
Once those trade-offs are on the table, governance has to make clear who is responsible for dealing with them.
Governance Structures That Support Alignment
Good governance is what keeps alignment from turning into nice language on paper. The structures that work best tend to share the same traits: clear authority, enough resources, and accountability.[3][6]
In practice, that often means a cross-functional steering group with executive and board oversight.[4][8][7] These groups work when the basics are in place:
named owners for each goal
a set budget for analysis and engagement
a scheduled review calendar
Without those concrete pieces, even well-meaning committees tend to drift.
That setup also depends on something more basic: each policy needs a clear chain of intended effects.
Connecting Policies to Impact Pathways
A policy is not ready until its path from action to outcome is easy to follow. Impact pathway mapping makes that chain visible before approval.
Take an investment guideline that favors renewable energy and energy efficiency. That choice can lead to more deployment of clean technologies, lower greenhouse gas and pollutant emissions, better air quality, fewer respiratory and cardiovascular health impacts, lower health costs, and higher productivity.[5][9] Tracing these pathways also brings distributional effects into view. You can see who benefits, who carries the costs, and whether the policy eases or deepens existing inequities.
3. A Step-by-Step Process for Aligning Policies Within an Integrated Framework
Once governance and impact pathways are set, the next move is to turn them into policy requirements, named owners, and review cycles. That sounds dry on paper, but it’s where a framework starts doing actual work. The same process fits public agencies and private organizations, and it can be repeated as goals, data, and operating conditions shift.
Map Current Policies Against Priority Goals
Begin with a full inventory of the policy tools that shape how the organization runs: procurement rules, investment guidelines, HR policies, grant conditions, design standards, and operating procedures. For each one, note its stated purpose, who owns it, what it covers, and how it is enforced.
This mapping step checks whether strategy, governance, and desired outcomes line up in day-to-day practice. Match each policy instrument against priority goals such as emissions reduction, climate resilience, environmental justice, workforce well-being, resource efficiency, and biodiversity. The point is simple: find overlaps, conflicts, and gaps before they turn into drift or mixed signals.
A 2019 analysis found that every U.S. state has environmental procurement policies and guidelines, yet the quality of those policies varies significantly.[12] That matters because many organizations already have policy language in place, but the inventory often shows a familiar problem: coverage exists on paper, while enforcement and measurement are still thin.
Use this inventory as the baseline for revision priorities and indicator selection.
Revise Policies to Embed Measurable Commitments
After gaps are identified, convert each one into a measurable requirement. Every revision should name an owner, set a deadline, and spell out what must be reported. Without those three pieces, policy can drift into good intentions and little else.
Apply that approach across four core domains:
Procurement: Require third-party verified greenhouse gas inventories from suppliers, set minimum recycled content percentages, and weigh sustainability performance in contract award decisions.
Capital planning: Require climate resilience and environmental justice screens for projects above a defined dollar threshold, with documented findings reviewed at the board level.
Community engagement: Specify the minimum number of public meetings, outreach milestones for underrepresented groups, and how community input must be incorporated and documented.
Resilience design standards: Reference specific parameters - flood elevations, heat stress thresholds, redundancy requirements - based on current climate projections, with scheduled reviews as new data become available.
Set time-bound revision cycles that call for updated design documents, monitoring plans, and verification. That cadence helps keep policies tied to current conditions instead of last year’s assumptions.
Table: Policy Instruments Mapped to Goals
Use this matrix to track how core policy instruments support the framework's priority goals. It helps teams spot where coverage is strong, weak, or missing.
Key: ● Strong alignment | ○ Weak or partial alignment | – Absent
Policy Instrument | Equity | Climate Mitigation | Resilience | Biodiversity |
|---|---|---|---|---|
Procurement Standards | ● Supplier diversity clauses | ● Low-carbon requirements | ○ | – |
HR Policies | ● DEI targets | – | ○ Workforce safety | – |
Capital Planning Criteria | ○ | ● Energy efficiency screens | ● Design standards | ○ |
Investment Guidelines | ○ | ● ESG metrics | ○ | ○ |
Operating Procedures | ○ | ○ Waste reduction | ○ | ○ |
Grant Conditions | ● Community benefit requirements | ○ | – | – |
'–' marks the highest-priority revision targets. '○' means the policy needs measurable commitments or clearer accountability. Update the table regularly as policies change and new goals are added.
4. Measurement, Indicators, and Impact Assessment
Measurement only matters when it shows that conditions are changing, not just that activity took place. Once a policy includes measurable commitments, indicators help show whether those commitments are shifting outcomes in the world people actually live in.
Choosing Indicators That Reflect Real Outcomes
Outcome indicators ask the harder question: did anything get better?
For environmental goals, that means tracking metrics such as annual CO₂e reductions, changes in ambient PM2.5 concentrations measured in µg/m³, per-capita potable water use reduction, and landfill diversion rate as a share of total waste. On the social side, useful indicators include asthma hospitalizations per 100,000 people, the share of low-income households with access to clean transit options within a 10-minute walk, energy burden as a percentage of household income, OSHA recordable incident rates, and service and exposure disparities by race and income.[19]
In the U.S., organizations can pull from federal, state, local, and community-level data sources, including EPA air and water quality monitoring networks, CDC and local health department records, the American Community Survey, Department of Labor and OSHA databases, and equity-focused tools like the National Equity Atlas. Research shows that Black, Asian American, Latinx, and low-income communities in the U.S. face a disproportionate share of air pollution exposure,[19] so indicators need to be broken out by race, ethnicity, income, and geography. Without that, measurement can miss the people carrying the heaviest burden.
Before locking in any indicator, put it through five tests:
Relevance to the policy’s intended outcome
Measurability with the data on hand
Sensitivity to the changes the policy is meant to produce
Data availability at the needed reporting frequency
Interpretability for the people expected to act on the results
It also helps to test the shortlist with community representatives. A metric may look fine on paper and still fail to reflect what success looks like on the ground.
Integrating Social Impact Assessment Into Policy Cycles
Indicators show what changed; social impact assessment explains why it changed and who felt the effects.
Social impact assessment, or SIA, works best when it runs through the full policy cycle instead of showing up once as a compliance task.
During policy design, SIA teams map affected populations, study how benefits and burdens may fall across demographic groups, and assess cumulative impacts. That includes overlapping stressors like pollution, flood risk, and economic insecurity hitting the same community at the same time. The EPA has identified cumulative impact assessment as a key mechanism to address environmental injustice and has committed research resources to build robust scientific approaches.[14][15] At this stage, scenario analysis and community co-design help build safeguards before a policy is adopted.
During implementation, SIA shifts toward live monitoring. Teams track indicators such as displacement risk, service access, health complaints, and employment quality. Community feedback, gathered through advisory boards, participatory mapping, or online portals, can then trigger changes to siting, eligibility, or outreach. That kind of loop keeps policy from drifting away from its stated purpose.
In the evaluation phase, SIA looks at longer-term effects: intergenerational impacts, shifts in social cohesion, and whether the policy has reduced or widened systemic inequities. Findings should tie directly to formal decision points like policy renewals, budget cycles, and regulatory updates, and they should be shared publicly to keep accountability in place. When SIA is built in this way, it becomes a governance tool rather than a reporting exercise. It also supports environmental justice by making sure cumulative burdens on historically marginalized communities are tracked, named, and addressed.[17]
Feedback loops keep measurement from turning into a static archive. Policies should include clear triggers. If a key indicator crosses a set threshold - say, PM2.5 levels rise in an overburdened neighborhood, or an equity gap does not close within a defined timeframe - a formal review process should start on its own. Linking indicator reviews to quarterly dashboards, annual impact reports, and capital planning cycles helps ensure that what gets measured also shapes where money and attention go next.[16][18] Council Fire designs integrated dashboards and governance routines that connect metrics to planning and operations.
Table: Indicator Sets for Policy Evaluation Compared
Use these three indicator sets together to connect broad goals, organizational performance, and community-level change.
Indicator Set | Outcome Type Measured | Likely Data Source | Reporting Cadence | Suitability for Policy Evaluation |
|---|---|---|---|---|
SDG Indicators | Broad societal outcomes (e.g., poverty rates, emissions per capita, health coverage) | National statistical offices, international agencies, large-scale surveys | Annual or multi-year | Strong for long-term policy coherence and global benchmarking; less granular for local decisions |
ESG KPIs | Organizational performance and risk (e.g., GHG intensity, water use, board diversity) | Corporate reporting systems, utility data, HR systems, third-party audits | Quarterly or annual | Strong for capital allocation and corporate accountability; more disclosure-oriented than outcome-focused |
Social Impact Metrics | Direct changes experienced by target populations (e.g., reduced disease incidence, improved employment, service access) | Program monitoring data, community surveys, qualitative research, administrative records | Monthly or quarterly | Strong for course correction and equity analysis; requires investment in primary data collection |
Effective policy evaluation uses all three together. SDG-aligned indicators offer global coherence and broad outcome coverage. ESG KPIs link organizational performance to capital flows. Targeted social impact metrics show what is changing for specific communities in day-to-day life. Put together, this hybrid set gives organizations both the big-picture view and the ground-level detail needed to act.
The next step is turning these findings into operating changes, budgets, and review cycles.
5. Moving From Framework Design to Sustained Implementation
Indicators and review triggers should shape procurement, budgets, and program design. Measurement tells you whether a policy is working. Implementation decides whether that policy changes anything on the ground. That’s the hard part: turning an integrated framework into daily choices about infrastructure, purchasing, supply chains, and community programs.
How Systems Thinking Improves Policy Decisions
Siloed policy design creates contradictions and misses co-benefits.[21]
Systems thinking helps fix that by showing how sectors affect each other. Electrifying a city bus fleet, for example, doesn’t just change transportation. It also affects grid capacity, neighborhood air quality, and workforce training. Miss those links, and an agency can end up buying buses before the charging setup and labor pipeline are in place.
Causal loop diagrams and scenario modeling help teams spot leverage points, such as procurement shifts that improve emissions, local hiring, and public health at the same time.[21]
That kind of analysis only matters if it shows up in how decisions get made. It has to be built into decision rights, budget reviews, and shared dashboards. Cross-agency steering committees, MOUs, shared dashboards, and budget tagging help keep climate and equity decisions lined up.[2][13]
Council Fire's Role in Turning Strategy Into Implementation
The next step is turning analysis into operating rules. Council Fire works with governments, foundations, NGOs, and companies to turn integrated impact frameworks into operating roadmaps. That includes sequencing investments, embedding procurement criteria, and building measurement systems that guide day-to-day decisions.[20][1]
Conclusion: What Aligned Policy Looks Like in Practice
Aligned policy is one operating model that runs across planning, budgeting, procurement, and review. The table below shows what each phase needs.
Alignment Stage | Consulting Support Function | Key Activities |
|---|---|---|
Diagnosis | Systems Analysis | Mapping current policies, infrastructure, and impact pathways to identify misalignments and trade-offs |
Design | Impact Design & Stakeholder Engagement | Facilitating stakeholder engagement to co-create policy options; setting integrated impact targets; planning regenerative infrastructure and circular economy interventions |
Implementation | Infrastructure Planning & Program Management | Detailed infrastructure planning, program management support, and embedding impact criteria into procurement, capital planning, and governance processes |
Evaluation | Impact Measurement & Data-Driven Tracking | Impact measurement frameworks, dashboard design, and learning processes that use data to refine policies and investments over time |
Each stage builds on the one before it. Diagnosis without design creates insight with no direction. Design without implementation creates plans that stall out. Implementation without evaluation creates activity with no accountability.
Organizations that treat diagnosis → design → implementation → evaluation as a continuous cycle, not a one-time effort, are the ones that close the gap between what policy says and what changes in the world.
FAQs
How do I find policy conflicts fast?
Use a systems-thinking approach to spot conflicts early. Look at how policies, resources, and stakeholder interests affect one another. Tools like systems mapping and causal loop diagrams can help you see where one policy may undercut another.
It also helps to run regular stakeholder materiality assessments and keep a central tracking system, such as a stakeholder register. That gives teams one place to flag misalignments before they turn into delays or strategy breakdowns.
Which metrics show real impact?
Real impact shows up in Triple Bottom Line metrics that turn broad goals into data teams can act on. That means looking at three areas at once:
Financial: cost savings and revenue from sustainable products
Social: employee turnover and community investment
Environmental: Scope 1, 2, and 3 emissions and resource efficiency
This matters because good intentions don’t tell you much on their own. Numbers do. If a company says it cares about sustainability, these metrics show whether that work is cutting costs, bringing in sales, supporting people, and reducing harm.
Using frameworks like GRI or SASB helps keep reporting rigorous, credible, and aligned with organizational and stakeholder priorities. In plain terms, they give teams a shared playbook, so reporting isn’t scattered or shaped by guesswork.
Who should own policy alignment internally?
Organizations should assign an internal owner to each stakeholder group. That simple step keeps messaging aligned and cuts down on silos, where different teams reach out to the same people with mixed signals.
This matters even more when you look inside the organization. Employees, executives, and board members often care about different things, ask different questions, and respond to different messages. Without clear ownership, it's easy for communication to drift or clash.
Tools like RACI charts help sort this out. They spell out who is responsible, accountable, consulted, and informed, so everyone knows their role before messages go out.
Related Blog Posts
Latest Articles
©2026
Narrative Change and Power Building: The Missing Half of Advocacy
Narrative change is the process of disrupting dominant narratives that normalize inequity and advancing new narratives from historically marginalized communities.
Funding Resilience Without Federal Grants
BRIC is unreliable and FEMA is shrinking. Here's how cities fund climate resilience with dedicated revenue, blended finance, and a coordinating authority.
The ESG Blind Spot: How AI Is Finding Risks in Companies Nobody Else Is Watching
Norway's sovereign wealth fund uses AI to screen 7,200 portfolio companies for forced labor and corruption within 24 hours. The real story is the emerging-market coverage gap that traditional ESG data vendors miss — and what it means for any company with a global supply chain.
FAQ
01
What does it really mean to “redefine profit”?
02
What makes Council Fire different?
03
Who does Council Fire work with?
04
What does working with Council Fire actually look like?
05
How does Council Fire help organizations turn big goals into action?
06
How does Council Fire define and measure success?
07
How does technology fit into Council Fire’s work?
Jul 10, 2026
Policy Alignment for Social and Environmental Goals
Sustainability Strategy
In This Article
Turn climate, equity, and resilience aims into everyday rules: map policies, resolve conflicts, set measurable targets, and track outcomes.
Policy Alignment for Social and Environmental Goals
If your rules for spending, hiring, buying, and reporting do not match your stated goals, your plan will fail. I’d sum up the article this way: policy alignment is how an organization turns climate, equity, resilience, and financial aims into day-to-day decisions that hold up under pressure.
A few facts make the case plain. CDP found that 215 major companies face nearly $1 trillion in climate-related risk, much of it likely within about five years. At the same time, disclosure demands are growing, and communities, staff, investors, and boards want proof that policies match public promises.
Here’s the core message in simple terms:
I need one decision system that links goals, rules, metrics, and accountability
I should map current policies to spot conflicts, gaps, and weak enforcement
I need to turn broad aims into clear requirements, named owners, deadlines, and reporting
I should track outcomes, not just activity, with data broken out by race, income, and place
I need review triggers so bad results lead to policy changes, not just dashboards
I should treat alignment as a repeat cycle: diagnose, design, implement, evaluate
The article also makes one point that stands out: a policy can look fine on paper and still work against the goal. A travel rule can undercut an emissions target. A grant rule can block the very groups a funder says it wants to reach. A capital plan can support growth while adding flood, heat, or pollution risk.
What I take from this is simple: aligned policy is not a statement. It is a set of rules that guides procurement, budgets, investment, community input, and review in the same direction.
A short comparison helps frame the article’s main ideas:
Focus area | What it does | What to look for |
|---|---|---|
Integrated impact framework | Connects goals, policies, metrics, and responsibility | Targets, baselines, review cycles, owners |
Policy alignment | Makes sure rules support the same outcomes | Fewer conflicts across departments and decisions |
Impact measurement | Shows whether conditions changed | Health, emissions, access, cost, exposure gaps |
Social impact assessment | Shows who gains, who pays, and why | Community effects, cumulative burdens, course correction |
Bottom line: if I want social and climate goals to matter, I have to build them into the rules people use every day.
Policy Alignment Cycle: From Framework Design to Real-World Impact
ClimEQ webinar: Climate-SDG interaction and policy coherence for a post-2030 Agenda
1. Defining Integrated Impact Frameworks and Policy Alignment
Start with the terms. Integrated impact frameworks connect goals, policies, indicators, and accountability. Policy alignment keeps all of that aimed at the same outcomes.
An integrated impact framework brings social, environmental, and economic goals into one decision system. It ties big commitments - like a net-zero pledge or an equity goal - to specific policies, measurable indicators, and clear lines of accountability.
Policy alignment is the aim: policies should support shared outcomes rather than pull in different directions. Policy coherence helps avoid conflict across sectors and levels of government. Policy integration builds climate, equity, and health into core policy design. Social impact assessment tests likely effects on communities and vulnerable groups.
Those differences matter. If a team mixes these terms up, it can choose the wrong tools or miss a conflict that should have been caught early.
How Integrated Impact Frameworks Work in Practice
A strong integrated impact framework works as a continuous feedback loop. In plain terms, it is not a one-time plan that sits in a slide deck. It is a system that gets used, checked, and adjusted.
It usually includes five core parts:
Time-bound targets, such as reducing community-level greenhouse gas emissions by 50% by 2035
Indicators with baselines tied to those targets
Impact pathways that show how a policy is expected to lead to outcomes
Governance roles that assign responsibility across departments and partners
Regular review cycles that feed lessons back into decisions
The impact pathway matters a lot because it makes the logic visible. For example, building standards paired with retrofit incentives and workforce training can cut energy use, create local jobs, lower emissions, and improve indoor air quality. That chain of effects is easy to miss when each program gets tracked on its own. An integrated framework keeps those cross-effects in view.
Governance is what keeps the system alive. Cross-functional steering committees, sustainability offices, and formal community engagement mechanisms help make sure the framework is managed in practice, not just written down for show.
Goal Sets Used as Alignment References
Most organizations anchor alignment to a small group of reference points. These often include the SDGs, federal sustainability directives, environmental justice commitments, science-based targets, and internal ESG goals.
Those references give teams a shared basis for hard calls. They can help settle trade-offs, shape budgets, guide policy design, and steer performance management when priorities start to compete.
Table: Policy Coherence, Policy Integration, and Impact Management Compared
The table below separates closely related terms so teams can use them with care.
Concept | Definition | Typical Instruments | Relevance to Social & Environmental Goals |
|---|---|---|---|
Policy Coherence | Policies across sectors and levels of government are mutually supportive and don't contradict each other | Interagency reviews, regulatory impact assessments, cross-department coordination | Prevents situations where economic incentives undermine climate targets or housing policy conflicts with equity goals |
Policy Integration | Building climate, equity, and health into the core design of policies and institutions | Mainstreaming requirements, sustainability criteria in budgeting, integrated planning mandates | Ensures sustainability and equity are built into mandates - not added on separately |
Governance and Disclosure Policies | Organizational policies governing how environmental, social, and governance factors are managed and reported | Board oversight rules, disclosure frameworks, supply-chain standards, stakeholder engagement policies | Provides an accountability structure and investor-relevant metrics |
Social Impact Assessment | Process for assessing the social effects of a proposed policy, program, or project | Community surveys, distributional analysis, stakeholder participation, mitigation planning | Core analytic tool for anticipating who benefits and who bears costs |
Impact Management | Ongoing process of measuring and improving social and environmental outcomes across a portfolio | Impact pathways, IRIS+ metrics, theory of change models, review cycles | Shifts focus from compliance reporting to active management of real-world outcomes |
With those core terms in place, the next section turns to governance structures and the trade-offs that determine whether alignment holds up under pressure.
2. Foundations of Effective Policy Alignment
Once the framework is set, the next job is making alignment hold up in day-to-day decisions. That takes clear commitments, long-range planning, and policies built to support social, environmental, and economic goals at the same time. In plain terms, these are the rules that shape procurement, budgets, hiring, and investment choices.[3][6]
Building Synergies and Managing Trade-Offs
When policies are designed well, they can deliver more than one gain at once. Sustainable procurement, for example, can lower emissions, support inclusion, and strengthen local resilience.
Still, synergies are only part of the picture. Unresolved trade-offs are a major source of policy incoherence.[10][11] A highway expansion may improve access while also increasing vehicle emissions and converting open land. An energy tax may speed up decarbonization while making energy poverty worse for low-income households. When these trade-offs are ignored, implementation tends to break down. The better path is to identify them early, spell them out plainly, and pair the main policy with support measures in mobility, land use, or social protection.[10][11]
Once those trade-offs are on the table, governance has to make clear who is responsible for dealing with them.
Governance Structures That Support Alignment
Good governance is what keeps alignment from turning into nice language on paper. The structures that work best tend to share the same traits: clear authority, enough resources, and accountability.[3][6]
In practice, that often means a cross-functional steering group with executive and board oversight.[4][8][7] These groups work when the basics are in place:
named owners for each goal
a set budget for analysis and engagement
a scheduled review calendar
Without those concrete pieces, even well-meaning committees tend to drift.
That setup also depends on something more basic: each policy needs a clear chain of intended effects.
Connecting Policies to Impact Pathways
A policy is not ready until its path from action to outcome is easy to follow. Impact pathway mapping makes that chain visible before approval.
Take an investment guideline that favors renewable energy and energy efficiency. That choice can lead to more deployment of clean technologies, lower greenhouse gas and pollutant emissions, better air quality, fewer respiratory and cardiovascular health impacts, lower health costs, and higher productivity.[5][9] Tracing these pathways also brings distributional effects into view. You can see who benefits, who carries the costs, and whether the policy eases or deepens existing inequities.
3. A Step-by-Step Process for Aligning Policies Within an Integrated Framework
Once governance and impact pathways are set, the next move is to turn them into policy requirements, named owners, and review cycles. That sounds dry on paper, but it’s where a framework starts doing actual work. The same process fits public agencies and private organizations, and it can be repeated as goals, data, and operating conditions shift.
Map Current Policies Against Priority Goals
Begin with a full inventory of the policy tools that shape how the organization runs: procurement rules, investment guidelines, HR policies, grant conditions, design standards, and operating procedures. For each one, note its stated purpose, who owns it, what it covers, and how it is enforced.
This mapping step checks whether strategy, governance, and desired outcomes line up in day-to-day practice. Match each policy instrument against priority goals such as emissions reduction, climate resilience, environmental justice, workforce well-being, resource efficiency, and biodiversity. The point is simple: find overlaps, conflicts, and gaps before they turn into drift or mixed signals.
A 2019 analysis found that every U.S. state has environmental procurement policies and guidelines, yet the quality of those policies varies significantly.[12] That matters because many organizations already have policy language in place, but the inventory often shows a familiar problem: coverage exists on paper, while enforcement and measurement are still thin.
Use this inventory as the baseline for revision priorities and indicator selection.
Revise Policies to Embed Measurable Commitments
After gaps are identified, convert each one into a measurable requirement. Every revision should name an owner, set a deadline, and spell out what must be reported. Without those three pieces, policy can drift into good intentions and little else.
Apply that approach across four core domains:
Procurement: Require third-party verified greenhouse gas inventories from suppliers, set minimum recycled content percentages, and weigh sustainability performance in contract award decisions.
Capital planning: Require climate resilience and environmental justice screens for projects above a defined dollar threshold, with documented findings reviewed at the board level.
Community engagement: Specify the minimum number of public meetings, outreach milestones for underrepresented groups, and how community input must be incorporated and documented.
Resilience design standards: Reference specific parameters - flood elevations, heat stress thresholds, redundancy requirements - based on current climate projections, with scheduled reviews as new data become available.
Set time-bound revision cycles that call for updated design documents, monitoring plans, and verification. That cadence helps keep policies tied to current conditions instead of last year’s assumptions.
Table: Policy Instruments Mapped to Goals
Use this matrix to track how core policy instruments support the framework's priority goals. It helps teams spot where coverage is strong, weak, or missing.
Key: ● Strong alignment | ○ Weak or partial alignment | – Absent
Policy Instrument | Equity | Climate Mitigation | Resilience | Biodiversity |
|---|---|---|---|---|
Procurement Standards | ● Supplier diversity clauses | ● Low-carbon requirements | ○ | – |
HR Policies | ● DEI targets | – | ○ Workforce safety | – |
Capital Planning Criteria | ○ | ● Energy efficiency screens | ● Design standards | ○ |
Investment Guidelines | ○ | ● ESG metrics | ○ | ○ |
Operating Procedures | ○ | ○ Waste reduction | ○ | ○ |
Grant Conditions | ● Community benefit requirements | ○ | – | – |
'–' marks the highest-priority revision targets. '○' means the policy needs measurable commitments or clearer accountability. Update the table regularly as policies change and new goals are added.
4. Measurement, Indicators, and Impact Assessment
Measurement only matters when it shows that conditions are changing, not just that activity took place. Once a policy includes measurable commitments, indicators help show whether those commitments are shifting outcomes in the world people actually live in.
Choosing Indicators That Reflect Real Outcomes
Outcome indicators ask the harder question: did anything get better?
For environmental goals, that means tracking metrics such as annual CO₂e reductions, changes in ambient PM2.5 concentrations measured in µg/m³, per-capita potable water use reduction, and landfill diversion rate as a share of total waste. On the social side, useful indicators include asthma hospitalizations per 100,000 people, the share of low-income households with access to clean transit options within a 10-minute walk, energy burden as a percentage of household income, OSHA recordable incident rates, and service and exposure disparities by race and income.[19]
In the U.S., organizations can pull from federal, state, local, and community-level data sources, including EPA air and water quality monitoring networks, CDC and local health department records, the American Community Survey, Department of Labor and OSHA databases, and equity-focused tools like the National Equity Atlas. Research shows that Black, Asian American, Latinx, and low-income communities in the U.S. face a disproportionate share of air pollution exposure,[19] so indicators need to be broken out by race, ethnicity, income, and geography. Without that, measurement can miss the people carrying the heaviest burden.
Before locking in any indicator, put it through five tests:
Relevance to the policy’s intended outcome
Measurability with the data on hand
Sensitivity to the changes the policy is meant to produce
Data availability at the needed reporting frequency
Interpretability for the people expected to act on the results
It also helps to test the shortlist with community representatives. A metric may look fine on paper and still fail to reflect what success looks like on the ground.
Integrating Social Impact Assessment Into Policy Cycles
Indicators show what changed; social impact assessment explains why it changed and who felt the effects.
Social impact assessment, or SIA, works best when it runs through the full policy cycle instead of showing up once as a compliance task.
During policy design, SIA teams map affected populations, study how benefits and burdens may fall across demographic groups, and assess cumulative impacts. That includes overlapping stressors like pollution, flood risk, and economic insecurity hitting the same community at the same time. The EPA has identified cumulative impact assessment as a key mechanism to address environmental injustice and has committed research resources to build robust scientific approaches.[14][15] At this stage, scenario analysis and community co-design help build safeguards before a policy is adopted.
During implementation, SIA shifts toward live monitoring. Teams track indicators such as displacement risk, service access, health complaints, and employment quality. Community feedback, gathered through advisory boards, participatory mapping, or online portals, can then trigger changes to siting, eligibility, or outreach. That kind of loop keeps policy from drifting away from its stated purpose.
In the evaluation phase, SIA looks at longer-term effects: intergenerational impacts, shifts in social cohesion, and whether the policy has reduced or widened systemic inequities. Findings should tie directly to formal decision points like policy renewals, budget cycles, and regulatory updates, and they should be shared publicly to keep accountability in place. When SIA is built in this way, it becomes a governance tool rather than a reporting exercise. It also supports environmental justice by making sure cumulative burdens on historically marginalized communities are tracked, named, and addressed.[17]
Feedback loops keep measurement from turning into a static archive. Policies should include clear triggers. If a key indicator crosses a set threshold - say, PM2.5 levels rise in an overburdened neighborhood, or an equity gap does not close within a defined timeframe - a formal review process should start on its own. Linking indicator reviews to quarterly dashboards, annual impact reports, and capital planning cycles helps ensure that what gets measured also shapes where money and attention go next.[16][18] Council Fire designs integrated dashboards and governance routines that connect metrics to planning and operations.
Table: Indicator Sets for Policy Evaluation Compared
Use these three indicator sets together to connect broad goals, organizational performance, and community-level change.
Indicator Set | Outcome Type Measured | Likely Data Source | Reporting Cadence | Suitability for Policy Evaluation |
|---|---|---|---|---|
SDG Indicators | Broad societal outcomes (e.g., poverty rates, emissions per capita, health coverage) | National statistical offices, international agencies, large-scale surveys | Annual or multi-year | Strong for long-term policy coherence and global benchmarking; less granular for local decisions |
ESG KPIs | Organizational performance and risk (e.g., GHG intensity, water use, board diversity) | Corporate reporting systems, utility data, HR systems, third-party audits | Quarterly or annual | Strong for capital allocation and corporate accountability; more disclosure-oriented than outcome-focused |
Social Impact Metrics | Direct changes experienced by target populations (e.g., reduced disease incidence, improved employment, service access) | Program monitoring data, community surveys, qualitative research, administrative records | Monthly or quarterly | Strong for course correction and equity analysis; requires investment in primary data collection |
Effective policy evaluation uses all three together. SDG-aligned indicators offer global coherence and broad outcome coverage. ESG KPIs link organizational performance to capital flows. Targeted social impact metrics show what is changing for specific communities in day-to-day life. Put together, this hybrid set gives organizations both the big-picture view and the ground-level detail needed to act.
The next step is turning these findings into operating changes, budgets, and review cycles.
5. Moving From Framework Design to Sustained Implementation
Indicators and review triggers should shape procurement, budgets, and program design. Measurement tells you whether a policy is working. Implementation decides whether that policy changes anything on the ground. That’s the hard part: turning an integrated framework into daily choices about infrastructure, purchasing, supply chains, and community programs.
How Systems Thinking Improves Policy Decisions
Siloed policy design creates contradictions and misses co-benefits.[21]
Systems thinking helps fix that by showing how sectors affect each other. Electrifying a city bus fleet, for example, doesn’t just change transportation. It also affects grid capacity, neighborhood air quality, and workforce training. Miss those links, and an agency can end up buying buses before the charging setup and labor pipeline are in place.
Causal loop diagrams and scenario modeling help teams spot leverage points, such as procurement shifts that improve emissions, local hiring, and public health at the same time.[21]
That kind of analysis only matters if it shows up in how decisions get made. It has to be built into decision rights, budget reviews, and shared dashboards. Cross-agency steering committees, MOUs, shared dashboards, and budget tagging help keep climate and equity decisions lined up.[2][13]
Council Fire's Role in Turning Strategy Into Implementation
The next step is turning analysis into operating rules. Council Fire works with governments, foundations, NGOs, and companies to turn integrated impact frameworks into operating roadmaps. That includes sequencing investments, embedding procurement criteria, and building measurement systems that guide day-to-day decisions.[20][1]
Conclusion: What Aligned Policy Looks Like in Practice
Aligned policy is one operating model that runs across planning, budgeting, procurement, and review. The table below shows what each phase needs.
Alignment Stage | Consulting Support Function | Key Activities |
|---|---|---|
Diagnosis | Systems Analysis | Mapping current policies, infrastructure, and impact pathways to identify misalignments and trade-offs |
Design | Impact Design & Stakeholder Engagement | Facilitating stakeholder engagement to co-create policy options; setting integrated impact targets; planning regenerative infrastructure and circular economy interventions |
Implementation | Infrastructure Planning & Program Management | Detailed infrastructure planning, program management support, and embedding impact criteria into procurement, capital planning, and governance processes |
Evaluation | Impact Measurement & Data-Driven Tracking | Impact measurement frameworks, dashboard design, and learning processes that use data to refine policies and investments over time |
Each stage builds on the one before it. Diagnosis without design creates insight with no direction. Design without implementation creates plans that stall out. Implementation without evaluation creates activity with no accountability.
Organizations that treat diagnosis → design → implementation → evaluation as a continuous cycle, not a one-time effort, are the ones that close the gap between what policy says and what changes in the world.
FAQs
How do I find policy conflicts fast?
Use a systems-thinking approach to spot conflicts early. Look at how policies, resources, and stakeholder interests affect one another. Tools like systems mapping and causal loop diagrams can help you see where one policy may undercut another.
It also helps to run regular stakeholder materiality assessments and keep a central tracking system, such as a stakeholder register. That gives teams one place to flag misalignments before they turn into delays or strategy breakdowns.
Which metrics show real impact?
Real impact shows up in Triple Bottom Line metrics that turn broad goals into data teams can act on. That means looking at three areas at once:
Financial: cost savings and revenue from sustainable products
Social: employee turnover and community investment
Environmental: Scope 1, 2, and 3 emissions and resource efficiency
This matters because good intentions don’t tell you much on their own. Numbers do. If a company says it cares about sustainability, these metrics show whether that work is cutting costs, bringing in sales, supporting people, and reducing harm.
Using frameworks like GRI or SASB helps keep reporting rigorous, credible, and aligned with organizational and stakeholder priorities. In plain terms, they give teams a shared playbook, so reporting isn’t scattered or shaped by guesswork.
Who should own policy alignment internally?
Organizations should assign an internal owner to each stakeholder group. That simple step keeps messaging aligned and cuts down on silos, where different teams reach out to the same people with mixed signals.
This matters even more when you look inside the organization. Employees, executives, and board members often care about different things, ask different questions, and respond to different messages. Without clear ownership, it's easy for communication to drift or clash.
Tools like RACI charts help sort this out. They spell out who is responsible, accountable, consulted, and informed, so everyone knows their role before messages go out.
Related Blog Posts
Latest Articles
©2026
Narrative Change and Power Building: The Missing Half of Advocacy
Narrative change is the process of disrupting dominant narratives that normalize inequity and advancing new narratives from historically marginalized communities.
Funding Resilience Without Federal Grants
BRIC is unreliable and FEMA is shrinking. Here's how cities fund climate resilience with dedicated revenue, blended finance, and a coordinating authority.
The ESG Blind Spot: How AI Is Finding Risks in Companies Nobody Else Is Watching
Norway's sovereign wealth fund uses AI to screen 7,200 portfolio companies for forced labor and corruption within 24 hours. The real story is the emerging-market coverage gap that traditional ESG data vendors miss — and what it means for any company with a global supply chain.
FAQ
What does it really mean to “redefine profit”?
What makes Council Fire different?
Who does Council Fire work with?
What does working with Council Fire actually look like?
How does Council Fire help organizations turn big goals into action?
How does Council Fire define and measure success?
How does technology fit into Council Fire’s work?