
Jun 18, 2026
How to Design Green Port Infrastructure for the Future for Universities & Research Institutions
Sustainability Strategy
In This Article
Universities must turn port data into tested electrification, resilience, and monitoring programs to cut emissions and protect operations.
How to Design Green Port Infrastructure for the Future for Universities & Research Institutions
Ports can cut emissions fast, but only if design starts with data, power planning, flood risk, and clear pilot testing. I’d boil the article down to this: universities and research groups help ports map current emissions, rank the best upgrades, test port electrification, plan for sea-level rise and heat, and track results with shared dashboards.
Right away, here’s what matters most:
Set clear targets first for CO2, NOx, PM, energy use, outage tolerance, and water quality.
Build a baseline with load data, emissions inventories, flood maps, and nearby community exposure.
Prioritize the biggest cuts such as shore power, electric cargo equipment, batteries, microgrids, and building efficiency.
Plan for climate shocks with flood-proof power assets, better drainage, backup systems, shade, and heat controls.
Use shoreline solutions that do two jobs by reducing erosion while supporting habitat.
Track performance in one place with sensors, SCADA, EMS, GIS, and air and water monitors.
Move research into port action through living labs, pilot projects, and port-university governance.
A few facts make the case clear:
The Ports of Los Angeles and Long Beach produce 100 tons of smog per day.
Shore power can cut berth emissions by up to 98%.
Electric RTGs at Savannah removed 700,000 gallons of diesel use per year.
A 1-in-100-year heat event could occur every 1 to 5 years under 2°C warming.
By 2050, 55% to 59% of 3,630 global ports may face extreme sea levels more than 2 meters above today’s baseline.
If I were advising a university or research team, I’d keep the roadmap simple: measure first, rank projects by impact and grid load, harden weak assets, use low-waste material choices, and build a campus-to-port test cycle that turns findings into port decisions.
Focus area | What to do |
|---|---|
Emissions | Measure vessel, truck, equipment, and building sources |
Energy | Model shore power, electrification, renewables, storage, and peak demand |
Risk | Map flood, storm, outage, and heat exposure |
Port systems | Improve lighting, controls, substations, drainage, and backup power |
Shoreline | Pair built barriers with wetlands, reefs, or living shorelines where fit |
Monitoring | Use shared dashboards for energy, air, water, traffic, and asset status |
Delivery | Run pilots, compare costs over asset life, and tie research to port needs |
That’s the core message of the article: green port design works best when research teams turn port goals into numbers, test upgrades in the field, and help port leaders make decisions with fewer blind spots.
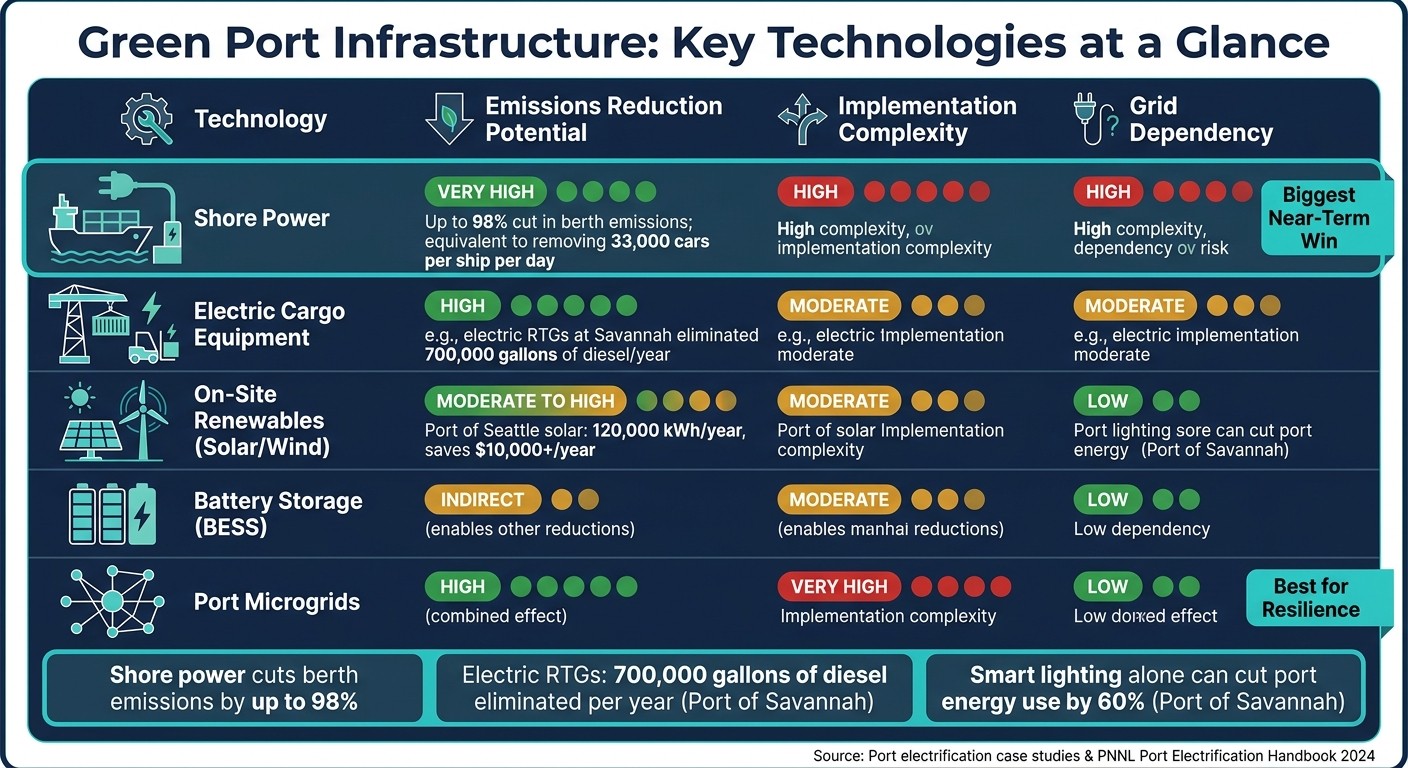
Green Port Infrastructure: Key Technologies, Emissions Impact & Complexity
Green Port Progress Report: Operations
1. Define Green Port Goals and Assess Port Risks
Before any design work starts, universities and port partners need to define what success looks like in measurable terms: carbon, resilience, pollution, and lifecycle impact. That shift matters. It turns broad sustainability aims into design rules teams can actually use, and it gives the project a clear risk baseline. Universities play a key role here by translating policy goals into testable criteria and baseline data.
Set Clear Design Criteria for Carbon, Resilience, and Pollution Reduction
Design criteria should cover emissions, energy, resilience, water quality, and materials. One useful way to frame this work is the Nearly Zero-Energy Port (nZEP) model, which aims to balance operational energy demand with on-site renewable generation, backed by storage and smart grid interaction [1].
Goals should span electricity, heating, cooling, hydrogen, and on-site generation. Resilience also needs a plain definition from the start: how much disruption the system can take before service breaks down [5].
Use a common set of metrics so design options can be compared on the same basis:
Metric Category | Measurable Indicator | Why It Matters |
|---|---|---|
Carbon/Energy | Levelized Cost of Energy (LCOE) | Compares long-term cost of renewable options [1] |
Resilience | Grid support capacity (real and reactive power) | Measures how long assets hold up under grid stress [5] |
Operations | Energy autonomy percentage | Tracks independence from the main grid [1] |
Pollution | NOx, PM, CO2e output by source | Sets baseline for air quality improvement targets [3] |
Run a Structured Baseline and Vulnerability Assessment
Once goals are in place, the next move is to document current conditions with energy load data, emissions inventories, climate exposure maps, and utility dependence reviews.
On the energy side, teams should collect high-resolution load profiles that show peak demand periods, not just annual averages. It helps to map where power comes from, how often the grid goes down, and which port operations would fail first during an outage. For emissions, document the fuel types used by vessels at berth, cargo-handling equipment, and on-site buildings.
Climate exposure is highly site-specific. Sea-level rise projections, storm surge heights, and heat index trends differ a lot across U.S. coastal regions. Those inputs help identify which assets and operations face the most flood, heat, and outage risk.
PNNL's May 2024 Port Electrification Handbook gives teams a practical model for this kind of structured assessment. Its Seattle Waterfront Networked Microgrid Evaluation case shows how to tie microgrid planning to actual load and resilience data [6].
It also makes sense to map nearby neighborhoods, schools, and environmental justice communities. That helps ports target the pollution sources doing the most harm and direct resilience spending where it can do the most good.
These targets and risk maps set up the infrastructure choices in the next step.
2. Design Low-Carbon and Energy-Efficient Port Systems
With a baseline and risk map in place, the next move is to decide which infrastructure projects will cut emissions the most while also improving day-to-day port operations. A good ranking method looks at four things: emissions impact, grid demand, deployment effort, and research value. Use the options below to sort projects by emissions cuts, grid effects, and rollout effort.
Plan Shore Power, Equipment Electrification, and Renewable-Powered Operations
Shore power is one of the strongest near-term options. It can cut berth emissions by up to 98% [3]. The Port of Los Angeles has installed 79 shore power hookups - the most in the world - through its Alternative Marine Power program to meet California's Ocean-Going Vessels At-Berth regulation [3].
Electric cargo-handling equipment also makes a direct difference. It cuts diesel use, lowers CO2, and trims maintenance costs. At Savannah, electric RTGs eliminated 700,000 gallons of diesel per year [3].
On-site renewables and battery storage help ports rely less on the grid and strengthen resilience. The Port of Seattle's solar installation produces 120,000 kilowatt-hours per year and saves the port more than $10,000 in energy-related costs each year [3]. For universities, the planning work should focus on load forecasting, utility coordination, and phased deployment modeling, especially since peak loads can climb to 4 to 8 times average demand [8]. Academic teams can run renewable system and battery sizing models before any physical build begins [1]. Universities should turn these port examples into load, storage, and phasing models for port partners.
Compare Infrastructure Options by Impact, Complexity, and Grid Needs
Not every port should pursue the same mix of technology. Site limits, utility constraints, operating patterns, and capital budgets all shape what makes sense. The table below compares the main low-carbon infrastructure options across the factors that matter most for prioritization and research design.
Technology | Emissions Reduction Potential | Implementation Complexity | Grid Dependency | Research Opportunities |
|---|---|---|---|---|
Shore Power | Very High [3] | High [4] | High [4] | Load forecasting |
Electric Cargo Equipment | High [3] | Moderate | Moderate | Battery sizing & charging protocols |
On-Site Renewables | Moderate to High | Moderate | Low [1] | Resource potential modeling [1] |
Battery Storage (BESS) | Indirect | Moderate | Low [8] | Power quality & fast-response algorithms [8] |
Port Microgrids | High | Very High [8] | Low [1] | Digital twins & smart grid controls [8] |
Shore power offers the biggest near-term emissions cut. Port microgrids, by contrast, can improve resilience but are usually the hardest to put in place [4] [8]. This is where universities can help in a concrete way. Optimization models can test trade-offs among Levelized Cost of Energy (LCOE), emissions reduction, and operational resilience before port authorities commit capital [1] [5].
Improve Efficiency in Buildings, Lighting, and Energy Management
Once core power systems are mapped out, buildings and controls often offer faster and lower-cost gains. Smart lighting controls and fixtures alone can cut port energy use by 60%, as shown at the Port of Savannah [3]. The Port of Miami pursued LEED silver certification for new structures and installed white reflective roofing as a passive cooling strategy to reduce HVAC loads [3].
For measurement and verification, use submetering and inverter controls [9]. Demand response can also be tested by adjusting ventilation and cooling controls in port buildings [5]. Research shows this method can deliver 30% to 40% cooling load flexibility [5]. That makes it a strong fit for university energy-audit and measurement-and-verification teams.
The business case should use total cost of ownership, including avoided diesel, lower maintenance, and energy savings [3].
3. Build Climate Resilience and Reduce Environmental Harm
After emissions come down, the next job is keeping ports up and running when floodwater rises, storms hit, or heat settles in for days. A low-carbon port still has a problem if one major storm shuts it down. This is where academic research teams can make a direct impact. By using site-specific hazard modeling, vulnerability mapping, and failure-point analysis, they can stress-test port designs before construction and spot weak points early.
Harden Critical Assets Against Flooding, Heat, and Storm Disruption
Coastal ports are under growing pressure from flood, storm, and heat risk. By 2050, 55% to 59% of 3,630 global ports could face extreme sea levels more than 2 meters above today's baseline, with storm damage and trade disruption costing billions each year [11]. For universities, that’s not an abstract data point. It’s a design brief.
Research teams can use high-resolution models to project site-level flood, wave, and heat threats so ports can plan infrastructure with a long time horizon [11]. In practice, that means protecting the assets that cannot fail when conditions get rough. Core steps include:
Elevating substations
Reinforcing drainage
Adding backup power for critical systems during outages
Building redundancy into communications and control systems
Heat risk needs the same level of attention. A 1-in-100-year extreme heat event could happen every 1 to 5 years if global warming reaches 2°C [11]. That shifts heat planning from a side issue to a routine design issue. Worker heat-safety protocols, shaded work areas, and passive cooling measures need to be part of the plan from day one. Academic teams can also apply the Ports Resilience Index to flag both physical and institutional weak points before a storm exposes them the hard way [10].
Once those core assets are protected, the next step is defending the shoreline in ways that lower risk without trading one problem for another.
Use Nature-Based and Hybrid Coastal Protection
Concrete barriers still have a role, but they work better when paired with ecological systems. Living shorelines, wetlands, oyster reefs, and mangroves can absorb wave energy, reduce erosion, and improve water quality [3].
Ports are already testing this approach in the field. Examples include 9 acres of wetlands at the Georgia Port Authority and ECOncrete shoreline armor at the Port of San Diego [3]. Research teams can follow these projects over time, track what performs well, and turn field data into design standards that ports can use again.
Poplar Island offers another strong example. It shows how dredged material can be used to restore habitat while also protecting shorelines [3]. Universities can help ports look for similar beneficial reuse options, then build monitoring frameworks that test shoreline performance, habitat results, and sediment reuse over time. That kind of evidence matters because shoreline work is not just about holding the line. It’s also about proving that the fix works year after year.
Resilience planning should also lighten the pollution load carried by nearby neighborhoods.
Cut Marine and Air Pollution Through Better Port Design
Air and water quality at ports are public health issues, not side notes. The Ports of Los Angeles and Long Beach together produce 100 tons of smog daily - more than the combined daily emissions of 6 million cars in the region [3]. Shore power can make a dramatic difference: powering one container ship from shore for a day cuts pollution equal to removing 33,000 cars from the road [3].
Truck traffic adds another layer to the problem. In port-adjacent communities, drayage activity is a major source of fine particulate matter, or PM2.5. The Port of New Orleans tackled this through its Clean Truck Replacement Incentive Program (Clean TRIP), which ran from 2016 through 2022 and replaced 58 diesel short-haul drayage trucks with cleaner-burning vehicles. The result was a 96% reduction in PM2.5 emissions from the participating fleet [3].
Design choices inside the port matter too. Better rail layouts and electronic security gates can cut truck idling, which in turn cuts nearby air pollution [2][3]. Small layout changes can have a big public health effect when hundreds or thousands of truck trips are involved.
Water pollution needs the same kind of practical thinking. The Port of Seattle uses oyster shells in catchment basins to remove copper and other heavy metals from runoff [3]. Research teams can track water-quality results over time and turn that monitoring into evidence that helps shape future port standards [3].
4. Create Circular Material Plans, Digital Monitoring, and Campus-to-Port Partnerships
After ports set low-carbon and resilience priorities, three things make the work move: durable materials, shared data, and a clear route from research to action.
Apply Circular Materials and Lifecycle Procurement
The first step is often the least flashy and one of the smartest: reuse what is already there. Existing harbor structures and conduits can cut embodied carbon before a port orders a single new material [8]. If new materials are needed, ports should specify options that can handle saltwater exposure and still be recycled at end of life [8].
This is one area where university teams can do more than advise from the sidelines. Testing how recycled-content materials hold up in saltwater gives ports the evidence they need to update procurement standards, especially in public-sector settings where new rules need a firm basis [1] [7].
Upfront price only tells part of the story. Lifecycle cost analysis matters just as much. Universities can model those trade-offs and present them in forms that fit public budgeting and compliance rules, so procurement officers and port boards can compare short-term cost with long-term performance, maintenance, and waste reduction. Those material decisions should then feed straight into the monitoring system that follows.
Build a Digital Monitoring Framework for Operations, Environment, and Resilience
Once material choices are set, the next job is to track how those assets perform in day-to-day use and during extreme events. Ports already produce data from meters, sensors, gauges, and equipment trackers. The challenge is not lack of data. It is pulling that data into one framework people can use to make decisions. Real-time digital models can help ports monitor operations, simulate performance, and guide long-range choices.
The table below shows the main monitoring categories, the tools behind them, and the decisions they support:
Monitoring Category | Digital Systems & Tools | Key Performance Indicators |
|---|---|---|
Operational | SCADA, IoT, Automated Terminal Operating Systems (TOS) | Throughput efficiency, waiting times, vehicle traffic volume, equipment uptime [12] [2] |
Environmental | Air quality sensors, water turbidity meters, noise monitors | CO2, NOx, SOx, and PM emissions; water pH and pollutant levels; noise decibels [12] [2] |
Energy | Smart Grids, Energy Management Systems (EMS), Digital Shadows | Levelized Cost of Energy (LCOE), energy autonomy, renewable energy share, grid interaction [1] |
Resilience | Weather/tide sensors, GIS, Cybersecurity monitoring | Climate adaptation readiness, sea-level rise vulnerability, data breach incidents [2] |
University teams can help ports move beyond spreadsheet reporting and into integrated dashboards that pull from all four categories. That shift gives port staff a much clearer picture of what is happening across the site. It also makes decisions faster. If a pilot project is under way, the same dashboard can show whether the design should be expanded, adjusted, or stopped.
Set Up Living Labs, Governance, and Decision Support Pathways
Once data streams line up, the harder part is turning findings into port action. In many cases, the problem is not technical. It is structural. If there is no clear path from a port question to a tested recommendation, strong research stays in journals while port operations stay the same.
Living labs help close that gap by turning design assumptions into operating evidence. The DEMASTER project (Design of Maritime Sustainable Terminals) offers a useful model. It used stakeholder focus groups in ports including Catania, Augusta, Koper, and Bar to refine strategic green objectives [2].
Governance matters just as much as pilot design. The North Sea Port model is a strong case to study. Between 2002 and 2023, the port coordinated an innovation ecosystem involving ArcelorMittal Gent for industrial symbiosis, BBEU for scaling bio-innovations, and CAPTURE as the academic bridge between research and industry, with universities serving as the neutral research bridge. The Port Authority acted as the central orchestrator, aligning all actors with EU Green Deal mandates [13].
In practice, port authorities tend to be most effective when they act as orchestrators rather than only operators. Universities, in turn, are often at their best when they serve as neutral intermediaries that help move knowledge across groups and line up shared resources [13].
"Successful CE [Circular Economy] implementation is increasingly linked to the ability of stakeholders (public, private, and academic) to coordinate across institutional and sectoral boundaries." - Journal of Environmental Management [13]
A practical campus-to-port workflow starts with a tightly scoped research question tied to a live port need. It then moves into a pilot phase and ends with a recommendation the port authority can use. Early wins matter here. Low-complexity projects such as rooftop PV and conduit reuse can build trust and produce early data. After that, ports can move into wave, tidal, and larger storage pilots [8] [13].
Conclusion: A Practical Roadmap for Future Green Port Infrastructure
Port change tends to work best in a clear order: start with a baseline, move into low-carbon design, build for resilience, and then add circular materials, digital monitoring, and partnerships.
That sequence only works when research makes the jump from papers and reports into day-to-day port choices. Universities matter most when they turn research into tools port authorities can actually use - emissions models, retrofit plans, pilot results, and decision support.
Documented port projects show that shore power and electrification can cut emissions, reduce maintenance, and lower operating costs.
Implementation hinges on financing as much as design. Money is still a constraint, but federal programs such as the EPA's Clean Ports Program and DERA can help fund zero-emission equipment and infrastructure. Universities can also help ports prepare the inventories and project documentation these applications require.
The takeaway is simple: institutions that turn evidence into action move ports forward.
FAQs
How can universities help ports prioritize green upgrades?
Universities and research institutions help ports decide where to start on green upgrades by providing evidence-based decision support. In plain terms, they turn big goals into workable plans. That includes designing blueprints for zero-emission infrastructure and cargo-handling equipment, estimating energy demand, and mapping out how renewable power and battery storage can fit into day-to-day port operations.
They also set emissions baselines and build electrification load forecasts, which gives port leaders a clearer picture of current performance and future power needs. Through living labs and stakeholder engagement, these groups test ideas in active settings, bring operators and community voices into the process, and help shape sustainable strategies that can hold up in practice. Just as important, they assess technology readiness and connect research to on-the-ground port implementation, so plans don’t stay stuck on paper.
What green port projects deliver the fastest results?
Projects that move fastest tend to center on proven, practical steps: electrifying cargo-handling equipment such as trucks, cranes, forklifts, and yard tractors, and adding shore power for ships at berth.
These moves can cut carbon emissions, air pollution, and noise in a fairly short window. They can also trim long-term operating costs. That’s why ports often put them near the top of the list. The technology is already in use, and it fits into broader decarbonization plans without forcing a full infrastructure rebuild.
How should ports balance electrification with flood and heat risks?
Ports need resilience plans that treat energy and infrastructure as one connected system, not two separate problems. That matters because power, cargo flow, communications, and site access all depend on each other. When one piece fails, the rest can start to wobble fast.
A medium-voltage microgrid can give ports more control over local power generation and storage, helping keep core operations running during extreme weather. In plain terms, it acts like a backup network on-site, so the port is less exposed when the main grid is under stress.
Pairing hybrid renewable energy systems with long-duration storage can also cut peak demand and reduce the impact of climate-driven grid disruptions. That mix gives operators more room to shift loads, store power when it’s available, and use it when conditions get rough.
Broader resilience assessments help planners map critical dependencies and test options for keeping service in place during floods or heat-related outages. Instead of looking at power, roads, buildings, and equipment one by one, this kind of review shows how they work together - and where the weak spots are.
Related Blog Posts
How to Build a Climate-Ready Energy & Water Infrastructure Plan for Maritime & Logistics Companies
How to Transition to Renewable Energy Systems at the Local Level for Maritime & Logistics Companies
How to Turn a Strategic Plan into Fundable, Shovel-Ready Projects for Maritime & Logistics Companies
How to Design Green Port Infrastructure for the Future for Corporations
Latest Articles
©2025

Narrative Change and Power Building: The Missing Half of Advocacy
Narrative change is the process of disrupting dominant narratives that normalize inequity and advancing new narratives from historically marginalized communities.

Funding Resilience Without Federal Grants
BRIC is unreliable and FEMA is shrinking. Here's how cities fund climate resilience with dedicated revenue, blended finance, and a coordinating authority.

The ESG Blind Spot: How AI Is Finding Risks in Companies Nobody Else Is Watching
Norway's sovereign wealth fund uses AI to screen 7,200 portfolio companies for forced labor and corruption within 24 hours. The real story is the emerging-market coverage gap that traditional ESG data vendors miss — and what it means for any company with a global supply chain.
Narrative Change and Power Building: The Missing Half of Advocacy
Narrative change is the process of disrupting dominant narratives that normalize inequity and advancing new narratives from historically marginalized communities.
Funding Resilience Without Federal Grants
BRIC is unreliable and FEMA is shrinking. Here's how cities fund climate resilience with dedicated revenue, blended finance, and a coordinating authority.
The ESG Blind Spot: How AI Is Finding Risks in Companies Nobody Else Is Watching
Norway's sovereign wealth fund uses AI to screen 7,200 portfolio companies for forced labor and corruption within 24 hours. The real story is the emerging-market coverage gap that traditional ESG data vendors miss — and what it means for any company with a global supply chain.
FAQ
01
What does it really mean to “redefine profit”?
02
What makes Council Fire different?
03
Who does Council Fire work with?
04
What does working with Council Fire actually look like?
05
How does Council Fire help organizations turn big goals into action?
06
How does Council Fire define and measure success?
Jun 18, 2026
How to Design Green Port Infrastructure for the Future for Universities & Research Institutions
Sustainability Strategy
In This Article
Universities must turn port data into tested electrification, resilience, and monitoring programs to cut emissions and protect operations.
How to Design Green Port Infrastructure for the Future for Universities & Research Institutions
Ports can cut emissions fast, but only if design starts with data, power planning, flood risk, and clear pilot testing. I’d boil the article down to this: universities and research groups help ports map current emissions, rank the best upgrades, test port electrification, plan for sea-level rise and heat, and track results with shared dashboards.
Right away, here’s what matters most:
Set clear targets first for CO2, NOx, PM, energy use, outage tolerance, and water quality.
Build a baseline with load data, emissions inventories, flood maps, and nearby community exposure.
Prioritize the biggest cuts such as shore power, electric cargo equipment, batteries, microgrids, and building efficiency.
Plan for climate shocks with flood-proof power assets, better drainage, backup systems, shade, and heat controls.
Use shoreline solutions that do two jobs by reducing erosion while supporting habitat.
Track performance in one place with sensors, SCADA, EMS, GIS, and air and water monitors.
Move research into port action through living labs, pilot projects, and port-university governance.
A few facts make the case clear:
The Ports of Los Angeles and Long Beach produce 100 tons of smog per day.
Shore power can cut berth emissions by up to 98%.
Electric RTGs at Savannah removed 700,000 gallons of diesel use per year.
A 1-in-100-year heat event could occur every 1 to 5 years under 2°C warming.
By 2050, 55% to 59% of 3,630 global ports may face extreme sea levels more than 2 meters above today’s baseline.
If I were advising a university or research team, I’d keep the roadmap simple: measure first, rank projects by impact and grid load, harden weak assets, use low-waste material choices, and build a campus-to-port test cycle that turns findings into port decisions.
Focus area | What to do |
|---|---|
Emissions | Measure vessel, truck, equipment, and building sources |
Energy | Model shore power, electrification, renewables, storage, and peak demand |
Risk | Map flood, storm, outage, and heat exposure |
Port systems | Improve lighting, controls, substations, drainage, and backup power |
Shoreline | Pair built barriers with wetlands, reefs, or living shorelines where fit |
Monitoring | Use shared dashboards for energy, air, water, traffic, and asset status |
Delivery | Run pilots, compare costs over asset life, and tie research to port needs |
That’s the core message of the article: green port design works best when research teams turn port goals into numbers, test upgrades in the field, and help port leaders make decisions with fewer blind spots.
Green Port Infrastructure: Key Technologies, Emissions Impact & Complexity
Green Port Progress Report: Operations
1. Define Green Port Goals and Assess Port Risks
Before any design work starts, universities and port partners need to define what success looks like in measurable terms: carbon, resilience, pollution, and lifecycle impact. That shift matters. It turns broad sustainability aims into design rules teams can actually use, and it gives the project a clear risk baseline. Universities play a key role here by translating policy goals into testable criteria and baseline data.
Set Clear Design Criteria for Carbon, Resilience, and Pollution Reduction
Design criteria should cover emissions, energy, resilience, water quality, and materials. One useful way to frame this work is the Nearly Zero-Energy Port (nZEP) model, which aims to balance operational energy demand with on-site renewable generation, backed by storage and smart grid interaction [1].
Goals should span electricity, heating, cooling, hydrogen, and on-site generation. Resilience also needs a plain definition from the start: how much disruption the system can take before service breaks down [5].
Use a common set of metrics so design options can be compared on the same basis:
Metric Category | Measurable Indicator | Why It Matters |
|---|---|---|
Carbon/Energy | Levelized Cost of Energy (LCOE) | Compares long-term cost of renewable options [1] |
Resilience | Grid support capacity (real and reactive power) | Measures how long assets hold up under grid stress [5] |
Operations | Energy autonomy percentage | Tracks independence from the main grid [1] |
Pollution | NOx, PM, CO2e output by source | Sets baseline for air quality improvement targets [3] |
Run a Structured Baseline and Vulnerability Assessment
Once goals are in place, the next move is to document current conditions with energy load data, emissions inventories, climate exposure maps, and utility dependence reviews.
On the energy side, teams should collect high-resolution load profiles that show peak demand periods, not just annual averages. It helps to map where power comes from, how often the grid goes down, and which port operations would fail first during an outage. For emissions, document the fuel types used by vessels at berth, cargo-handling equipment, and on-site buildings.
Climate exposure is highly site-specific. Sea-level rise projections, storm surge heights, and heat index trends differ a lot across U.S. coastal regions. Those inputs help identify which assets and operations face the most flood, heat, and outage risk.
PNNL's May 2024 Port Electrification Handbook gives teams a practical model for this kind of structured assessment. Its Seattle Waterfront Networked Microgrid Evaluation case shows how to tie microgrid planning to actual load and resilience data [6].
It also makes sense to map nearby neighborhoods, schools, and environmental justice communities. That helps ports target the pollution sources doing the most harm and direct resilience spending where it can do the most good.
These targets and risk maps set up the infrastructure choices in the next step.
2. Design Low-Carbon and Energy-Efficient Port Systems
With a baseline and risk map in place, the next move is to decide which infrastructure projects will cut emissions the most while also improving day-to-day port operations. A good ranking method looks at four things: emissions impact, grid demand, deployment effort, and research value. Use the options below to sort projects by emissions cuts, grid effects, and rollout effort.
Plan Shore Power, Equipment Electrification, and Renewable-Powered Operations
Shore power is one of the strongest near-term options. It can cut berth emissions by up to 98% [3]. The Port of Los Angeles has installed 79 shore power hookups - the most in the world - through its Alternative Marine Power program to meet California's Ocean-Going Vessels At-Berth regulation [3].
Electric cargo-handling equipment also makes a direct difference. It cuts diesel use, lowers CO2, and trims maintenance costs. At Savannah, electric RTGs eliminated 700,000 gallons of diesel per year [3].
On-site renewables and battery storage help ports rely less on the grid and strengthen resilience. The Port of Seattle's solar installation produces 120,000 kilowatt-hours per year and saves the port more than $10,000 in energy-related costs each year [3]. For universities, the planning work should focus on load forecasting, utility coordination, and phased deployment modeling, especially since peak loads can climb to 4 to 8 times average demand [8]. Academic teams can run renewable system and battery sizing models before any physical build begins [1]. Universities should turn these port examples into load, storage, and phasing models for port partners.
Compare Infrastructure Options by Impact, Complexity, and Grid Needs
Not every port should pursue the same mix of technology. Site limits, utility constraints, operating patterns, and capital budgets all shape what makes sense. The table below compares the main low-carbon infrastructure options across the factors that matter most for prioritization and research design.
Technology | Emissions Reduction Potential | Implementation Complexity | Grid Dependency | Research Opportunities |
|---|---|---|---|---|
Shore Power | Very High [3] | High [4] | High [4] | Load forecasting |
Electric Cargo Equipment | High [3] | Moderate | Moderate | Battery sizing & charging protocols |
On-Site Renewables | Moderate to High | Moderate | Low [1] | Resource potential modeling [1] |
Battery Storage (BESS) | Indirect | Moderate | Low [8] | Power quality & fast-response algorithms [8] |
Port Microgrids | High | Very High [8] | Low [1] | Digital twins & smart grid controls [8] |
Shore power offers the biggest near-term emissions cut. Port microgrids, by contrast, can improve resilience but are usually the hardest to put in place [4] [8]. This is where universities can help in a concrete way. Optimization models can test trade-offs among Levelized Cost of Energy (LCOE), emissions reduction, and operational resilience before port authorities commit capital [1] [5].
Improve Efficiency in Buildings, Lighting, and Energy Management
Once core power systems are mapped out, buildings and controls often offer faster and lower-cost gains. Smart lighting controls and fixtures alone can cut port energy use by 60%, as shown at the Port of Savannah [3]. The Port of Miami pursued LEED silver certification for new structures and installed white reflective roofing as a passive cooling strategy to reduce HVAC loads [3].
For measurement and verification, use submetering and inverter controls [9]. Demand response can also be tested by adjusting ventilation and cooling controls in port buildings [5]. Research shows this method can deliver 30% to 40% cooling load flexibility [5]. That makes it a strong fit for university energy-audit and measurement-and-verification teams.
The business case should use total cost of ownership, including avoided diesel, lower maintenance, and energy savings [3].
3. Build Climate Resilience and Reduce Environmental Harm
After emissions come down, the next job is keeping ports up and running when floodwater rises, storms hit, or heat settles in for days. A low-carbon port still has a problem if one major storm shuts it down. This is where academic research teams can make a direct impact. By using site-specific hazard modeling, vulnerability mapping, and failure-point analysis, they can stress-test port designs before construction and spot weak points early.
Harden Critical Assets Against Flooding, Heat, and Storm Disruption
Coastal ports are under growing pressure from flood, storm, and heat risk. By 2050, 55% to 59% of 3,630 global ports could face extreme sea levels more than 2 meters above today's baseline, with storm damage and trade disruption costing billions each year [11]. For universities, that’s not an abstract data point. It’s a design brief.
Research teams can use high-resolution models to project site-level flood, wave, and heat threats so ports can plan infrastructure with a long time horizon [11]. In practice, that means protecting the assets that cannot fail when conditions get rough. Core steps include:
Elevating substations
Reinforcing drainage
Adding backup power for critical systems during outages
Building redundancy into communications and control systems
Heat risk needs the same level of attention. A 1-in-100-year extreme heat event could happen every 1 to 5 years if global warming reaches 2°C [11]. That shifts heat planning from a side issue to a routine design issue. Worker heat-safety protocols, shaded work areas, and passive cooling measures need to be part of the plan from day one. Academic teams can also apply the Ports Resilience Index to flag both physical and institutional weak points before a storm exposes them the hard way [10].
Once those core assets are protected, the next step is defending the shoreline in ways that lower risk without trading one problem for another.
Use Nature-Based and Hybrid Coastal Protection
Concrete barriers still have a role, but they work better when paired with ecological systems. Living shorelines, wetlands, oyster reefs, and mangroves can absorb wave energy, reduce erosion, and improve water quality [3].
Ports are already testing this approach in the field. Examples include 9 acres of wetlands at the Georgia Port Authority and ECOncrete shoreline armor at the Port of San Diego [3]. Research teams can follow these projects over time, track what performs well, and turn field data into design standards that ports can use again.
Poplar Island offers another strong example. It shows how dredged material can be used to restore habitat while also protecting shorelines [3]. Universities can help ports look for similar beneficial reuse options, then build monitoring frameworks that test shoreline performance, habitat results, and sediment reuse over time. That kind of evidence matters because shoreline work is not just about holding the line. It’s also about proving that the fix works year after year.
Resilience planning should also lighten the pollution load carried by nearby neighborhoods.
Cut Marine and Air Pollution Through Better Port Design
Air and water quality at ports are public health issues, not side notes. The Ports of Los Angeles and Long Beach together produce 100 tons of smog daily - more than the combined daily emissions of 6 million cars in the region [3]. Shore power can make a dramatic difference: powering one container ship from shore for a day cuts pollution equal to removing 33,000 cars from the road [3].
Truck traffic adds another layer to the problem. In port-adjacent communities, drayage activity is a major source of fine particulate matter, or PM2.5. The Port of New Orleans tackled this through its Clean Truck Replacement Incentive Program (Clean TRIP), which ran from 2016 through 2022 and replaced 58 diesel short-haul drayage trucks with cleaner-burning vehicles. The result was a 96% reduction in PM2.5 emissions from the participating fleet [3].
Design choices inside the port matter too. Better rail layouts and electronic security gates can cut truck idling, which in turn cuts nearby air pollution [2][3]. Small layout changes can have a big public health effect when hundreds or thousands of truck trips are involved.
Water pollution needs the same kind of practical thinking. The Port of Seattle uses oyster shells in catchment basins to remove copper and other heavy metals from runoff [3]. Research teams can track water-quality results over time and turn that monitoring into evidence that helps shape future port standards [3].
4. Create Circular Material Plans, Digital Monitoring, and Campus-to-Port Partnerships
After ports set low-carbon and resilience priorities, three things make the work move: durable materials, shared data, and a clear route from research to action.
Apply Circular Materials and Lifecycle Procurement
The first step is often the least flashy and one of the smartest: reuse what is already there. Existing harbor structures and conduits can cut embodied carbon before a port orders a single new material [8]. If new materials are needed, ports should specify options that can handle saltwater exposure and still be recycled at end of life [8].
This is one area where university teams can do more than advise from the sidelines. Testing how recycled-content materials hold up in saltwater gives ports the evidence they need to update procurement standards, especially in public-sector settings where new rules need a firm basis [1] [7].
Upfront price only tells part of the story. Lifecycle cost analysis matters just as much. Universities can model those trade-offs and present them in forms that fit public budgeting and compliance rules, so procurement officers and port boards can compare short-term cost with long-term performance, maintenance, and waste reduction. Those material decisions should then feed straight into the monitoring system that follows.
Build a Digital Monitoring Framework for Operations, Environment, and Resilience
Once material choices are set, the next job is to track how those assets perform in day-to-day use and during extreme events. Ports already produce data from meters, sensors, gauges, and equipment trackers. The challenge is not lack of data. It is pulling that data into one framework people can use to make decisions. Real-time digital models can help ports monitor operations, simulate performance, and guide long-range choices.
The table below shows the main monitoring categories, the tools behind them, and the decisions they support:
Monitoring Category | Digital Systems & Tools | Key Performance Indicators |
|---|---|---|
Operational | SCADA, IoT, Automated Terminal Operating Systems (TOS) | Throughput efficiency, waiting times, vehicle traffic volume, equipment uptime [12] [2] |
Environmental | Air quality sensors, water turbidity meters, noise monitors | CO2, NOx, SOx, and PM emissions; water pH and pollutant levels; noise decibels [12] [2] |
Energy | Smart Grids, Energy Management Systems (EMS), Digital Shadows | Levelized Cost of Energy (LCOE), energy autonomy, renewable energy share, grid interaction [1] |
Resilience | Weather/tide sensors, GIS, Cybersecurity monitoring | Climate adaptation readiness, sea-level rise vulnerability, data breach incidents [2] |
University teams can help ports move beyond spreadsheet reporting and into integrated dashboards that pull from all four categories. That shift gives port staff a much clearer picture of what is happening across the site. It also makes decisions faster. If a pilot project is under way, the same dashboard can show whether the design should be expanded, adjusted, or stopped.
Set Up Living Labs, Governance, and Decision Support Pathways
Once data streams line up, the harder part is turning findings into port action. In many cases, the problem is not technical. It is structural. If there is no clear path from a port question to a tested recommendation, strong research stays in journals while port operations stay the same.
Living labs help close that gap by turning design assumptions into operating evidence. The DEMASTER project (Design of Maritime Sustainable Terminals) offers a useful model. It used stakeholder focus groups in ports including Catania, Augusta, Koper, and Bar to refine strategic green objectives [2].
Governance matters just as much as pilot design. The North Sea Port model is a strong case to study. Between 2002 and 2023, the port coordinated an innovation ecosystem involving ArcelorMittal Gent for industrial symbiosis, BBEU for scaling bio-innovations, and CAPTURE as the academic bridge between research and industry, with universities serving as the neutral research bridge. The Port Authority acted as the central orchestrator, aligning all actors with EU Green Deal mandates [13].
In practice, port authorities tend to be most effective when they act as orchestrators rather than only operators. Universities, in turn, are often at their best when they serve as neutral intermediaries that help move knowledge across groups and line up shared resources [13].
"Successful CE [Circular Economy] implementation is increasingly linked to the ability of stakeholders (public, private, and academic) to coordinate across institutional and sectoral boundaries." - Journal of Environmental Management [13]
A practical campus-to-port workflow starts with a tightly scoped research question tied to a live port need. It then moves into a pilot phase and ends with a recommendation the port authority can use. Early wins matter here. Low-complexity projects such as rooftop PV and conduit reuse can build trust and produce early data. After that, ports can move into wave, tidal, and larger storage pilots [8] [13].
Conclusion: A Practical Roadmap for Future Green Port Infrastructure
Port change tends to work best in a clear order: start with a baseline, move into low-carbon design, build for resilience, and then add circular materials, digital monitoring, and partnerships.
That sequence only works when research makes the jump from papers and reports into day-to-day port choices. Universities matter most when they turn research into tools port authorities can actually use - emissions models, retrofit plans, pilot results, and decision support.
Documented port projects show that shore power and electrification can cut emissions, reduce maintenance, and lower operating costs.
Implementation hinges on financing as much as design. Money is still a constraint, but federal programs such as the EPA's Clean Ports Program and DERA can help fund zero-emission equipment and infrastructure. Universities can also help ports prepare the inventories and project documentation these applications require.
The takeaway is simple: institutions that turn evidence into action move ports forward.
FAQs
How can universities help ports prioritize green upgrades?
Universities and research institutions help ports decide where to start on green upgrades by providing evidence-based decision support. In plain terms, they turn big goals into workable plans. That includes designing blueprints for zero-emission infrastructure and cargo-handling equipment, estimating energy demand, and mapping out how renewable power and battery storage can fit into day-to-day port operations.
They also set emissions baselines and build electrification load forecasts, which gives port leaders a clearer picture of current performance and future power needs. Through living labs and stakeholder engagement, these groups test ideas in active settings, bring operators and community voices into the process, and help shape sustainable strategies that can hold up in practice. Just as important, they assess technology readiness and connect research to on-the-ground port implementation, so plans don’t stay stuck on paper.
What green port projects deliver the fastest results?
Projects that move fastest tend to center on proven, practical steps: electrifying cargo-handling equipment such as trucks, cranes, forklifts, and yard tractors, and adding shore power for ships at berth.
These moves can cut carbon emissions, air pollution, and noise in a fairly short window. They can also trim long-term operating costs. That’s why ports often put them near the top of the list. The technology is already in use, and it fits into broader decarbonization plans without forcing a full infrastructure rebuild.
How should ports balance electrification with flood and heat risks?
Ports need resilience plans that treat energy and infrastructure as one connected system, not two separate problems. That matters because power, cargo flow, communications, and site access all depend on each other. When one piece fails, the rest can start to wobble fast.
A medium-voltage microgrid can give ports more control over local power generation and storage, helping keep core operations running during extreme weather. In plain terms, it acts like a backup network on-site, so the port is less exposed when the main grid is under stress.
Pairing hybrid renewable energy systems with long-duration storage can also cut peak demand and reduce the impact of climate-driven grid disruptions. That mix gives operators more room to shift loads, store power when it’s available, and use it when conditions get rough.
Broader resilience assessments help planners map critical dependencies and test options for keeping service in place during floods or heat-related outages. Instead of looking at power, roads, buildings, and equipment one by one, this kind of review shows how they work together - and where the weak spots are.
Related Blog Posts
How to Build a Climate-Ready Energy & Water Infrastructure Plan for Maritime & Logistics Companies
How to Transition to Renewable Energy Systems at the Local Level for Maritime & Logistics Companies
How to Turn a Strategic Plan into Fundable, Shovel-Ready Projects for Maritime & Logistics Companies
How to Design Green Port Infrastructure for the Future for Corporations
Latest Articles
©2025
Narrative Change and Power Building: The Missing Half of Advocacy
Narrative change is the process of disrupting dominant narratives that normalize inequity and advancing new narratives from historically marginalized communities.
Funding Resilience Without Federal Grants
BRIC is unreliable and FEMA is shrinking. Here's how cities fund climate resilience with dedicated revenue, blended finance, and a coordinating authority.
The ESG Blind Spot: How AI Is Finding Risks in Companies Nobody Else Is Watching
Norway's sovereign wealth fund uses AI to screen 7,200 portfolio companies for forced labor and corruption within 24 hours. The real story is the emerging-market coverage gap that traditional ESG data vendors miss — and what it means for any company with a global supply chain.
FAQ
01
What does it really mean to “redefine profit”?
02
What makes Council Fire different?
03
Who does Council Fire work with?
04
What does working with Council Fire actually look like?
05
How does Council Fire help organizations turn big goals into action?
06
How does Council Fire define and measure success?
Jun 18, 2026
How to Design Green Port Infrastructure for the Future for Universities & Research Institutions
Sustainability Strategy
In This Article
Universities must turn port data into tested electrification, resilience, and monitoring programs to cut emissions and protect operations.
How to Design Green Port Infrastructure for the Future for Universities & Research Institutions
Ports can cut emissions fast, but only if design starts with data, power planning, flood risk, and clear pilot testing. I’d boil the article down to this: universities and research groups help ports map current emissions, rank the best upgrades, test port electrification, plan for sea-level rise and heat, and track results with shared dashboards.
Right away, here’s what matters most:
Set clear targets first for CO2, NOx, PM, energy use, outage tolerance, and water quality.
Build a baseline with load data, emissions inventories, flood maps, and nearby community exposure.
Prioritize the biggest cuts such as shore power, electric cargo equipment, batteries, microgrids, and building efficiency.
Plan for climate shocks with flood-proof power assets, better drainage, backup systems, shade, and heat controls.
Use shoreline solutions that do two jobs by reducing erosion while supporting habitat.
Track performance in one place with sensors, SCADA, EMS, GIS, and air and water monitors.
Move research into port action through living labs, pilot projects, and port-university governance.
A few facts make the case clear:
The Ports of Los Angeles and Long Beach produce 100 tons of smog per day.
Shore power can cut berth emissions by up to 98%.
Electric RTGs at Savannah removed 700,000 gallons of diesel use per year.
A 1-in-100-year heat event could occur every 1 to 5 years under 2°C warming.
By 2050, 55% to 59% of 3,630 global ports may face extreme sea levels more than 2 meters above today’s baseline.
If I were advising a university or research team, I’d keep the roadmap simple: measure first, rank projects by impact and grid load, harden weak assets, use low-waste material choices, and build a campus-to-port test cycle that turns findings into port decisions.
Focus area | What to do |
|---|---|
Emissions | Measure vessel, truck, equipment, and building sources |
Energy | Model shore power, electrification, renewables, storage, and peak demand |
Risk | Map flood, storm, outage, and heat exposure |
Port systems | Improve lighting, controls, substations, drainage, and backup power |
Shoreline | Pair built barriers with wetlands, reefs, or living shorelines where fit |
Monitoring | Use shared dashboards for energy, air, water, traffic, and asset status |
Delivery | Run pilots, compare costs over asset life, and tie research to port needs |
That’s the core message of the article: green port design works best when research teams turn port goals into numbers, test upgrades in the field, and help port leaders make decisions with fewer blind spots.
Green Port Infrastructure: Key Technologies, Emissions Impact & Complexity
Green Port Progress Report: Operations
1. Define Green Port Goals and Assess Port Risks
Before any design work starts, universities and port partners need to define what success looks like in measurable terms: carbon, resilience, pollution, and lifecycle impact. That shift matters. It turns broad sustainability aims into design rules teams can actually use, and it gives the project a clear risk baseline. Universities play a key role here by translating policy goals into testable criteria and baseline data.
Set Clear Design Criteria for Carbon, Resilience, and Pollution Reduction
Design criteria should cover emissions, energy, resilience, water quality, and materials. One useful way to frame this work is the Nearly Zero-Energy Port (nZEP) model, which aims to balance operational energy demand with on-site renewable generation, backed by storage and smart grid interaction [1].
Goals should span electricity, heating, cooling, hydrogen, and on-site generation. Resilience also needs a plain definition from the start: how much disruption the system can take before service breaks down [5].
Use a common set of metrics so design options can be compared on the same basis:
Metric Category | Measurable Indicator | Why It Matters |
|---|---|---|
Carbon/Energy | Levelized Cost of Energy (LCOE) | Compares long-term cost of renewable options [1] |
Resilience | Grid support capacity (real and reactive power) | Measures how long assets hold up under grid stress [5] |
Operations | Energy autonomy percentage | Tracks independence from the main grid [1] |
Pollution | NOx, PM, CO2e output by source | Sets baseline for air quality improvement targets [3] |
Run a Structured Baseline and Vulnerability Assessment
Once goals are in place, the next move is to document current conditions with energy load data, emissions inventories, climate exposure maps, and utility dependence reviews.
On the energy side, teams should collect high-resolution load profiles that show peak demand periods, not just annual averages. It helps to map where power comes from, how often the grid goes down, and which port operations would fail first during an outage. For emissions, document the fuel types used by vessels at berth, cargo-handling equipment, and on-site buildings.
Climate exposure is highly site-specific. Sea-level rise projections, storm surge heights, and heat index trends differ a lot across U.S. coastal regions. Those inputs help identify which assets and operations face the most flood, heat, and outage risk.
PNNL's May 2024 Port Electrification Handbook gives teams a practical model for this kind of structured assessment. Its Seattle Waterfront Networked Microgrid Evaluation case shows how to tie microgrid planning to actual load and resilience data [6].
It also makes sense to map nearby neighborhoods, schools, and environmental justice communities. That helps ports target the pollution sources doing the most harm and direct resilience spending where it can do the most good.
These targets and risk maps set up the infrastructure choices in the next step.
2. Design Low-Carbon and Energy-Efficient Port Systems
With a baseline and risk map in place, the next move is to decide which infrastructure projects will cut emissions the most while also improving day-to-day port operations. A good ranking method looks at four things: emissions impact, grid demand, deployment effort, and research value. Use the options below to sort projects by emissions cuts, grid effects, and rollout effort.
Plan Shore Power, Equipment Electrification, and Renewable-Powered Operations
Shore power is one of the strongest near-term options. It can cut berth emissions by up to 98% [3]. The Port of Los Angeles has installed 79 shore power hookups - the most in the world - through its Alternative Marine Power program to meet California's Ocean-Going Vessels At-Berth regulation [3].
Electric cargo-handling equipment also makes a direct difference. It cuts diesel use, lowers CO2, and trims maintenance costs. At Savannah, electric RTGs eliminated 700,000 gallons of diesel per year [3].
On-site renewables and battery storage help ports rely less on the grid and strengthen resilience. The Port of Seattle's solar installation produces 120,000 kilowatt-hours per year and saves the port more than $10,000 in energy-related costs each year [3]. For universities, the planning work should focus on load forecasting, utility coordination, and phased deployment modeling, especially since peak loads can climb to 4 to 8 times average demand [8]. Academic teams can run renewable system and battery sizing models before any physical build begins [1]. Universities should turn these port examples into load, storage, and phasing models for port partners.
Compare Infrastructure Options by Impact, Complexity, and Grid Needs
Not every port should pursue the same mix of technology. Site limits, utility constraints, operating patterns, and capital budgets all shape what makes sense. The table below compares the main low-carbon infrastructure options across the factors that matter most for prioritization and research design.
Technology | Emissions Reduction Potential | Implementation Complexity | Grid Dependency | Research Opportunities |
|---|---|---|---|---|
Shore Power | Very High [3] | High [4] | High [4] | Load forecasting |
Electric Cargo Equipment | High [3] | Moderate | Moderate | Battery sizing & charging protocols |
On-Site Renewables | Moderate to High | Moderate | Low [1] | Resource potential modeling [1] |
Battery Storage (BESS) | Indirect | Moderate | Low [8] | Power quality & fast-response algorithms [8] |
Port Microgrids | High | Very High [8] | Low [1] | Digital twins & smart grid controls [8] |
Shore power offers the biggest near-term emissions cut. Port microgrids, by contrast, can improve resilience but are usually the hardest to put in place [4] [8]. This is where universities can help in a concrete way. Optimization models can test trade-offs among Levelized Cost of Energy (LCOE), emissions reduction, and operational resilience before port authorities commit capital [1] [5].
Improve Efficiency in Buildings, Lighting, and Energy Management
Once core power systems are mapped out, buildings and controls often offer faster and lower-cost gains. Smart lighting controls and fixtures alone can cut port energy use by 60%, as shown at the Port of Savannah [3]. The Port of Miami pursued LEED silver certification for new structures and installed white reflective roofing as a passive cooling strategy to reduce HVAC loads [3].
For measurement and verification, use submetering and inverter controls [9]. Demand response can also be tested by adjusting ventilation and cooling controls in port buildings [5]. Research shows this method can deliver 30% to 40% cooling load flexibility [5]. That makes it a strong fit for university energy-audit and measurement-and-verification teams.
The business case should use total cost of ownership, including avoided diesel, lower maintenance, and energy savings [3].
3. Build Climate Resilience and Reduce Environmental Harm
After emissions come down, the next job is keeping ports up and running when floodwater rises, storms hit, or heat settles in for days. A low-carbon port still has a problem if one major storm shuts it down. This is where academic research teams can make a direct impact. By using site-specific hazard modeling, vulnerability mapping, and failure-point analysis, they can stress-test port designs before construction and spot weak points early.
Harden Critical Assets Against Flooding, Heat, and Storm Disruption
Coastal ports are under growing pressure from flood, storm, and heat risk. By 2050, 55% to 59% of 3,630 global ports could face extreme sea levels more than 2 meters above today's baseline, with storm damage and trade disruption costing billions each year [11]. For universities, that’s not an abstract data point. It’s a design brief.
Research teams can use high-resolution models to project site-level flood, wave, and heat threats so ports can plan infrastructure with a long time horizon [11]. In practice, that means protecting the assets that cannot fail when conditions get rough. Core steps include:
Elevating substations
Reinforcing drainage
Adding backup power for critical systems during outages
Building redundancy into communications and control systems
Heat risk needs the same level of attention. A 1-in-100-year extreme heat event could happen every 1 to 5 years if global warming reaches 2°C [11]. That shifts heat planning from a side issue to a routine design issue. Worker heat-safety protocols, shaded work areas, and passive cooling measures need to be part of the plan from day one. Academic teams can also apply the Ports Resilience Index to flag both physical and institutional weak points before a storm exposes them the hard way [10].
Once those core assets are protected, the next step is defending the shoreline in ways that lower risk without trading one problem for another.
Use Nature-Based and Hybrid Coastal Protection
Concrete barriers still have a role, but they work better when paired with ecological systems. Living shorelines, wetlands, oyster reefs, and mangroves can absorb wave energy, reduce erosion, and improve water quality [3].
Ports are already testing this approach in the field. Examples include 9 acres of wetlands at the Georgia Port Authority and ECOncrete shoreline armor at the Port of San Diego [3]. Research teams can follow these projects over time, track what performs well, and turn field data into design standards that ports can use again.
Poplar Island offers another strong example. It shows how dredged material can be used to restore habitat while also protecting shorelines [3]. Universities can help ports look for similar beneficial reuse options, then build monitoring frameworks that test shoreline performance, habitat results, and sediment reuse over time. That kind of evidence matters because shoreline work is not just about holding the line. It’s also about proving that the fix works year after year.
Resilience planning should also lighten the pollution load carried by nearby neighborhoods.
Cut Marine and Air Pollution Through Better Port Design
Air and water quality at ports are public health issues, not side notes. The Ports of Los Angeles and Long Beach together produce 100 tons of smog daily - more than the combined daily emissions of 6 million cars in the region [3]. Shore power can make a dramatic difference: powering one container ship from shore for a day cuts pollution equal to removing 33,000 cars from the road [3].
Truck traffic adds another layer to the problem. In port-adjacent communities, drayage activity is a major source of fine particulate matter, or PM2.5. The Port of New Orleans tackled this through its Clean Truck Replacement Incentive Program (Clean TRIP), which ran from 2016 through 2022 and replaced 58 diesel short-haul drayage trucks with cleaner-burning vehicles. The result was a 96% reduction in PM2.5 emissions from the participating fleet [3].
Design choices inside the port matter too. Better rail layouts and electronic security gates can cut truck idling, which in turn cuts nearby air pollution [2][3]. Small layout changes can have a big public health effect when hundreds or thousands of truck trips are involved.
Water pollution needs the same kind of practical thinking. The Port of Seattle uses oyster shells in catchment basins to remove copper and other heavy metals from runoff [3]. Research teams can track water-quality results over time and turn that monitoring into evidence that helps shape future port standards [3].
4. Create Circular Material Plans, Digital Monitoring, and Campus-to-Port Partnerships
After ports set low-carbon and resilience priorities, three things make the work move: durable materials, shared data, and a clear route from research to action.
Apply Circular Materials and Lifecycle Procurement
The first step is often the least flashy and one of the smartest: reuse what is already there. Existing harbor structures and conduits can cut embodied carbon before a port orders a single new material [8]. If new materials are needed, ports should specify options that can handle saltwater exposure and still be recycled at end of life [8].
This is one area where university teams can do more than advise from the sidelines. Testing how recycled-content materials hold up in saltwater gives ports the evidence they need to update procurement standards, especially in public-sector settings where new rules need a firm basis [1] [7].
Upfront price only tells part of the story. Lifecycle cost analysis matters just as much. Universities can model those trade-offs and present them in forms that fit public budgeting and compliance rules, so procurement officers and port boards can compare short-term cost with long-term performance, maintenance, and waste reduction. Those material decisions should then feed straight into the monitoring system that follows.
Build a Digital Monitoring Framework for Operations, Environment, and Resilience
Once material choices are set, the next job is to track how those assets perform in day-to-day use and during extreme events. Ports already produce data from meters, sensors, gauges, and equipment trackers. The challenge is not lack of data. It is pulling that data into one framework people can use to make decisions. Real-time digital models can help ports monitor operations, simulate performance, and guide long-range choices.
The table below shows the main monitoring categories, the tools behind them, and the decisions they support:
Monitoring Category | Digital Systems & Tools | Key Performance Indicators |
|---|---|---|
Operational | SCADA, IoT, Automated Terminal Operating Systems (TOS) | Throughput efficiency, waiting times, vehicle traffic volume, equipment uptime [12] [2] |
Environmental | Air quality sensors, water turbidity meters, noise monitors | CO2, NOx, SOx, and PM emissions; water pH and pollutant levels; noise decibels [12] [2] |
Energy | Smart Grids, Energy Management Systems (EMS), Digital Shadows | Levelized Cost of Energy (LCOE), energy autonomy, renewable energy share, grid interaction [1] |
Resilience | Weather/tide sensors, GIS, Cybersecurity monitoring | Climate adaptation readiness, sea-level rise vulnerability, data breach incidents [2] |
University teams can help ports move beyond spreadsheet reporting and into integrated dashboards that pull from all four categories. That shift gives port staff a much clearer picture of what is happening across the site. It also makes decisions faster. If a pilot project is under way, the same dashboard can show whether the design should be expanded, adjusted, or stopped.
Set Up Living Labs, Governance, and Decision Support Pathways
Once data streams line up, the harder part is turning findings into port action. In many cases, the problem is not technical. It is structural. If there is no clear path from a port question to a tested recommendation, strong research stays in journals while port operations stay the same.
Living labs help close that gap by turning design assumptions into operating evidence. The DEMASTER project (Design of Maritime Sustainable Terminals) offers a useful model. It used stakeholder focus groups in ports including Catania, Augusta, Koper, and Bar to refine strategic green objectives [2].
Governance matters just as much as pilot design. The North Sea Port model is a strong case to study. Between 2002 and 2023, the port coordinated an innovation ecosystem involving ArcelorMittal Gent for industrial symbiosis, BBEU for scaling bio-innovations, and CAPTURE as the academic bridge between research and industry, with universities serving as the neutral research bridge. The Port Authority acted as the central orchestrator, aligning all actors with EU Green Deal mandates [13].
In practice, port authorities tend to be most effective when they act as orchestrators rather than only operators. Universities, in turn, are often at their best when they serve as neutral intermediaries that help move knowledge across groups and line up shared resources [13].
"Successful CE [Circular Economy] implementation is increasingly linked to the ability of stakeholders (public, private, and academic) to coordinate across institutional and sectoral boundaries." - Journal of Environmental Management [13]
A practical campus-to-port workflow starts with a tightly scoped research question tied to a live port need. It then moves into a pilot phase and ends with a recommendation the port authority can use. Early wins matter here. Low-complexity projects such as rooftop PV and conduit reuse can build trust and produce early data. After that, ports can move into wave, tidal, and larger storage pilots [8] [13].
Conclusion: A Practical Roadmap for Future Green Port Infrastructure
Port change tends to work best in a clear order: start with a baseline, move into low-carbon design, build for resilience, and then add circular materials, digital monitoring, and partnerships.
That sequence only works when research makes the jump from papers and reports into day-to-day port choices. Universities matter most when they turn research into tools port authorities can actually use - emissions models, retrofit plans, pilot results, and decision support.
Documented port projects show that shore power and electrification can cut emissions, reduce maintenance, and lower operating costs.
Implementation hinges on financing as much as design. Money is still a constraint, but federal programs such as the EPA's Clean Ports Program and DERA can help fund zero-emission equipment and infrastructure. Universities can also help ports prepare the inventories and project documentation these applications require.
The takeaway is simple: institutions that turn evidence into action move ports forward.
FAQs
How can universities help ports prioritize green upgrades?
Universities and research institutions help ports decide where to start on green upgrades by providing evidence-based decision support. In plain terms, they turn big goals into workable plans. That includes designing blueprints for zero-emission infrastructure and cargo-handling equipment, estimating energy demand, and mapping out how renewable power and battery storage can fit into day-to-day port operations.
They also set emissions baselines and build electrification load forecasts, which gives port leaders a clearer picture of current performance and future power needs. Through living labs and stakeholder engagement, these groups test ideas in active settings, bring operators and community voices into the process, and help shape sustainable strategies that can hold up in practice. Just as important, they assess technology readiness and connect research to on-the-ground port implementation, so plans don’t stay stuck on paper.
What green port projects deliver the fastest results?
Projects that move fastest tend to center on proven, practical steps: electrifying cargo-handling equipment such as trucks, cranes, forklifts, and yard tractors, and adding shore power for ships at berth.
These moves can cut carbon emissions, air pollution, and noise in a fairly short window. They can also trim long-term operating costs. That’s why ports often put them near the top of the list. The technology is already in use, and it fits into broader decarbonization plans without forcing a full infrastructure rebuild.
How should ports balance electrification with flood and heat risks?
Ports need resilience plans that treat energy and infrastructure as one connected system, not two separate problems. That matters because power, cargo flow, communications, and site access all depend on each other. When one piece fails, the rest can start to wobble fast.
A medium-voltage microgrid can give ports more control over local power generation and storage, helping keep core operations running during extreme weather. In plain terms, it acts like a backup network on-site, so the port is less exposed when the main grid is under stress.
Pairing hybrid renewable energy systems with long-duration storage can also cut peak demand and reduce the impact of climate-driven grid disruptions. That mix gives operators more room to shift loads, store power when it’s available, and use it when conditions get rough.
Broader resilience assessments help planners map critical dependencies and test options for keeping service in place during floods or heat-related outages. Instead of looking at power, roads, buildings, and equipment one by one, this kind of review shows how they work together - and where the weak spots are.
Related Blog Posts
How to Build a Climate-Ready Energy & Water Infrastructure Plan for Maritime & Logistics Companies
How to Transition to Renewable Energy Systems at the Local Level for Maritime & Logistics Companies
How to Turn a Strategic Plan into Fundable, Shovel-Ready Projects for Maritime & Logistics Companies
How to Design Green Port Infrastructure for the Future for Corporations
Latest Articles
©2025
Narrative Change and Power Building: The Missing Half of Advocacy
Narrative change is the process of disrupting dominant narratives that normalize inequity and advancing new narratives from historically marginalized communities.
Funding Resilience Without Federal Grants
BRIC is unreliable and FEMA is shrinking. Here's how cities fund climate resilience with dedicated revenue, blended finance, and a coordinating authority.
The ESG Blind Spot: How AI Is Finding Risks in Companies Nobody Else Is Watching
Norway's sovereign wealth fund uses AI to screen 7,200 portfolio companies for forced labor and corruption within 24 hours. The real story is the emerging-market coverage gap that traditional ESG data vendors miss — and what it means for any company with a global supply chain.
FAQ
What does it really mean to “redefine profit”?
What makes Council Fire different?
Who does Council Fire work with?
What does working with Council Fire actually look like?
How does Council Fire help organizations turn big goals into action?
How does Council Fire define and measure success?