
Jun 18, 2026
How to Design Green Port Infrastructure for the Future for NGOs & Nonprofits
Sustainability Strategy
In This Article
NGO guide: map port emissions, prioritize shore power & electrification, align partners/funding, and track health and climate metrics.
How to Design Green Port Infrastructure for the Future for NGOs & Nonprofits
Ports can cut ship pollution by up to 98% at berth, and NGOs can help make that happen. If I were guiding a nonprofit team, I’d keep the plan simple: measure the harm, pick the projects with the biggest local health gains, line up partners and funding, and track results in public.
Here’s the short version:
Start with a baseline. Map emissions from ships, trucks, rail, and cargo equipment, then match that with asthma, income, and neighborhood data.
Pick a short list of projects. Focus on shore power, electric cargo equipment, zero-emission trucks, clean energy systems, and shoreline projects that lower flood risk.
Score each option. Compare pollution cuts, climate risk reduction, community health impact, cost, and permit risk.
Build the right group early. Bring in residents, labor, terminal operators, utilities, and public agencies before project design is locked.
Match each project to money. Use grants for public-health-focused work like air monitoring and shore power; use mixed capital for power, charging, and grid work.
Track proof, not promises. Measure diesel saved, PM and NOx cuts, asthma trends, habitat acres restored, and local hiring.
A few numbers show why this matters. The Ports of Los Angeles and Long Beach produce 100 tons of smog per day, and Baltimore showed that cargo can grow while emissions fall - cargo rose 10% while emissions dropped 19% after equipment and truck changes.
If I had to reduce the full guide to one line, it would be this: the best green port plan is the one that cuts the dirtiest pollution first, protects nearby neighborhoods, and shows the numbers in plain view.
Green Port Progress Report: Operations
Map port impacts and choose the right priorities
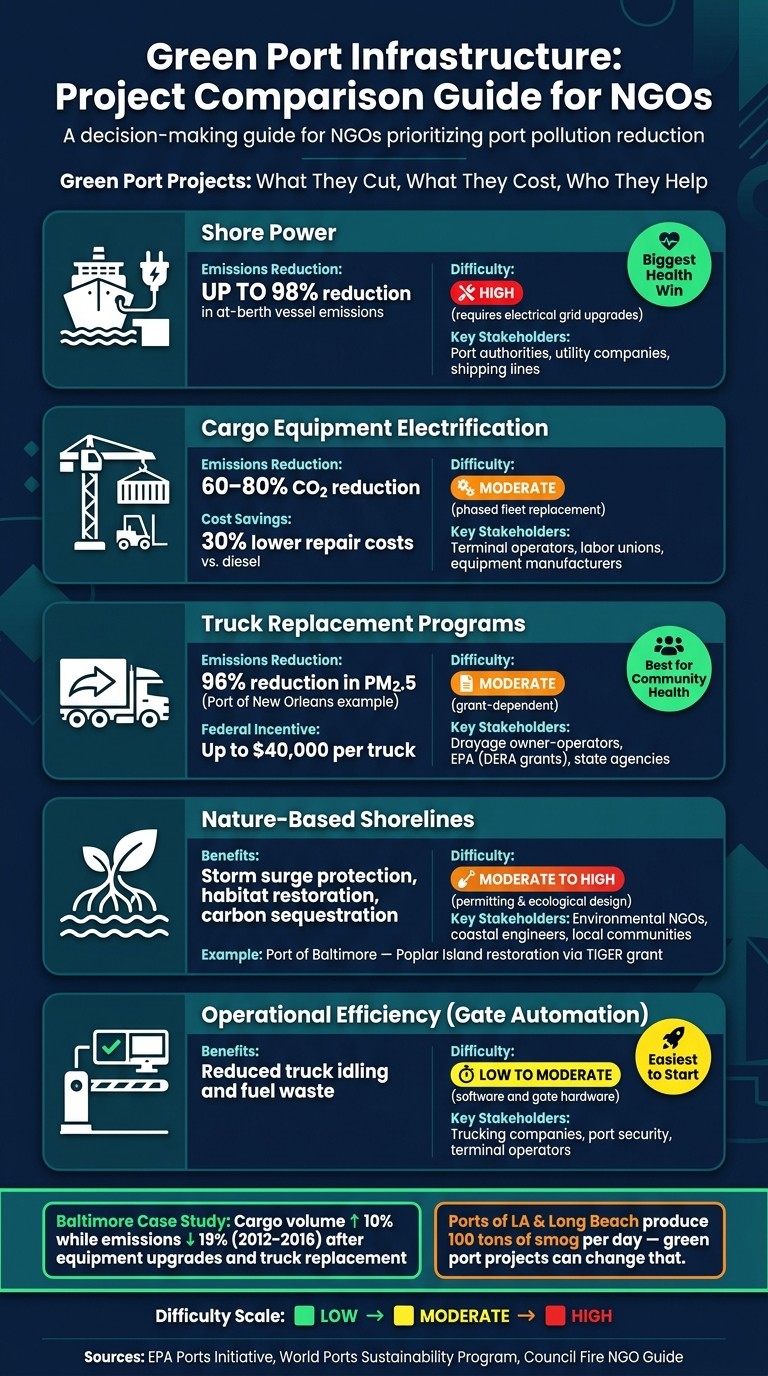
Green Port Projects: Emissions Cuts, Difficulty & Key Benefits at a Glance
Start with a baseline for port emissions, community exposure, and climate risk. Without that starting point, NGOs are left guessing. It becomes much harder to target the biggest harms or make a solid case for funding. A good baseline turns community harm into a ranked project list, so groups can focus on projects that deliver the fastest and broadest gains.
Build an emissions and community impact baseline
A solid baseline begins with an inventory of emissions from ships, trucks, rail, and equipment across six sectors: ocean-going vessels, harbor craft, recreational marine, cargo handling equipment, on-road vehicles (drayage trucks), and rail. [4][5] For each sector, you need activity data such as vessel calls, fuel types, truck trip counts, engine model years, and equipment counts. That data is then used to estimate air pollutants like PM, NOx, air toxics, and greenhouse gases over a set period. [4][5]
If a full port-wide inventory is out of reach, start smaller. A port-owned equipment fleet or a single terminal can still give you a workable picture. [4] At the same time, map near-port exposure using health, income, and demographic data so you can see which neighborhoods carry the heaviest burden.
Use assessment frameworks to compare needs across projects
Once the baseline is in place, use established tools to compare projects on equal terms. The U.S. EPA Ports Initiative guidance includes emissions inventory methods and community engagement tools, including the Community-Port Collaboration Toolkit and the EPA Ports Primer. [4][6] The World Ports Sustainability Program gives ports a benchmarking structure for energy, climate, and community performance. [1]
For resilience, the U.S. Climate Resilience Toolkit's Ports Resilience Index helps assess a port's exposure to storm surges, sea-level rise, flooding, and extreme heat. [4] These frameworks help NGOs tie emissions cuts to public health, resilience, and equity. Used together, they make it easier to spot where emissions cuts, resilience gains, and community benefits line up best.
Rank projects by emissions, resilience, equity, and feasibility
With baseline data and a framework-based project list in hand, score each project against a short set of criteria. Look at tons of CO2e avoided per year, cuts in NOx, SOx, and PM, measurable health benefits for nearby communities, flood protection value, permitting complexity, and estimated capital cost in U.S. dollars. [4][1]
This is more than a technical exercise. These criteria shape public pressure, funding requests, and accountability. In plain terms, they help NGOs compare options the same way port planners and funders do.
Project Type | Primary Benefits | Difficulty | Key Stakeholders |
|---|---|---|---|
Shore Power | Up to 98% reduction in at-berth vessel emissions; significant health gains for near-port residents [1] | High - requires significant electrical grid upgrades | Port authorities, utility companies, shipping lines |
Cargo Equipment Electrification | 60% to 80% CO2 reduction; 30% lower repair costs vs. diesel [1] | Moderate - phased fleet replacement | Terminal operators, labor unions, equipment manufacturers |
Truck Replacement Programs | 96% reduction in PM2.5 at the Port of New Orleans [1] | Moderate - depends on grant funding and incentives | Drayage owner-operators, EPA (DERA grants), state agencies |
Nature-Based Shorelines | Storm surge protection; habitat restoration; carbon sequestration | Moderate to High - permitting and ecological design | Environmental NGOs, coastal engineers, local communities |
Operational Efficiency (Gate Automation) | Reduced truck idling and fuel waste | Low to Moderate - software and gate hardware | Trucking companies, port security, terminal operators |
Baltimore shows what this can look like in practice: from 2012 to 2016, cargo volume rose 10% while emissions fell 19% after equipment upgrades and truck replacement. [1] Results like that help shape the project design choices that come next.
Design the core elements of a green port project
After ranking projects, move from priorities to design. Each option has to fit the port’s grid, fleet, shoreline, and nearby community. For NGOs, the bar is simple: does the project cut the dirtiest pollution, and does it help the neighborhoods that carry the heaviest load?
Cut operational emissions with shore power and electrified equipment
Shore power lets docked ships plug into grid electricity and shut off diesel engines. That sounds simple on paper, but in practice it means dockside power upgrades and vessel-compatible hookups. It makes the most sense at ports with large numbers of berthed ocean-going vessels, where the emissions payoff is highest.
For cargo handling and drayage, electrification should start where diesel pollution hits hardest. That usually means cranes, yard tractors, forklifts, and trucks operating near overburdened communities. Federal incentives of up to $40,000 per truck can help narrow the cost gap. [3]
Add renewable energy, storage, and resilient power systems
On-site solar on warehouse rooftops and parking structures is a practical place to start. Pairing solar with storage can support charging demand and keep critical functions running during outages. Microgrids that can serve nearby neighborhoods during emergencies give residents a direct, concrete return from port energy spending.
Protect shorelines and water quality with nature-based and green site design
Ports face serious physical risks from sea-level rise, storm surge, and flooding. The choices made now will shape how well these sites hold up over time. Nature-based solutions can outperform hard seawalls while also improving water quality and supporting biodiversity. [1]
The Port of Baltimore offers a good example. It used a TIGER grant to install a stormwater management system, elevate critical assets against sea-level rise, and use dredged material to restore Poplar Island in the Chesapeake Bay. [1] Bioswales and rain gardens can work alongside those bigger shoreline efforts at a lower cost, helping filter runoff and reduce flooding in nearby neighborhoods where space or budget is tight.
Use these options to match each project to the port constraint it solves - emissions, resilience, runoff, or community health.
Once the core design is set, the next move is getting partners, permits, and capital lined up around the same project scope.
Build partnerships, funding, and governance that can deliver
After project design, the tougher issue shows up fast: who makes decisions, who pays, and who signs off? Once the scope is set, governance shapes approvals, funding, and the pace of delivery.
Engage port authorities, communities, labor, and public agencies early
The port projects that last are usually built by a coalition, not carried by one internal champion. The Port of Oakland’s $322 million EPA Clean Ports Program award in December 2024 is a good example. It was backed by a coalition of 20 community-based organizations, along with terminal operators and workforce development partners. [7]
For NGOs, that points to a simple move: map stakeholders before project design begins. Identify frontline residents, local labor groups, terminal operators, and public agencies at the start. Then give them a seat at the table through working groups or advisory panels, so residents, labor, operators, and agencies help shape the plan early. It also helps to bring those same groups into funding talks. That way, the project scope lines up with what lenders and grantmakers are prepared to support.
Alignment with the Justice40 Initiative can also strengthen federal funding applications. The program requires that 40% of the benefits of certain federal investments flow to disadvantaged communities. [2]
Match projects to grants, green bonds, and blended capital
Once stakeholders are lined up, the next step is matching each project to the right source of capital. Not every port project fits the same funding model, and forcing the wrong fit can slow things down.
Shore power and community air monitoring make a strong case for public support. They offer clear public health and environmental gains, but they often have limited direct commercial return. That makes them a strong fit for federal grants and philanthropic capital. Large-scale electrification or renewable energy installations usually need a mixed funding stack instead. In those cases, a public grant or foundation investment can reduce enough risk to draw in private green lenders.
Funding Source | Best Fit For | Key Characteristics |
|---|---|---|
EPA Clean Ports Program | Zero-emission equipment, shore power, planning | $3 billion available; prioritizes near-port community health [7][2] |
DERA (Diesel Emissions Reduction Act) Grants | Diesel engine and truck replacement | Federal grants for replacing older, high-polluting diesel engines [1] |
RAISE / TIGER Grants | Infrastructure resilience, stormwater, multimodal | Supports large-scale adaptation and climate projects [1] |
Green Bonds | Renewable energy, grid upgrades, large electrification | Attracts impact-focused private capital; requires green use-of-proceeds reporting [8] |
Blended Capital | High-risk or innovative technology | Combines public/philanthropic grants with private investment to manage risk [8][9] |
Build the financial story early. Spell out who pays for what, and document that structure clearly. It makes the project easier for green lenders to evaluate and helps keep the scope aligned with grant rules. [8]
How Council Fire can help turn strategy into action
Council Fire helps NGOs turn port strategy into a credible investment case, clear metrics, and a fundable plan. From there, the work is to track whether the project delivers the emissions, resilience, and equity gains it promised.
Measure results and plan your next steps
Track performance with clear metrics
A baseline shows whether a project delivered what it promised. Before swapping out equipment or restoring a shoreline, record the starting point: diesel use, asthma rates, habitat conditions, and local jobs. Use the same priorities that shaped project selection in the first place: emissions, resilience, equity, and feasibility.
Use these indicators to compare projects against one shared baseline:
Project Type | Baseline Method | Core Indicators | Likely Data Sources |
|---|---|---|---|
Operational Electrification | Pre-project diesel fuel consumption logs | Annual CO2e reductions; gallons of diesel saved; NOx and PM reductions | Fuel purchase records; equipment telematics; utility bills |
Shore Power | Average auxiliary engine run-time per vessel call | % reduction in at-berth emissions; kWh of renewable energy used | Vessel berthing logs; shore power connection meters; air quality monitors |
Nature-Based Shorelines | Historical erosion rates; habitat surveys | Acres of habitat restored; shoreline feet stabilized; avoided flood damage ($) | Satellite imagery; GIS mapping; municipal insurance claims |
Stormwater and Water Quality | Pre-project heavy metal concentrations in water (e.g., copper) | % reduction in copper and other pollutants; dissolved oxygen levels | Water quality sensors; EPA monitoring stations |
Community Health & Equity | Local asthma and ER visit rates in port-adjacent zip codes | Asthma ER visits; PM2.5 exposure; respiratory symptom days | Public health records; air quality sensor networks |
Workforce and Local Hiring | Local employment census in the maritime sector | New local hires; workforce training completion rates | Payroll data; grant reporting documents |
Good baseline data turns outcomes into something you can measure, not just claim. If federal funding is part of the mix, line up your indicators with Justice40 requirements. Showing that 40% of project benefits reach disadvantaged communities is more than a compliance task - it can strengthen future grant applications and build trust with residents living near the port. [2]
Steps NGOs can take next
Once metrics are in place, use them to steer implementation and public reporting. The move from assessment to impact is pretty direct. Start with an emissions and community health inventory. That gives you the ground truth. Then choose two or three priority projects based on the criteria already set: emissions reduction potential, resilience value, equity benefit, and feasibility.
Bring stakeholders in early, not halfway through the process. That means near-port residents, labor groups, terminal operators, and public agencies. After that, match each project with the right funding source, such as the EPA Clean Ports Program or DERA grants. Before work begins, lock in the metrics you’ll track and how results will be shared.
Public reporting matters here. It keeps expectations clear, gives funders something concrete to review, and shows communities whether promised gains are showing up on the ground. The strongest nonprofit role is often to connect climate goals, public health, ecosystem protection, and community economic benefit in one port transition plan - then track results, report them openly, and hold every party to account for delivery.
FAQs
How can a small nonprofit start a port emissions baseline?
A small nonprofit can get started with the U.S. Environmental Protection Agency’s Port Emissions Inventory Guidance. It gives a standard way to estimate emissions from vessels, harbor craft, cargo-handling equipment, on-road vehicles, and rail.
Start by setting the inventory’s geographic scope. That means drawing clear marine and landside boundaries and stating what the inventory is for, whether that’s voluntary research or support for a regulatory process. From there, EPA tabular data and default activity assumptions can help build a solid baseline.
Which green port projects deliver the fastest community health benefits?
Projects centered on electrification and swapping out older, high-emission equipment tend to bring the fastest health gains for nearby communities.
When ports replace diesel-powered drayage trucks, harbor craft, and cargo-handling equipment with zero-emission electric options - and add shore power for ships at berth - the payoff can come fast. Local air pollution drops. Noise levels fall. And for residents living close by, that can mean lower exposure to the health risks tied to port activity.
How can NGOs fund green port projects without owning port assets?
NGOs and nonprofits can play a direct role in funding green port projects even if they don’t own port assets. The usual path is to partner with eligible public entities such as port authorities, local or Tribal governments, and regional air quality agencies.
That kind of partnership can strengthen joint applications for federal programs like the EPA’s $3 billion Clean Ports Program. It can also help pay for work that often sets the stage for larger port upgrades, including air quality monitoring, emissions baselining, and climate resiliency planning.
Related Blog Posts
How to Turn a Strategic Plan into Fundable, Shovel-Ready Projects for Maritime & Logistics Companies
How to Decarbonize Maritime Operations and Supply Chains for Municipalities & Government Agencies
How to Design Green Port Infrastructure for the Future for Municipalities & Government Agencies
How to Design Green Port Infrastructure for the Future for Corporations
Latest Articles
©2025

Narrative Change and Power Building: The Missing Half of Advocacy
Narrative change is the process of disrupting dominant narratives that normalize inequity and advancing new narratives from historically marginalized communities.

Funding Resilience Without Federal Grants
BRIC is unreliable and FEMA is shrinking. Here's how cities fund climate resilience with dedicated revenue, blended finance, and a coordinating authority.

The ESG Blind Spot: How AI Is Finding Risks in Companies Nobody Else Is Watching
Norway's sovereign wealth fund uses AI to screen 7,200 portfolio companies for forced labor and corruption within 24 hours. The real story is the emerging-market coverage gap that traditional ESG data vendors miss — and what it means for any company with a global supply chain.
Narrative Change and Power Building: The Missing Half of Advocacy
Narrative change is the process of disrupting dominant narratives that normalize inequity and advancing new narratives from historically marginalized communities.
Funding Resilience Without Federal Grants
BRIC is unreliable and FEMA is shrinking. Here's how cities fund climate resilience with dedicated revenue, blended finance, and a coordinating authority.
The ESG Blind Spot: How AI Is Finding Risks in Companies Nobody Else Is Watching
Norway's sovereign wealth fund uses AI to screen 7,200 portfolio companies for forced labor and corruption within 24 hours. The real story is the emerging-market coverage gap that traditional ESG data vendors miss — and what it means for any company with a global supply chain.
FAQ
01
What does it really mean to “redefine profit”?
02
What makes Council Fire different?
03
Who does Council Fire work with?
04
What does working with Council Fire actually look like?
05
How does Council Fire help organizations turn big goals into action?
06
How does Council Fire define and measure success?
Jun 18, 2026
How to Design Green Port Infrastructure for the Future for NGOs & Nonprofits
Sustainability Strategy
In This Article
NGO guide: map port emissions, prioritize shore power & electrification, align partners/funding, and track health and climate metrics.
How to Design Green Port Infrastructure for the Future for NGOs & Nonprofits
Ports can cut ship pollution by up to 98% at berth, and NGOs can help make that happen. If I were guiding a nonprofit team, I’d keep the plan simple: measure the harm, pick the projects with the biggest local health gains, line up partners and funding, and track results in public.
Here’s the short version:
Start with a baseline. Map emissions from ships, trucks, rail, and cargo equipment, then match that with asthma, income, and neighborhood data.
Pick a short list of projects. Focus on shore power, electric cargo equipment, zero-emission trucks, clean energy systems, and shoreline projects that lower flood risk.
Score each option. Compare pollution cuts, climate risk reduction, community health impact, cost, and permit risk.
Build the right group early. Bring in residents, labor, terminal operators, utilities, and public agencies before project design is locked.
Match each project to money. Use grants for public-health-focused work like air monitoring and shore power; use mixed capital for power, charging, and grid work.
Track proof, not promises. Measure diesel saved, PM and NOx cuts, asthma trends, habitat acres restored, and local hiring.
A few numbers show why this matters. The Ports of Los Angeles and Long Beach produce 100 tons of smog per day, and Baltimore showed that cargo can grow while emissions fall - cargo rose 10% while emissions dropped 19% after equipment and truck changes.
If I had to reduce the full guide to one line, it would be this: the best green port plan is the one that cuts the dirtiest pollution first, protects nearby neighborhoods, and shows the numbers in plain view.
Green Port Progress Report: Operations
Map port impacts and choose the right priorities
Green Port Projects: Emissions Cuts, Difficulty & Key Benefits at a Glance
Start with a baseline for port emissions, community exposure, and climate risk. Without that starting point, NGOs are left guessing. It becomes much harder to target the biggest harms or make a solid case for funding. A good baseline turns community harm into a ranked project list, so groups can focus on projects that deliver the fastest and broadest gains.
Build an emissions and community impact baseline
A solid baseline begins with an inventory of emissions from ships, trucks, rail, and equipment across six sectors: ocean-going vessels, harbor craft, recreational marine, cargo handling equipment, on-road vehicles (drayage trucks), and rail. [4][5] For each sector, you need activity data such as vessel calls, fuel types, truck trip counts, engine model years, and equipment counts. That data is then used to estimate air pollutants like PM, NOx, air toxics, and greenhouse gases over a set period. [4][5]
If a full port-wide inventory is out of reach, start smaller. A port-owned equipment fleet or a single terminal can still give you a workable picture. [4] At the same time, map near-port exposure using health, income, and demographic data so you can see which neighborhoods carry the heaviest burden.
Use assessment frameworks to compare needs across projects
Once the baseline is in place, use established tools to compare projects on equal terms. The U.S. EPA Ports Initiative guidance includes emissions inventory methods and community engagement tools, including the Community-Port Collaboration Toolkit and the EPA Ports Primer. [4][6] The World Ports Sustainability Program gives ports a benchmarking structure for energy, climate, and community performance. [1]
For resilience, the U.S. Climate Resilience Toolkit's Ports Resilience Index helps assess a port's exposure to storm surges, sea-level rise, flooding, and extreme heat. [4] These frameworks help NGOs tie emissions cuts to public health, resilience, and equity. Used together, they make it easier to spot where emissions cuts, resilience gains, and community benefits line up best.
Rank projects by emissions, resilience, equity, and feasibility
With baseline data and a framework-based project list in hand, score each project against a short set of criteria. Look at tons of CO2e avoided per year, cuts in NOx, SOx, and PM, measurable health benefits for nearby communities, flood protection value, permitting complexity, and estimated capital cost in U.S. dollars. [4][1]
This is more than a technical exercise. These criteria shape public pressure, funding requests, and accountability. In plain terms, they help NGOs compare options the same way port planners and funders do.
Project Type | Primary Benefits | Difficulty | Key Stakeholders |
|---|---|---|---|
Shore Power | Up to 98% reduction in at-berth vessel emissions; significant health gains for near-port residents [1] | High - requires significant electrical grid upgrades | Port authorities, utility companies, shipping lines |
Cargo Equipment Electrification | 60% to 80% CO2 reduction; 30% lower repair costs vs. diesel [1] | Moderate - phased fleet replacement | Terminal operators, labor unions, equipment manufacturers |
Truck Replacement Programs | 96% reduction in PM2.5 at the Port of New Orleans [1] | Moderate - depends on grant funding and incentives | Drayage owner-operators, EPA (DERA grants), state agencies |
Nature-Based Shorelines | Storm surge protection; habitat restoration; carbon sequestration | Moderate to High - permitting and ecological design | Environmental NGOs, coastal engineers, local communities |
Operational Efficiency (Gate Automation) | Reduced truck idling and fuel waste | Low to Moderate - software and gate hardware | Trucking companies, port security, terminal operators |
Baltimore shows what this can look like in practice: from 2012 to 2016, cargo volume rose 10% while emissions fell 19% after equipment upgrades and truck replacement. [1] Results like that help shape the project design choices that come next.
Design the core elements of a green port project
After ranking projects, move from priorities to design. Each option has to fit the port’s grid, fleet, shoreline, and nearby community. For NGOs, the bar is simple: does the project cut the dirtiest pollution, and does it help the neighborhoods that carry the heaviest load?
Cut operational emissions with shore power and electrified equipment
Shore power lets docked ships plug into grid electricity and shut off diesel engines. That sounds simple on paper, but in practice it means dockside power upgrades and vessel-compatible hookups. It makes the most sense at ports with large numbers of berthed ocean-going vessels, where the emissions payoff is highest.
For cargo handling and drayage, electrification should start where diesel pollution hits hardest. That usually means cranes, yard tractors, forklifts, and trucks operating near overburdened communities. Federal incentives of up to $40,000 per truck can help narrow the cost gap. [3]
Add renewable energy, storage, and resilient power systems
On-site solar on warehouse rooftops and parking structures is a practical place to start. Pairing solar with storage can support charging demand and keep critical functions running during outages. Microgrids that can serve nearby neighborhoods during emergencies give residents a direct, concrete return from port energy spending.
Protect shorelines and water quality with nature-based and green site design
Ports face serious physical risks from sea-level rise, storm surge, and flooding. The choices made now will shape how well these sites hold up over time. Nature-based solutions can outperform hard seawalls while also improving water quality and supporting biodiversity. [1]
The Port of Baltimore offers a good example. It used a TIGER grant to install a stormwater management system, elevate critical assets against sea-level rise, and use dredged material to restore Poplar Island in the Chesapeake Bay. [1] Bioswales and rain gardens can work alongside those bigger shoreline efforts at a lower cost, helping filter runoff and reduce flooding in nearby neighborhoods where space or budget is tight.
Use these options to match each project to the port constraint it solves - emissions, resilience, runoff, or community health.
Once the core design is set, the next move is getting partners, permits, and capital lined up around the same project scope.
Build partnerships, funding, and governance that can deliver
After project design, the tougher issue shows up fast: who makes decisions, who pays, and who signs off? Once the scope is set, governance shapes approvals, funding, and the pace of delivery.
Engage port authorities, communities, labor, and public agencies early
The port projects that last are usually built by a coalition, not carried by one internal champion. The Port of Oakland’s $322 million EPA Clean Ports Program award in December 2024 is a good example. It was backed by a coalition of 20 community-based organizations, along with terminal operators and workforce development partners. [7]
For NGOs, that points to a simple move: map stakeholders before project design begins. Identify frontline residents, local labor groups, terminal operators, and public agencies at the start. Then give them a seat at the table through working groups or advisory panels, so residents, labor, operators, and agencies help shape the plan early. It also helps to bring those same groups into funding talks. That way, the project scope lines up with what lenders and grantmakers are prepared to support.
Alignment with the Justice40 Initiative can also strengthen federal funding applications. The program requires that 40% of the benefits of certain federal investments flow to disadvantaged communities. [2]
Match projects to grants, green bonds, and blended capital
Once stakeholders are lined up, the next step is matching each project to the right source of capital. Not every port project fits the same funding model, and forcing the wrong fit can slow things down.
Shore power and community air monitoring make a strong case for public support. They offer clear public health and environmental gains, but they often have limited direct commercial return. That makes them a strong fit for federal grants and philanthropic capital. Large-scale electrification or renewable energy installations usually need a mixed funding stack instead. In those cases, a public grant or foundation investment can reduce enough risk to draw in private green lenders.
Funding Source | Best Fit For | Key Characteristics |
|---|---|---|
EPA Clean Ports Program | Zero-emission equipment, shore power, planning | $3 billion available; prioritizes near-port community health [7][2] |
DERA (Diesel Emissions Reduction Act) Grants | Diesel engine and truck replacement | Federal grants for replacing older, high-polluting diesel engines [1] |
RAISE / TIGER Grants | Infrastructure resilience, stormwater, multimodal | Supports large-scale adaptation and climate projects [1] |
Green Bonds | Renewable energy, grid upgrades, large electrification | Attracts impact-focused private capital; requires green use-of-proceeds reporting [8] |
Blended Capital | High-risk or innovative technology | Combines public/philanthropic grants with private investment to manage risk [8][9] |
Build the financial story early. Spell out who pays for what, and document that structure clearly. It makes the project easier for green lenders to evaluate and helps keep the scope aligned with grant rules. [8]
How Council Fire can help turn strategy into action
Council Fire helps NGOs turn port strategy into a credible investment case, clear metrics, and a fundable plan. From there, the work is to track whether the project delivers the emissions, resilience, and equity gains it promised.
Measure results and plan your next steps
Track performance with clear metrics
A baseline shows whether a project delivered what it promised. Before swapping out equipment or restoring a shoreline, record the starting point: diesel use, asthma rates, habitat conditions, and local jobs. Use the same priorities that shaped project selection in the first place: emissions, resilience, equity, and feasibility.
Use these indicators to compare projects against one shared baseline:
Project Type | Baseline Method | Core Indicators | Likely Data Sources |
|---|---|---|---|
Operational Electrification | Pre-project diesel fuel consumption logs | Annual CO2e reductions; gallons of diesel saved; NOx and PM reductions | Fuel purchase records; equipment telematics; utility bills |
Shore Power | Average auxiliary engine run-time per vessel call | % reduction in at-berth emissions; kWh of renewable energy used | Vessel berthing logs; shore power connection meters; air quality monitors |
Nature-Based Shorelines | Historical erosion rates; habitat surveys | Acres of habitat restored; shoreline feet stabilized; avoided flood damage ($) | Satellite imagery; GIS mapping; municipal insurance claims |
Stormwater and Water Quality | Pre-project heavy metal concentrations in water (e.g., copper) | % reduction in copper and other pollutants; dissolved oxygen levels | Water quality sensors; EPA monitoring stations |
Community Health & Equity | Local asthma and ER visit rates in port-adjacent zip codes | Asthma ER visits; PM2.5 exposure; respiratory symptom days | Public health records; air quality sensor networks |
Workforce and Local Hiring | Local employment census in the maritime sector | New local hires; workforce training completion rates | Payroll data; grant reporting documents |
Good baseline data turns outcomes into something you can measure, not just claim. If federal funding is part of the mix, line up your indicators with Justice40 requirements. Showing that 40% of project benefits reach disadvantaged communities is more than a compliance task - it can strengthen future grant applications and build trust with residents living near the port. [2]
Steps NGOs can take next
Once metrics are in place, use them to steer implementation and public reporting. The move from assessment to impact is pretty direct. Start with an emissions and community health inventory. That gives you the ground truth. Then choose two or three priority projects based on the criteria already set: emissions reduction potential, resilience value, equity benefit, and feasibility.
Bring stakeholders in early, not halfway through the process. That means near-port residents, labor groups, terminal operators, and public agencies. After that, match each project with the right funding source, such as the EPA Clean Ports Program or DERA grants. Before work begins, lock in the metrics you’ll track and how results will be shared.
Public reporting matters here. It keeps expectations clear, gives funders something concrete to review, and shows communities whether promised gains are showing up on the ground. The strongest nonprofit role is often to connect climate goals, public health, ecosystem protection, and community economic benefit in one port transition plan - then track results, report them openly, and hold every party to account for delivery.
FAQs
How can a small nonprofit start a port emissions baseline?
A small nonprofit can get started with the U.S. Environmental Protection Agency’s Port Emissions Inventory Guidance. It gives a standard way to estimate emissions from vessels, harbor craft, cargo-handling equipment, on-road vehicles, and rail.
Start by setting the inventory’s geographic scope. That means drawing clear marine and landside boundaries and stating what the inventory is for, whether that’s voluntary research or support for a regulatory process. From there, EPA tabular data and default activity assumptions can help build a solid baseline.
Which green port projects deliver the fastest community health benefits?
Projects centered on electrification and swapping out older, high-emission equipment tend to bring the fastest health gains for nearby communities.
When ports replace diesel-powered drayage trucks, harbor craft, and cargo-handling equipment with zero-emission electric options - and add shore power for ships at berth - the payoff can come fast. Local air pollution drops. Noise levels fall. And for residents living close by, that can mean lower exposure to the health risks tied to port activity.
How can NGOs fund green port projects without owning port assets?
NGOs and nonprofits can play a direct role in funding green port projects even if they don’t own port assets. The usual path is to partner with eligible public entities such as port authorities, local or Tribal governments, and regional air quality agencies.
That kind of partnership can strengthen joint applications for federal programs like the EPA’s $3 billion Clean Ports Program. It can also help pay for work that often sets the stage for larger port upgrades, including air quality monitoring, emissions baselining, and climate resiliency planning.
Related Blog Posts
How to Turn a Strategic Plan into Fundable, Shovel-Ready Projects for Maritime & Logistics Companies
How to Decarbonize Maritime Operations and Supply Chains for Municipalities & Government Agencies
How to Design Green Port Infrastructure for the Future for Municipalities & Government Agencies
How to Design Green Port Infrastructure for the Future for Corporations
Latest Articles
©2025
Narrative Change and Power Building: The Missing Half of Advocacy
Narrative change is the process of disrupting dominant narratives that normalize inequity and advancing new narratives from historically marginalized communities.
Funding Resilience Without Federal Grants
BRIC is unreliable and FEMA is shrinking. Here's how cities fund climate resilience with dedicated revenue, blended finance, and a coordinating authority.
The ESG Blind Spot: How AI Is Finding Risks in Companies Nobody Else Is Watching
Norway's sovereign wealth fund uses AI to screen 7,200 portfolio companies for forced labor and corruption within 24 hours. The real story is the emerging-market coverage gap that traditional ESG data vendors miss — and what it means for any company with a global supply chain.
FAQ
01
What does it really mean to “redefine profit”?
02
What makes Council Fire different?
03
Who does Council Fire work with?
04
What does working with Council Fire actually look like?
05
How does Council Fire help organizations turn big goals into action?
06
How does Council Fire define and measure success?
Jun 18, 2026
How to Design Green Port Infrastructure for the Future for NGOs & Nonprofits
Sustainability Strategy
In This Article
NGO guide: map port emissions, prioritize shore power & electrification, align partners/funding, and track health and climate metrics.
How to Design Green Port Infrastructure for the Future for NGOs & Nonprofits
Ports can cut ship pollution by up to 98% at berth, and NGOs can help make that happen. If I were guiding a nonprofit team, I’d keep the plan simple: measure the harm, pick the projects with the biggest local health gains, line up partners and funding, and track results in public.
Here’s the short version:
Start with a baseline. Map emissions from ships, trucks, rail, and cargo equipment, then match that with asthma, income, and neighborhood data.
Pick a short list of projects. Focus on shore power, electric cargo equipment, zero-emission trucks, clean energy systems, and shoreline projects that lower flood risk.
Score each option. Compare pollution cuts, climate risk reduction, community health impact, cost, and permit risk.
Build the right group early. Bring in residents, labor, terminal operators, utilities, and public agencies before project design is locked.
Match each project to money. Use grants for public-health-focused work like air monitoring and shore power; use mixed capital for power, charging, and grid work.
Track proof, not promises. Measure diesel saved, PM and NOx cuts, asthma trends, habitat acres restored, and local hiring.
A few numbers show why this matters. The Ports of Los Angeles and Long Beach produce 100 tons of smog per day, and Baltimore showed that cargo can grow while emissions fall - cargo rose 10% while emissions dropped 19% after equipment and truck changes.
If I had to reduce the full guide to one line, it would be this: the best green port plan is the one that cuts the dirtiest pollution first, protects nearby neighborhoods, and shows the numbers in plain view.
Green Port Progress Report: Operations
Map port impacts and choose the right priorities
Green Port Projects: Emissions Cuts, Difficulty & Key Benefits at a Glance
Start with a baseline for port emissions, community exposure, and climate risk. Without that starting point, NGOs are left guessing. It becomes much harder to target the biggest harms or make a solid case for funding. A good baseline turns community harm into a ranked project list, so groups can focus on projects that deliver the fastest and broadest gains.
Build an emissions and community impact baseline
A solid baseline begins with an inventory of emissions from ships, trucks, rail, and equipment across six sectors: ocean-going vessels, harbor craft, recreational marine, cargo handling equipment, on-road vehicles (drayage trucks), and rail. [4][5] For each sector, you need activity data such as vessel calls, fuel types, truck trip counts, engine model years, and equipment counts. That data is then used to estimate air pollutants like PM, NOx, air toxics, and greenhouse gases over a set period. [4][5]
If a full port-wide inventory is out of reach, start smaller. A port-owned equipment fleet or a single terminal can still give you a workable picture. [4] At the same time, map near-port exposure using health, income, and demographic data so you can see which neighborhoods carry the heaviest burden.
Use assessment frameworks to compare needs across projects
Once the baseline is in place, use established tools to compare projects on equal terms. The U.S. EPA Ports Initiative guidance includes emissions inventory methods and community engagement tools, including the Community-Port Collaboration Toolkit and the EPA Ports Primer. [4][6] The World Ports Sustainability Program gives ports a benchmarking structure for energy, climate, and community performance. [1]
For resilience, the U.S. Climate Resilience Toolkit's Ports Resilience Index helps assess a port's exposure to storm surges, sea-level rise, flooding, and extreme heat. [4] These frameworks help NGOs tie emissions cuts to public health, resilience, and equity. Used together, they make it easier to spot where emissions cuts, resilience gains, and community benefits line up best.
Rank projects by emissions, resilience, equity, and feasibility
With baseline data and a framework-based project list in hand, score each project against a short set of criteria. Look at tons of CO2e avoided per year, cuts in NOx, SOx, and PM, measurable health benefits for nearby communities, flood protection value, permitting complexity, and estimated capital cost in U.S. dollars. [4][1]
This is more than a technical exercise. These criteria shape public pressure, funding requests, and accountability. In plain terms, they help NGOs compare options the same way port planners and funders do.
Project Type | Primary Benefits | Difficulty | Key Stakeholders |
|---|---|---|---|
Shore Power | Up to 98% reduction in at-berth vessel emissions; significant health gains for near-port residents [1] | High - requires significant electrical grid upgrades | Port authorities, utility companies, shipping lines |
Cargo Equipment Electrification | 60% to 80% CO2 reduction; 30% lower repair costs vs. diesel [1] | Moderate - phased fleet replacement | Terminal operators, labor unions, equipment manufacturers |
Truck Replacement Programs | 96% reduction in PM2.5 at the Port of New Orleans [1] | Moderate - depends on grant funding and incentives | Drayage owner-operators, EPA (DERA grants), state agencies |
Nature-Based Shorelines | Storm surge protection; habitat restoration; carbon sequestration | Moderate to High - permitting and ecological design | Environmental NGOs, coastal engineers, local communities |
Operational Efficiency (Gate Automation) | Reduced truck idling and fuel waste | Low to Moderate - software and gate hardware | Trucking companies, port security, terminal operators |
Baltimore shows what this can look like in practice: from 2012 to 2016, cargo volume rose 10% while emissions fell 19% after equipment upgrades and truck replacement. [1] Results like that help shape the project design choices that come next.
Design the core elements of a green port project
After ranking projects, move from priorities to design. Each option has to fit the port’s grid, fleet, shoreline, and nearby community. For NGOs, the bar is simple: does the project cut the dirtiest pollution, and does it help the neighborhoods that carry the heaviest load?
Cut operational emissions with shore power and electrified equipment
Shore power lets docked ships plug into grid electricity and shut off diesel engines. That sounds simple on paper, but in practice it means dockside power upgrades and vessel-compatible hookups. It makes the most sense at ports with large numbers of berthed ocean-going vessels, where the emissions payoff is highest.
For cargo handling and drayage, electrification should start where diesel pollution hits hardest. That usually means cranes, yard tractors, forklifts, and trucks operating near overburdened communities. Federal incentives of up to $40,000 per truck can help narrow the cost gap. [3]
Add renewable energy, storage, and resilient power systems
On-site solar on warehouse rooftops and parking structures is a practical place to start. Pairing solar with storage can support charging demand and keep critical functions running during outages. Microgrids that can serve nearby neighborhoods during emergencies give residents a direct, concrete return from port energy spending.
Protect shorelines and water quality with nature-based and green site design
Ports face serious physical risks from sea-level rise, storm surge, and flooding. The choices made now will shape how well these sites hold up over time. Nature-based solutions can outperform hard seawalls while also improving water quality and supporting biodiversity. [1]
The Port of Baltimore offers a good example. It used a TIGER grant to install a stormwater management system, elevate critical assets against sea-level rise, and use dredged material to restore Poplar Island in the Chesapeake Bay. [1] Bioswales and rain gardens can work alongside those bigger shoreline efforts at a lower cost, helping filter runoff and reduce flooding in nearby neighborhoods where space or budget is tight.
Use these options to match each project to the port constraint it solves - emissions, resilience, runoff, or community health.
Once the core design is set, the next move is getting partners, permits, and capital lined up around the same project scope.
Build partnerships, funding, and governance that can deliver
After project design, the tougher issue shows up fast: who makes decisions, who pays, and who signs off? Once the scope is set, governance shapes approvals, funding, and the pace of delivery.
Engage port authorities, communities, labor, and public agencies early
The port projects that last are usually built by a coalition, not carried by one internal champion. The Port of Oakland’s $322 million EPA Clean Ports Program award in December 2024 is a good example. It was backed by a coalition of 20 community-based organizations, along with terminal operators and workforce development partners. [7]
For NGOs, that points to a simple move: map stakeholders before project design begins. Identify frontline residents, local labor groups, terminal operators, and public agencies at the start. Then give them a seat at the table through working groups or advisory panels, so residents, labor, operators, and agencies help shape the plan early. It also helps to bring those same groups into funding talks. That way, the project scope lines up with what lenders and grantmakers are prepared to support.
Alignment with the Justice40 Initiative can also strengthen federal funding applications. The program requires that 40% of the benefits of certain federal investments flow to disadvantaged communities. [2]
Match projects to grants, green bonds, and blended capital
Once stakeholders are lined up, the next step is matching each project to the right source of capital. Not every port project fits the same funding model, and forcing the wrong fit can slow things down.
Shore power and community air monitoring make a strong case for public support. They offer clear public health and environmental gains, but they often have limited direct commercial return. That makes them a strong fit for federal grants and philanthropic capital. Large-scale electrification or renewable energy installations usually need a mixed funding stack instead. In those cases, a public grant or foundation investment can reduce enough risk to draw in private green lenders.
Funding Source | Best Fit For | Key Characteristics |
|---|---|---|
EPA Clean Ports Program | Zero-emission equipment, shore power, planning | $3 billion available; prioritizes near-port community health [7][2] |
DERA (Diesel Emissions Reduction Act) Grants | Diesel engine and truck replacement | Federal grants for replacing older, high-polluting diesel engines [1] |
RAISE / TIGER Grants | Infrastructure resilience, stormwater, multimodal | Supports large-scale adaptation and climate projects [1] |
Green Bonds | Renewable energy, grid upgrades, large electrification | Attracts impact-focused private capital; requires green use-of-proceeds reporting [8] |
Blended Capital | High-risk or innovative technology | Combines public/philanthropic grants with private investment to manage risk [8][9] |
Build the financial story early. Spell out who pays for what, and document that structure clearly. It makes the project easier for green lenders to evaluate and helps keep the scope aligned with grant rules. [8]
How Council Fire can help turn strategy into action
Council Fire helps NGOs turn port strategy into a credible investment case, clear metrics, and a fundable plan. From there, the work is to track whether the project delivers the emissions, resilience, and equity gains it promised.
Measure results and plan your next steps
Track performance with clear metrics
A baseline shows whether a project delivered what it promised. Before swapping out equipment or restoring a shoreline, record the starting point: diesel use, asthma rates, habitat conditions, and local jobs. Use the same priorities that shaped project selection in the first place: emissions, resilience, equity, and feasibility.
Use these indicators to compare projects against one shared baseline:
Project Type | Baseline Method | Core Indicators | Likely Data Sources |
|---|---|---|---|
Operational Electrification | Pre-project diesel fuel consumption logs | Annual CO2e reductions; gallons of diesel saved; NOx and PM reductions | Fuel purchase records; equipment telematics; utility bills |
Shore Power | Average auxiliary engine run-time per vessel call | % reduction in at-berth emissions; kWh of renewable energy used | Vessel berthing logs; shore power connection meters; air quality monitors |
Nature-Based Shorelines | Historical erosion rates; habitat surveys | Acres of habitat restored; shoreline feet stabilized; avoided flood damage ($) | Satellite imagery; GIS mapping; municipal insurance claims |
Stormwater and Water Quality | Pre-project heavy metal concentrations in water (e.g., copper) | % reduction in copper and other pollutants; dissolved oxygen levels | Water quality sensors; EPA monitoring stations |
Community Health & Equity | Local asthma and ER visit rates in port-adjacent zip codes | Asthma ER visits; PM2.5 exposure; respiratory symptom days | Public health records; air quality sensor networks |
Workforce and Local Hiring | Local employment census in the maritime sector | New local hires; workforce training completion rates | Payroll data; grant reporting documents |
Good baseline data turns outcomes into something you can measure, not just claim. If federal funding is part of the mix, line up your indicators with Justice40 requirements. Showing that 40% of project benefits reach disadvantaged communities is more than a compliance task - it can strengthen future grant applications and build trust with residents living near the port. [2]
Steps NGOs can take next
Once metrics are in place, use them to steer implementation and public reporting. The move from assessment to impact is pretty direct. Start with an emissions and community health inventory. That gives you the ground truth. Then choose two or three priority projects based on the criteria already set: emissions reduction potential, resilience value, equity benefit, and feasibility.
Bring stakeholders in early, not halfway through the process. That means near-port residents, labor groups, terminal operators, and public agencies. After that, match each project with the right funding source, such as the EPA Clean Ports Program or DERA grants. Before work begins, lock in the metrics you’ll track and how results will be shared.
Public reporting matters here. It keeps expectations clear, gives funders something concrete to review, and shows communities whether promised gains are showing up on the ground. The strongest nonprofit role is often to connect climate goals, public health, ecosystem protection, and community economic benefit in one port transition plan - then track results, report them openly, and hold every party to account for delivery.
FAQs
How can a small nonprofit start a port emissions baseline?
A small nonprofit can get started with the U.S. Environmental Protection Agency’s Port Emissions Inventory Guidance. It gives a standard way to estimate emissions from vessels, harbor craft, cargo-handling equipment, on-road vehicles, and rail.
Start by setting the inventory’s geographic scope. That means drawing clear marine and landside boundaries and stating what the inventory is for, whether that’s voluntary research or support for a regulatory process. From there, EPA tabular data and default activity assumptions can help build a solid baseline.
Which green port projects deliver the fastest community health benefits?
Projects centered on electrification and swapping out older, high-emission equipment tend to bring the fastest health gains for nearby communities.
When ports replace diesel-powered drayage trucks, harbor craft, and cargo-handling equipment with zero-emission electric options - and add shore power for ships at berth - the payoff can come fast. Local air pollution drops. Noise levels fall. And for residents living close by, that can mean lower exposure to the health risks tied to port activity.
How can NGOs fund green port projects without owning port assets?
NGOs and nonprofits can play a direct role in funding green port projects even if they don’t own port assets. The usual path is to partner with eligible public entities such as port authorities, local or Tribal governments, and regional air quality agencies.
That kind of partnership can strengthen joint applications for federal programs like the EPA’s $3 billion Clean Ports Program. It can also help pay for work that often sets the stage for larger port upgrades, including air quality monitoring, emissions baselining, and climate resiliency planning.
Related Blog Posts
How to Turn a Strategic Plan into Fundable, Shovel-Ready Projects for Maritime & Logistics Companies
How to Decarbonize Maritime Operations and Supply Chains for Municipalities & Government Agencies
How to Design Green Port Infrastructure for the Future for Municipalities & Government Agencies
How to Design Green Port Infrastructure for the Future for Corporations
Latest Articles
©2025
Narrative Change and Power Building: The Missing Half of Advocacy
Narrative change is the process of disrupting dominant narratives that normalize inequity and advancing new narratives from historically marginalized communities.
Funding Resilience Without Federal Grants
BRIC is unreliable and FEMA is shrinking. Here's how cities fund climate resilience with dedicated revenue, blended finance, and a coordinating authority.
The ESG Blind Spot: How AI Is Finding Risks in Companies Nobody Else Is Watching
Norway's sovereign wealth fund uses AI to screen 7,200 portfolio companies for forced labor and corruption within 24 hours. The real story is the emerging-market coverage gap that traditional ESG data vendors miss — and what it means for any company with a global supply chain.
FAQ
What does it really mean to “redefine profit”?
What makes Council Fire different?
Who does Council Fire work with?
What does working with Council Fire actually look like?
How does Council Fire help organizations turn big goals into action?
How does Council Fire define and measure success?