
Sep 21, 2026
Community Energy Metrics: 12 Key Measures
Sustainability Strategy
In This Article
A practical scorecard of 12 KPIs to judge whether community energy projects truly deliver reliability, savings, equity, and resilience.
Community Energy Metrics: 12 Key Measures
If you only track power output, you can miss the point. After launch, a community energy project should be judged on 12 measures: uptime, energy output, cost recovery, bill savings, service reach, partner trust, complaint rates, local skill growth, carbon savings, community investor returns, grid resilience benefits, and social return on investment.
I’d sum it up this way: you need to know if the project stays online, pays its bills, cuts household costs, reaches the right people, keeps support, builds local jobs, lowers CO₂e, shares returns, and holds up during outages. The article also shows where projects often fall short, like strong cost recovery with weak bill savings or high uptime that still fails during storms.
Here’s the quick view:
Technical: uptime, energy output, resilience
Financial: cost recovery, bill savings, investor returns
Community: service reach, trust, complaint rates, skill growth
Climate and total impact: carbon savings, SROI
KPI | What it answers |
|---|---|
Uptime | Is the system available when needed? |
Energy Output | How much power did it deliver? |
Cost Recovery | Does revenue cover costs and debt? |
Bill Savings | Are households paying less? |
Service Reach | Who is getting the project’s gains? |
Partner Trust | Do local partners still back the project? |
Complaint Rates | Are billing or service problems growing? |
Local Skill Growth | Are local residents getting jobs and training? |
Carbon Savings | How much CO₂e did the project avoid? |
Community Investor Returns | Are local owners getting paid? |
Grid Resilience Benefits | Did the project help during outages and extreme events? |
SROI | What is the total social and economic value per $1 spent? |
Bottom line: I’d use these 12 KPIs as one scorecard, not as stand-alone numbers, because a project can look strong in one area and still miss its community mission.
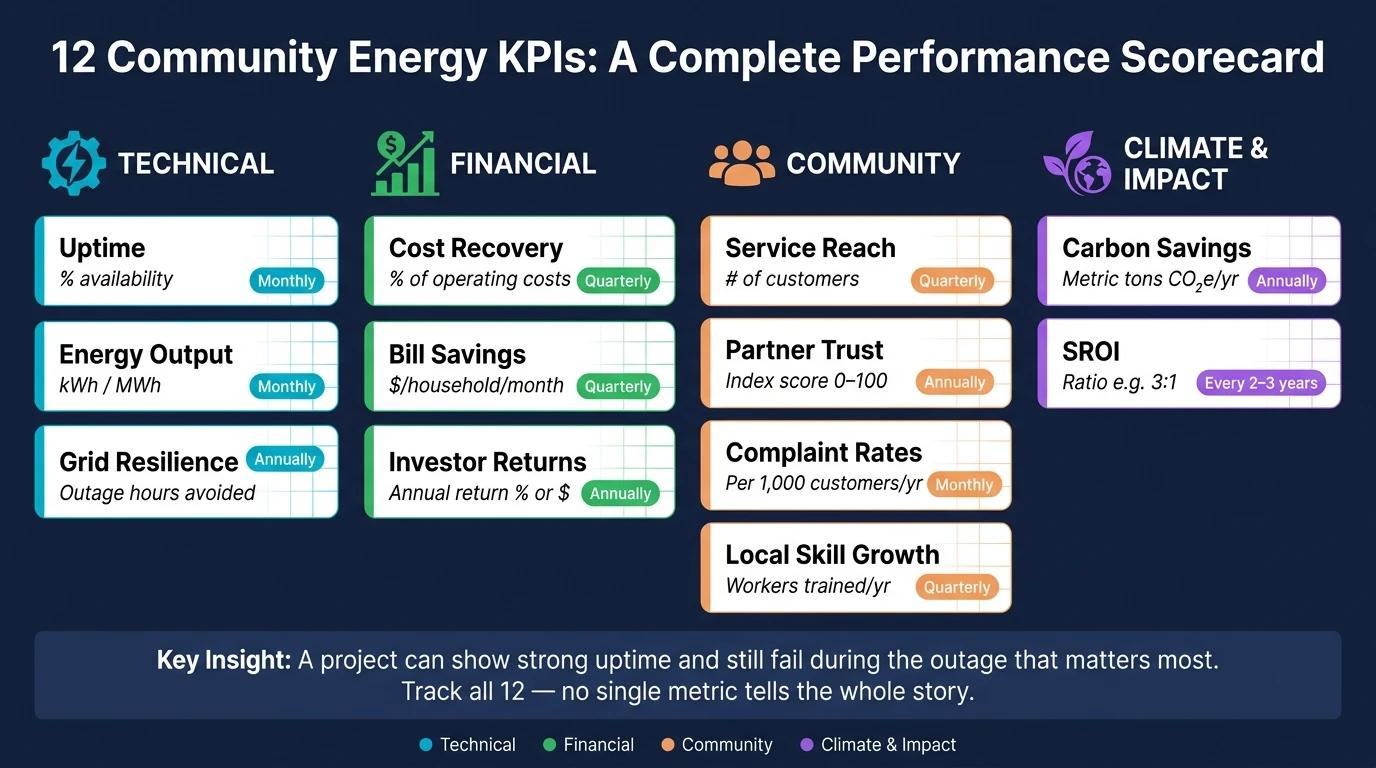
12 Community Energy KPIs: A Complete Performance Scorecard
Energizing Rural Communities Prize: SMART Goals & Metrics Development
Why These Metrics Matter After Launch
Once a project goes live, the job changes. The focus moves from delivery to performance. Finishing a community energy project on schedule and on budget is a clear win. But the harder test comes after launch, across the full operating life of the project. That’s where most of the upside - or most of the risk - shows up.
A project can hit its construction targets and still fall short of its promise to the community. It may produce less power than expected, leave low-income households out of meaningful savings, or chip away at trust through billing problems and weak communication. That’s why it’s not enough to ask whether the project was built. You have to measure what it keeps delivering over time.
These five dimensions frame the 12 metrics below.
Dimension | What It Reveals |
|---|---|
Reliability | Is the system staying online when people need it most? |
Financial durability | Are revenues covering costs without constant subsidies? |
Social acceptance | Do residents feel the project is fair and well-run? |
Equity | Are low-income households and underserved groups genuinely included? |
Long-term value | Is the project creating jobs, cutting emissions, and strengthening the grid? |
A project can be technically sound and still miss its community mission if trust, reach, or equity start to slip.
1. Uptime
Definition
Uptime is the share of time a community energy system is available to generate power or deliver service during a review period, excluding approved planned outages. In solar and battery projects, that means the hours when the system is online and working as intended. In a district energy system, it means the hours when the system meets its set service levels, such as temperature and flow rate.
The formula is simple: (total hours - unplanned downtime hours) ÷ total hours × 100. It gives teams a clear baseline they can use month after month or year after year.
Why It Matters
After launch, uptime is often the first number people check. It tells you, in plain terms, whether the system is there when it’s supposed to be. If availability slips, energy delivery slips with it. So do savings and revenue.
Even a small drop can have a material effect on output and project performance. It can also chip away at stakeholder trust. That’s why uptime comes before almost every other operating or financial metric.
How to Measure in U.S. Practice
In most U.S. projects, teams use 15-minute or hourly interval data. Intervals that fall below a set production threshold are marked as unavailable. That matters because it keeps normal low production from being mistaken for an outage.
When you need a closer look at lost output, use energy-weighted availability. A midday outage usually costs far more than a nighttime outage, so this method gives a fairer picture of what the project lost.
Typical Data Sources
Common sources include:
Inverter logs
Revenue meters
Maintenance logs
Utility outage records
Once uptime is stable, the next question is how much energy the project actually produces.
2. Energy Output
Definition
Energy output is the total usable electricity a community energy system produces over a set period, usually tracked in kilowatt-hours (kWh) or megawatt-hours (MWh). In the U.S., most projects log output daily, monthly, and annually. For financial and emissions reporting, annual output is usually the main number people look at.
It’s worth drawing a clean line here: energy output is not the same as installed capacity. Installed capacity tells you the size of the system. Energy output tells you how much electricity the system actually delivered over time.
Why It Matters
If uptime tells you the system was available, output tells you what it actually produced. That makes output the core number behind savings, revenue, and emissions reporting.
This is where the project starts to prove its value in plain terms:
Bill savings come from electricity produced.
Cost recovery depends on electricity produced.
Carbon estimates depend on electricity produced.
Revenue from power sales and bill credits follows electricity produced.
When output falls below projection, the ripple effect is immediate. Savings drop. Revenue comes in lower than expected. Carbon benefits shrink too.
How to Measure in U.S. Practice
In day-to-day U.S. project operations, the starting point is the revenue-grade meter at the point of interconnection. That meter is the source used for billing and utility credit calculations, so it serves as the main reference point. From there, operators usually rely on SCADA or inverter monitoring to collect 15-minute or hourly data and see how the system is performing across the day.
To judge whether the system is doing what it should, compare actual monthly and annual kWh against pre-construction energy yield models. Tools like NREL's PVWatts are common benchmarks for that check. If the gap between projected and actual output sticks around, it often points to a real issue such as equipment trouble, shading, soiling, or grid constraints.
Use the meter as the source of truth. Use monitoring tools to explain why the numbers moved.
Typical Data Sources
Source | What It Provides |
|---|---|
Revenue-grade meter (utility) | Authoritative kWh delivered; basis for billing and credits |
SCADA / inverter monitoring | Interval data; helps flag curtailment, outages, and production drops |
Inverter and equipment logs | Cross-check for meter data; records outages and curtailment |
Energy yield models (e.g., PVWatts) | Pre-construction benchmarks for variance analysis |
State program reporting platforms | Regulatory generation records; additional audit trail |
Reconciling utility and SCADA data gives operators a defensible output record for reporting and oversight. That record then serves as the baseline for cost recovery, savings, and carbon reporting.
3. Cost Recovery
Definition
Cost recovery is the rate at which a project's revenues cover its ongoing operating costs. In plain terms, it shows whether the money coming in is enough to pay for day-to-day expenses and debt service. That revenue can come from energy sales, subscriber payments, RECs, incentives, or tariffs. Costs usually include O&M, insurance, leases, administration, and debt service.
Why It Matters
Cost recovery sits at the point where system performance meets financial reality. If a project has strong uptime and good output, revenue should follow. When that doesn’t happen, the warning signs show up fast: maintenance gets pushed back, uptime slips, and confidence in the project starts to erode.
In community projects, the impact can hit residents directly. A shortfall may lead to higher tariffs or cuts in service. Lenders watch this closely as well, especially through DSCR, and many want to see at least 1.2 to 1.3.
How to Measure in U.S. Practice
In U.S. practice, teams usually track two KPIs each year:
Operating Cost Recovery Ratio = total revenues ÷ total operating costs
DSCR = net operating income ÷ annual debt service
Use recurring project revenue only. That means no one-time grants and no pilot subsidies in the calculation. The goal is to see whether the project can stand on its own, month after month, not just look good on paper for a single year.
For community solar, NREL benchmarks place annual O&M and subscriber management costs at about $39.83–$40.51 per kWdc [2][3]. That gives teams a grounded cost target when they review project performance.
If the project can cover its costs, the next thing to check is whether those savings are reaching participants.
Typical Data Sources
Source | What It Tracks | Who Holds It |
|---|---|---|
Project financial statements | Revenue, expenses, debt service, cash flow | Developer, municipal finance office, or SPE |
Utility billing and metering records | kWh exported, net metering credits, time-of-use revenue | Interconnecting utility |
Subscriber/CRM platform | Subscription levels, payment history, churn rate | Program administrator |
Contracts and incentive documents | PPA terms, REC sale agreements, incentive award letters | Developer or project sponsor |
O&M and vendor invoices | Actual maintenance and service costs | Project operator |
Good cost recovery analysis depends on clean, reconciled data across these sources. If the numbers from billing, finance, and operations don’t line up, the results can get shaky fast. Projects that set up data-sharing agreements with utility partners early usually have a much easier time producing reliable financial reports, especially when they’re seeking added funding or refinancing.
Once cost recovery is stable, the next question is whether households are seeing lower bills.
4. Bill Savings
Definition
Bill savings is the net drop in a participant's total electricity cost after credits and fees. The key is to measure savings against the full utility bill, not just supply charges. A deal may look good on paper, but fixed fees can wipe out much of the gain. Savings are usually shown as a monthly dollar amount, a percentage off the total bill, or a projected lifetime figure across the contract term.
Why It Matters
Cost recovery shows whether a project can keep going. Bill savings show whether it is helping households in a way they can feel. People notice one thing first: Did my bill go down?
For low- and moderate-income (LMI) households, lower power bills can ease energy burden, which can support housing stability, health, and climate resilience. Typical community solar subscribers save 5%–15%. Income-qualified programs often aim for 20% or more. [1][4][5]
How to Measure in U.S. Practice
The basic formula is simple: baseline bill minus post-enrollment bill, after credits and fees. In the field, teams usually compare 12 months of pre- and post-enrollment bills so seasonal swings do not distort the result.
It also helps to track kWh credits and dollar savings as separate measures. Why? Because the final bill is shaped by more than energy use alone. Rate changes, fixed charges, and program fees can all change what a household actually pays.
When rates shift, the cleanest approach is to compare the actual post-enrollment cost with a modeled cost under current tariffs.
Typical Data Sources
Source | What It Tracks |
|---|---|
Utility billing records | Pre- and post-enrollment charges, credits, and usage (kWh) |
Subscription or crediting system | Credits applied, discount rates, and program fees per customer |
Rate schedules and tariff filings | Current and historical rates and fees |
Smart meter / interval data | Consumption patterns for normalizing savings across seasons |
Regulatory filings or independent evaluations | Program-level savings validation and methodology benchmarks |
Consolidated billing, where credits and charges appear on one statement, makes savings much easier to check. Separate statements often lead to confusion and complaints. [5][6]
Once participant savings are clear, the next question is how widely those benefits reach.
5. Service Reach
Definition
Service reach shows how far a project's benefits actually spread. It should cover both active participants - like enrolled subscribers or tariff customers - and people who aren't enrolled but still may get better reliability or cleaner air.
Why It Matters
Bill savings only matter if the households meant to benefit can get through the door. Bill savings tell you how much participants gain. Service reach tells you who gets that gain. As of December 2022, LMI community solar accounted for only about 2% of the U.S. market. [7]
Federal frameworks like Justice40, along with state community solar rules, more and more call for a meaningful share of benefits to go to low-income and disadvantaged communities. If you don't track service reach, you can't tell whether that is happening.
How to Measure in U.S. Practice
Measure reach at both the household and neighborhood level. A common approach is to map participant addresses to census tracts using GIS. From there, teams can pull demographic data from the American Community Survey and flag participants in disadvantaged communities with tools like EPA's EJScreen or the federal Climate and Economic Justice Screening Tool.
The core questions are simple:
Who participated?
Who qualified but did not enroll?
Where did each group live?
A report might show 750 residential customers, with 52% low-income, along with 20 small businesses and 5 critical facilities across 12 census tracts. It might also show that 65% of participants live in disadvantaged communities.
Another metric worth watching is the gap between eligible and enrolled households. In plain terms, this is the share of customers in the project's footprint who qualify but still haven't signed up. That gap often points straight to trouble spots in outreach or program design.
Typical Data Sources
Source | What It Tracks |
|---|---|
Utility customer information systems (CIS) | Addresses, rate classes, enrollment status, usage history |
U.S. Census Bureau / American Community Survey | Income, race/ethnicity, housing type by census tract |
Tract-level energy burden, household counts, median income | |
EPA EJScreen / Climate and Economic Justice Screening Tool | Disadvantaged community designations for geographic targeting |
Program enrollment databases (LIHEAP, housing authorities) | Low-income status verification for eligible participants |
Community surveys | Lived experience, barriers to enrollment, gaps in outreach |
Illinois' Solar For All program gives a good example of what this looks like when the data gets specific. In Program Year 5, 64% of community solar participants were renters, compared with 33% statewide. 57% were Black or African American, compared with 14% statewide. And 13% of subscribers lived in high energy burden areas. [8][9]
That level of detail helps answer a basic but important question: is the project reaching priority households, or is it just filling seats?
Reach data can also show whether a program is building support, not just enrollment. The next step is to see whether participants trust the program enough to stay involved.
6. Partner Trust
Definition
Partner trust is the confidence that local governments, utilities, nonprofits, funders, and technical partners have in a project's leadership to keep commitments, manage risk openly, and act in the community's interest (competence, integrity, and good faith). [10][12]
Why It Matters
Once service reach grows, the project has to keep a lot of parties moving in the same direction. Trust makes that possible. It helps when terms need to be revisited, supports co-investment, and gives lenders and regulators confidence that the project can be counted on. If a model is meant to spread to other places, trust often decides whether growth holds up or starts to crack.
In places with a long record of underinvestment, this carries extra weight. Trust can shape whether residents and local institutions view the project as a community asset or as one more version of past damage.
How to Measure in U.S. Practice
In U.S. practice, trust is usually tracked through a mix of partner surveys and behavior data. Surveys ask partners to score transparency, fairness, and responsiveness on a 1–5 scale. Those scores are then tracked quarterly or once a year by partner type, such as utility, local government, or nonprofit. Behavioral signs include governance meeting attendance, MOU and PPA renewal rates, and response times for data requests. [13][11]
Confidential third-party surveys tend to get more candid feedback. Public support during council meetings or regulatory hearings is also a strong signal that trust is holding. [14]
Typical Data Sources
Source | What It Tracks |
|---|---|
Partner surveys administered by a third party | Perceived transparency, competence, fairness, and responsiveness |
Governance meeting attendance logs | Participation rates and consistency of engagement |
MOU / PPA / community benefit agreement records | Initial commitments, renewals, amendments, and disputes |
Grievance resolution logs | Issue type, closure time, and escalation patterns |
Public statements and regulatory filings | Testimony, press releases, and commission comments |
When trust slips, complaints tend to climb. The next metric looks at that directly.
7. Complaint Rates
When partner trust tells you how the relationship feels, complaint rate shows what happens when that relationship gets tested.
Definition
Complaint rate is the number of documented complaints from customers or residents per 1,000 active customers over a set period. That includes complaints logged through customer service, local government, regulators, and public meetings. It helps to sort them into clear groups: billing, outages, enrollment, equipment, service quality, and fairness. Routine questions should not be counted.
Why It Matters
Complaint rate works like an early warning signal. If complaints jump right after a tariff change or a billing update, the root cause is often a communication gap rather than a system failure. In plain terms, people may not be confused by the service itself - they may be confused by how it was explained.
This data can also reveal fairness problems that uptime and output numbers may miss. If billing complaints cluster within one group, such as low-income or underserved participants, that points to a program design issue. It is not just a customer service problem sitting in a queue.
Public complaint tracking also shows whether the project responds in a prompt and fair way. That makes complaint tracking a quick way to find trouble in billing, enrollment, or service delivery before it spreads.
How to Measure in U.S. Practice
The formula is straightforward:
Complaint Rate = Number of complaints in period ÷ Number of active customer accounts
In U.S. practice, teams usually track complaints per 1,000 customers each month or each year. From there, the numbers should be broken out by complaint type and customer segment. Complaint volume on its own only tells part of the story, so pair it with resolution time to show whether the program is actually responding.
Typical Data Sources
Source | What It Tracks |
|---|---|
CRM or ticketing systems | Complaint volume, category, severity, and resolution status |
Call center and IVR logs | Call volumes, call reasons, and outcomes |
State PUC or consumer protection databases | Escalated complaints filed externally |
Local government and community engagement records | Complaints surfaced through civic channels, public meetings, or surveys |
Using more than one source matters because not every complaint gets logged in the same place. A complaint known to the city's 311 system but missing from the project operator's records still says something important about program performance.
When the same complaints keep showing up, the next issue is hard to ignore: whether local staffing and training are strong enough to fix them.
8. Local Skill Growth
After complaint rates, the next thing to look at is whether the project is helping local people build the skills to fix problems fast and keep the system running year after year.
Definition
Local skill growth measures how a community energy project helps local residents gain clean energy jobs and recognized credentials.
Why It Matters
When repair know-how stays close to the project, uptime tends to improve. Issues can be handled faster, and complaint resolution doesn't depend as much on outside crews. There's also a bigger social payoff here: projects can open steady career paths for residents who have often been left out of past energy investment.
The labor market shows why this matters. U.S. clean energy employment grew by 142,000 jobs in 2023, a 4.2% increase, and solar jobs now appear in 79% of U.S. counties.[17][16][15]
How to Measure in U.S. Practice
Don't stop at training counts. A project may train plenty of people and still fall short if jobs don't follow, wages are weak, or workers leave after a few months. The better approach is to track both workforce development and job quality.
Core measures include:
Number of local residents trained
Share of local hires, including site technicians, customer service staff, outreach workers, and data monitors
Industry-recognized credentials, such as NABCEP certification or OSHA 30 training
12-month job placement rate in a clean energy role
Retention rates over time
Starting wages compared with the county median wage
Demographic breakdowns by ZIP code, race, gender, and income level to confirm benefits reach priority communities
Typical Data Sources
Source | What It Tracks |
|---|---|
Training provider records (community colleges, trade schools, union apprenticeship programs) | Enrollment, completion rates, credentials awarded |
Local workforce development boards and state labor departments | Job placements, wages, occupation codes, demographic data |
Project contractor payroll and HR records | Share of local hires, job-years created, wage levels |
Community-based organization program reports | Participant demographics, support service use, placement outcomes |
DOE U.S. Energy and Employment Report (USEER) | National and state clean energy job benchmarks for local comparison |
9. Carbon Savings
After output, the next question is climate impact.
Definition
Carbon savings measure the greenhouse gases a project avoids by replacing higher-emitting grid electricity. Results are reported in metric tons of CO₂-equivalent (CO₂e) per year. That gives leaders a clear way to turn delivered kWh into a climate result they can track over time.
Why It Matters
Quantified avoided emissions help communities track climate impact and support grant, investor, and philanthropic reporting. This KPI also serves as a gut check: is the project delivering the emissions reduction it promised at launch?
How to Measure in U.S. Practice
The core formula is:
Avoided emissions (metric tons CO₂e) = Energy generated (kWh) × Grid emissions factor (kg CO₂e/kWh) ÷ 1,000 [19]
Here’s a simple example. A 2 MW community solar array that produces 3,000,000 kWh per year in a region with a 0.4 kg CO₂e/kWh grid factor avoids about 1,200 metric tons of CO₂e each year.
Use a region-specific EPA eGRID factor, and note whether you are applying an average or marginal rate. That choice matters because regional factors can differ by 20%–50%. [20] Keep avoided emissions separate from Scope 1, 2, and 3 reporting so you don’t double count. [18][21] It also helps to stick with the same emissions method in each reporting period so year-over-year results stay comparable.
Typical Data Sources
Use these sources to calculate and verify avoided emissions.
Source | What It Provides |
|---|---|
EPA eGRID | Regional CO₂e/kWh factors by subregion and balancing authority |
EPA & EIA fuel emissions factors | CO₂e per unit of natural gas, heating oil, diesel, and propane |
Meter/inverter data | Verified AC output (kWh) for solar; consumption data for efficiency projects |
Utility interval data and EM&V reports | Customer-level consumption, pre/post comparisons, program-verified savings |
ISO/RTO and state agencies | Marginal emissions rates, grid mix trends, regional decarbonization trajectories |
Plain-language carbon equivalents |
10. Community Investor Returns
After carbon savings, the next issue is simple: do local investors share in the money the project makes?
Definition
Community investor returns are the cash and in-kind benefits paid to local investors, members, or stakeholder owners over the project life. This metric shows whether ownership leads to actual payouts, not just good intentions.
Why It Matters
This metric makes it easier to see whether residents, workers, and local stakeholders are getting measurable value from the project, not just a seat at the table. That distinction matters. A project can talk a lot about shared ownership, but if no money or material benefit reaches the people involved, the promise falls flat.
For federally funded projects, Justice40 puts benefit-sharing near the center of performance. It requires that 40% of overall benefits from federal climate and energy investments flow to disadvantaged communities. [22]
How to Measure in U.S. Practice
Start with the same revenue record used for cost recovery. From there, isolate the share returned to community investors. Track returns monthly or quarterly through:
cash distributions
patronage refunds
dividend yield
equity value growth
Report the results annually to external stakeholders. [23]
PPAs and REC sales logs can help confirm how much revenue is available for member distributions. Tax and finance records should come into play only when federal incentives affect investor payouts.
Typical Data Sources
Data Source | What It Tracks |
|---|---|
Cap table, payout ledger, K-1s or member statements | Individual investor distributions and equity positions |
Audited financial reports | Verified revenue, expenses, and net returns available for distribution |
Community Benefits Plans (CBPs) and DOE Loan Program Office (LPO) annual reports | Benefit-sharing commitments and compliance [22] |
Power Purchase Agreements (PPAs) and REC sales logs | Revenue available for member distributions [23] |
11. Grid Resilience Benefits
Definition
Grid resilience benefits measure how a community energy project helps the local electric system withstand major disruptions and recover faster. Unlike reliability, which covers routine outages, resilience deals with storms, wildfires, heat waves, and other extreme events.[25]
For a community solar or microgrid project, that usually means keeping places like hospitals, fire stations, and emergency shelters powered when the main grid goes down. It can also mean fewer customers losing service, shorter outages, and steadier voltage when the system is under strain.
Why It Matters
Local projects can keep critical facilities running and put recovery choices closer to the community. That value often becomes clear only after the project is up and running. NREL estimates that expanded community solar could deliver $80 million–$240 million per year in resilience value nationwide, and that figure could climb to $1.3 billion–$3.8 billion with battery storage.[1][31]
Federal programs show how much weight this issue carries. DOE's Grid Resilience State and Tribal Formula Grants and the GRIP program back projects that help local grids stand up to major disruptions and recover faster after outages. Solar-plus-storage projects are also getting support through efforts such as RACER to prevent power disruptions and restore power during outages.[26][27] When teams track these gains, they have a stronger case for project spending, future funding, and value that goes beyond bill savings.
These resilience gains also feed into the broader impact calculations in the next KPI.
How to Measure in U.S. Practice
Start with the standard outage metrics used by utilities: SAIDI, SAIFI, CAIDI, and MED-SAIDI, comparing results before and after the project goes live.[29]
Metric | What It Measures |
|---|---|
SAIDI (System Average Interruption Duration Index) | Average outage minutes per customer per year |
SAIFI (System Average Interruption Frequency Index) | Average number of outages per customer per year |
CAIDI (Customer Average Interruption Duration Index) | Average outage duration for affected customers |
MED-SAIDI | SAIDI during Major Event Days, such as storms or disasters |
Those numbers are only part of the story. Teams should also track event-level results: how many hours the system operated in island mode during an outage, which critical facilities stayed powered, for how long, and how long it took to restore service to 50%, 90%, and 100% of customers. To put a dollar amount on avoided outages, apply the Value of Lost Load (VoLL), the method NREL uses to put a price on resilience benefits.[31]
This gives operators a plain, direct way to show whether resilience spending changed outage results in practice.
Typical Data Sources
Utility outage management systems (OMS) provide baseline SAIDI, SAIFI, and CAIDI figures. If available, AMI data can add time-stamped consumption and voltage information. Project-level SCADA or monitoring platforms record islanding events, storage dispatch, and load served during outages.[24][28]
DOE and state resilience program reports, especially for GRIP and formula grant recipients, can provide standardized before-and-after comparisons.[29][30] For critical facilities, microgrid controller logs paired with facility records can confirm hours of islanded operation and the amount of load served.
12. Social Return on Investment
Definition
Social Return on Investment (SROI) estimates the total social, environmental, and economic value a project creates against its full cost, in dollar terms where possible. It brings outcomes like lower utility bills, jobs, health gains, resilience, and carbon cuts into one ratio. Unlike standard financial ROI, which looks at cash flow and payback, SROI includes results that never appear in project revenue.[33][34][36][37]
The final result is usually shown as a ratio. An SROI of 3:1 means every $1 invested produced $3 in total stakeholder value.[35][36][37]
Why It Matters
Some of the biggest gains from a community energy project sit outside a normal finance model. Lower shutoff risk, fewer health harms, better emergency readiness, and local job gains matter a lot, but they can disappear if the only lens is revenue. SROI puts those gains in plain view through one summary number.
It also helps people with very different goals talk about the same project in the same terms. Utilities, city agencies, philanthropic funders, and community groups may all care about different outcomes. Kilowatt-hours alone won't settle the discussion. A solid SROI ratio, backed by clear assumptions, gives each group a shared way to judge whether the project lived up to its promises. Use SROI as a summary metric, not as a stand-in for the operational KPIs above.
SROI pulls the earlier metrics into one snapshot of total project value.
How to Measure in U.S. Practice
To turn that snapshot into a defensible ratio, begin with scope and stakeholders. Next, map outcomes through a theory of change that ties project activities to short-term and long-term results. After that, assign each outcome a measurable indicator and a dollar value based on U.S. benchmarks.
Step | What It Involves |
|---|---|
Map outcomes | Link activities to results such as lower bills, fewer shutoffs, better air quality, and stronger emergency preparedness |
Select indicators | Track energy burden (% of income), outage hours avoided, local jobs created, and asthma ER visits |
Assign dollar values | Apply EPA's Social Cost of Carbon, CDC/CMS health care cost data, HUD housing stability and eviction-related costs, and DOE/NREL outage cost estimates |
Adjust for attribution | Subtract benefits the project would have produced anyway and adjust for shared or fading benefits |
Calculate the ratio | Divide the present value of total benefits by the present value of total costs, using a public-sector discount rate |
When assumptions can swing the result, report a range instead of one headline figure. A sensitivity analysis that shows how the ratio changes under conservative and optimistic cases helps keep the work credible and defensible.
Typical Data Sources
Federal datasets provide most valuation inputs.[31][36][37] The EPA supplies the Social Cost of Carbon and air pollution damage estimates. CDC and CMS provide health care cost data. HUD covers housing stability and eviction-related costs. DOE and NREL provide outage cost estimates and distributed energy benefit frameworks.
Local sources help close the remaining gaps. Utility outage management systems, state health department records, and workforce agency data on wages and training completions can add local detail. Project records also matter: participant intake forms, bill assistance logs, and training completion rates help support updates over time.
That makes SROI a useful wrap-up measure before comparing all KPIs together.
How the Metrics Work Together
No single number can explain a community energy project on its own. Each metric shows one slice of performance. Put them together, though, and you get a much clearer picture of whether the project is doing its job and where to look when something starts to shift. The table below highlights pairings where one strong result can mask a weak one.
Uptime does not equal resilience. A project can show strong annual uptime and still fail during the outage that matters most. That’s the gap. Resilience needs event-based measures that a single availability percentage simply can’t show.
Cost recovery and bill savings pull in different directions. A project can cover its costs and still leave households with only thin monthly savings. That’s why both metrics belong on the same dashboard. One should not stand in for the other.[32][41]
Partner trust and complaint rates are early warning signs for technical and financial trouble. If trust drops, permitting can slow and participation can fall before the problem appears in revenue. If billing complaints jump, that often points to technical or financial strain before it reaches the financial statements.
These are the tradeoffs that come up most often.
Metric Pair | What Each Measures | Why Both Matter |
|---|---|---|
Uptime vs. Resilience | Uptime = normal operating availability; Resilience = performance during extreme events and recovery speed | High uptime can hide failure during blackouts or heat emergencies.[38][40][41] |
Cost Recovery vs. Bill Savings | Cost recovery = project costs covered; Bill savings = household benefit on monthly bills | A financially stable project may still deliver little value to participants.[32][41] |
Carbon Savings vs. Grid Resilience | Carbon savings = emissions displaced; Resilience = continuity of service during disruptions | A low-carbon system can still be fragile if it cannot island or support critical loads.[38][39][41] |
Investor Returns vs. SROI | Investor returns = payouts to owners; SROI = total community value | Community energy can create value that never appears in project accounts.[42][43] |
Use these metrics as a balanced scorecard across technical, economic, social, and carbon performance.
KPI Snapshot Table
Use the table below as the quick-read version of the 12 KPIs. Once you've looked at the metrics side by side, this snapshot helps turn that high-level view into something a team can use in regular reviews.
Use U.S. currency, number, and date formats throughout.
Metric | Unit | Reporting Frequency | Common Data Source |
|---|---|---|---|
Uptime | % (e.g., 99.5%) | Monthly | SCADA system, inverter/monitoring logs |
Energy Output | kWh/month or MWh/year | Monthly | Revenue-grade meters, utility interconnection data |
Cost Recovery | % of annual operating costs | Quarterly or annually | Project financial models, accounting systems |
Bill Savings | $/household/month | Quarterly | Utility billing records, pre-/post-bill comparisons |
Service Reach | Number of customers | Quarterly | Enrollment databases, program CRM records |
Partner Trust | Index score (0–100) | Annually or semi-annually | Stakeholder surveys, partner interviews |
Complaint Rates | Complaints per 1,000 customers/year | Monthly | Customer service logs, ticketing systems |
Local Skill Growth | Workers trained or certified per year | Quarterly or annually | Training provider records, workforce program databases |
Carbon Savings | Metric tons CO₂e/year | Annually | U.S. EPA emission factors, GHG inventory spreadsheets |
Community Investor Returns | Annual return (%) or distributions ($) | Annually | Project financial statements, co-op accounting records |
Grid Resilience Benefits | Outage hours avoided per year; critical facilities served | Annually, plus after major events | Utility outage records, microgrid performance logs |
Social Return on Investment (SROI) | Ratio (e.g., 3.5:1) | Every 2–3 years | Community surveys, program datasets, SROI evaluation reports |
A simple rhythm works well here: track uptime, output, and complaints monthly. Review most of the other metrics quarterly or once a year. Refresh SROI every 2–3 years, since that kind of analysis usually takes more time and deeper community input.
Using Metrics to Guide Community Energy Decisions
Once you have the KPI snapshot, the job shifts from measuring to deciding. Think of that snapshot as an operating dashboard. When data starts coming in on a steady basis, it should shape day-to-day choices, budget talks, and expansion plans. Each metric should tie back to a clear decision so teams can step in before small issues turn into bigger ones.
Maintenance is usually the first and most direct use case. If uptime drops while complaint rates rise, that pattern can signal equipment or interconnection trouble that needs inspection before the issue spreads. Energy output adds another clue. When output falls without a matching drop in sunlight or wind, the likely causes are soiling, component wear, or control problems. A monthly or quarterly review helps teams turn those trends into work orders early, instead of waiting for a full failure.
On the financial and equity side, cost recovery, bill savings, and service reach make the clearest picture when viewed together. If cost recovery looks healthy but households still are not seeing meaningful savings, that points to a need to revisit the tariff structure, subscription size, or credit rate. If service reach shows that low-income households or certain neighborhoods are underrepresented, the problem may sit in eligibility rules or outreach efforts. Folding these checks into the annual budget cycle helps keep the program financially sound while staying focused on who it is meant to serve.
For workforce planning, local hiring share and retention can reveal where training pipelines are falling short. If only a small share of technical roles goes to community members, that is a direct signal to build deeper ties with local community colleges, trade schools, or apprenticeship programs. Wage data matters too. Comparing pay with the local living wage shows whether training is leading to steady careers and gives teams a concrete way to show economic impact.
For expansion decisions, it helps to read energy output, carbon savings, and grid resilience data side by side. A project that delivers strong output on a steady basis, keeps power flowing to essential facilities during outages, and cuts metric tons of CO₂e each year makes a strong case for replication. When those metrics are mapped by location, planners can see where a second or third project is most likely to deliver the best combined return for the community.
Used together in dashboards and regular governance routines, these metrics help local teams spot tradeoffs early and make sharper calls about where to invest next.
Conclusion
A community energy project can hit its production goals and still fall short. If low-income households see only small savings, complaint rates climb, or local skill-building barely moves, the project hasn’t done the whole job.
That’s why these 12 metrics matter. The main question isn’t just how much power the project produced. It’s how well the project served people, supported the grid, and cut climate harm.
Taken together, these indicators show the bigger picture: reliability, financial health, inclusion, trust, climate impact, owner returns, and community value. No single metric can tell that whole story.
Review all 12 at least once a year. Use them to catch trouble early, fix what’s off track, and scale what’s working. Measurement turns community values into day-to-day results - and helps keep the project tied to reliability, resilience, shared prosperity, and fair outcomes.
FAQs
Which KPI should we track first?
Track the KPI that lines up most closely with your project goals and what your stakeholders care about most.
Start with a baseline assessment of current performance, such as an energy audit or a greenhouse gas emissions measurement. From there, use the SMART framework so the metric is specific, measurable, attainable, relevant, and timely.
How do these metrics apply to low-income communities?
In low-income communities, these metrics show whether a project is making day-to-day life easier or just sounding good on paper. Measures like bill savings and service reach track direct financial relief, including lower utility costs and energy subsidies that put money back into household budgets.
Metrics such as partner trust, complaint rates, and local skill growth help keep projects accountable and responsive to what residents actually need. They also show whether the work is building long-term community gains instead of short-term wins.
How often should a community energy project review its KPIs?
Community energy projects need to review KPIs on a regular basis to stay accountable, see what’s working, and adjust course when needed. For most teams, quarterly or biannual reviews are a solid fit.
Not every metric moves on the same schedule, though. Timeline and cost-savings data can often be tracked continuously or checked at key milestones. Relationship-based metrics usually make more sense through quarterly or semiannual surveys, since trust, satisfaction, and partnership health tend to show up over time rather than all at once.
Related Blog Posts
Latest Articles
©2026

Narrative Change and Power Building: The Missing Half of Advocacy
Narrative change is the process of disrupting dominant narratives that normalize inequity and advancing new narratives from historically marginalized communities.

Funding Resilience Without Federal Grants
BRIC is unreliable and FEMA is shrinking. Here's how cities fund climate resilience with dedicated revenue, blended finance, and a coordinating authority.

The ESG Blind Spot: How AI Is Finding Risks in Companies Nobody Else Is Watching
Norway's sovereign wealth fund uses AI to screen 7,200 portfolio companies for forced labor and corruption within 24 hours. The real story is the emerging-market coverage gap that traditional ESG data vendors miss — and what it means for any company with a global supply chain.
Narrative Change and Power Building: The Missing Half of Advocacy
Narrative change is the process of disrupting dominant narratives that normalize inequity and advancing new narratives from historically marginalized communities.
Funding Resilience Without Federal Grants
BRIC is unreliable and FEMA is shrinking. Here's how cities fund climate resilience with dedicated revenue, blended finance, and a coordinating authority.
The ESG Blind Spot: How AI Is Finding Risks in Companies Nobody Else Is Watching
Norway's sovereign wealth fund uses AI to screen 7,200 portfolio companies for forced labor and corruption within 24 hours. The real story is the emerging-market coverage gap that traditional ESG data vendors miss — and what it means for any company with a global supply chain.
FAQ
01
What does it really mean to “redefine profit”?
02
What makes Council Fire different?
03
Who does Council Fire work with?
04
What does working with Council Fire actually look like?
05
How does Council Fire help organizations turn big goals into action?
06
How does Council Fire define and measure success?
07
How does technology fit into Council Fire’s work?
Sep 21, 2026
Community Energy Metrics: 12 Key Measures
Sustainability Strategy
In This Article
A practical scorecard of 12 KPIs to judge whether community energy projects truly deliver reliability, savings, equity, and resilience.
Community Energy Metrics: 12 Key Measures
If you only track power output, you can miss the point. After launch, a community energy project should be judged on 12 measures: uptime, energy output, cost recovery, bill savings, service reach, partner trust, complaint rates, local skill growth, carbon savings, community investor returns, grid resilience benefits, and social return on investment.
I’d sum it up this way: you need to know if the project stays online, pays its bills, cuts household costs, reaches the right people, keeps support, builds local jobs, lowers CO₂e, shares returns, and holds up during outages. The article also shows where projects often fall short, like strong cost recovery with weak bill savings or high uptime that still fails during storms.
Here’s the quick view:
Technical: uptime, energy output, resilience
Financial: cost recovery, bill savings, investor returns
Community: service reach, trust, complaint rates, skill growth
Climate and total impact: carbon savings, SROI
KPI | What it answers |
|---|---|
Uptime | Is the system available when needed? |
Energy Output | How much power did it deliver? |
Cost Recovery | Does revenue cover costs and debt? |
Bill Savings | Are households paying less? |
Service Reach | Who is getting the project’s gains? |
Partner Trust | Do local partners still back the project? |
Complaint Rates | Are billing or service problems growing? |
Local Skill Growth | Are local residents getting jobs and training? |
Carbon Savings | How much CO₂e did the project avoid? |
Community Investor Returns | Are local owners getting paid? |
Grid Resilience Benefits | Did the project help during outages and extreme events? |
SROI | What is the total social and economic value per $1 spent? |
Bottom line: I’d use these 12 KPIs as one scorecard, not as stand-alone numbers, because a project can look strong in one area and still miss its community mission.
12 Community Energy KPIs: A Complete Performance Scorecard
Energizing Rural Communities Prize: SMART Goals & Metrics Development
Why These Metrics Matter After Launch
Once a project goes live, the job changes. The focus moves from delivery to performance. Finishing a community energy project on schedule and on budget is a clear win. But the harder test comes after launch, across the full operating life of the project. That’s where most of the upside - or most of the risk - shows up.
A project can hit its construction targets and still fall short of its promise to the community. It may produce less power than expected, leave low-income households out of meaningful savings, or chip away at trust through billing problems and weak communication. That’s why it’s not enough to ask whether the project was built. You have to measure what it keeps delivering over time.
These five dimensions frame the 12 metrics below.
Dimension | What It Reveals |
|---|---|
Reliability | Is the system staying online when people need it most? |
Financial durability | Are revenues covering costs without constant subsidies? |
Social acceptance | Do residents feel the project is fair and well-run? |
Equity | Are low-income households and underserved groups genuinely included? |
Long-term value | Is the project creating jobs, cutting emissions, and strengthening the grid? |
A project can be technically sound and still miss its community mission if trust, reach, or equity start to slip.
1. Uptime
Definition
Uptime is the share of time a community energy system is available to generate power or deliver service during a review period, excluding approved planned outages. In solar and battery projects, that means the hours when the system is online and working as intended. In a district energy system, it means the hours when the system meets its set service levels, such as temperature and flow rate.
The formula is simple: (total hours - unplanned downtime hours) ÷ total hours × 100. It gives teams a clear baseline they can use month after month or year after year.
Why It Matters
After launch, uptime is often the first number people check. It tells you, in plain terms, whether the system is there when it’s supposed to be. If availability slips, energy delivery slips with it. So do savings and revenue.
Even a small drop can have a material effect on output and project performance. It can also chip away at stakeholder trust. That’s why uptime comes before almost every other operating or financial metric.
How to Measure in U.S. Practice
In most U.S. projects, teams use 15-minute or hourly interval data. Intervals that fall below a set production threshold are marked as unavailable. That matters because it keeps normal low production from being mistaken for an outage.
When you need a closer look at lost output, use energy-weighted availability. A midday outage usually costs far more than a nighttime outage, so this method gives a fairer picture of what the project lost.
Typical Data Sources
Common sources include:
Inverter logs
Revenue meters
Maintenance logs
Utility outage records
Once uptime is stable, the next question is how much energy the project actually produces.
2. Energy Output
Definition
Energy output is the total usable electricity a community energy system produces over a set period, usually tracked in kilowatt-hours (kWh) or megawatt-hours (MWh). In the U.S., most projects log output daily, monthly, and annually. For financial and emissions reporting, annual output is usually the main number people look at.
It’s worth drawing a clean line here: energy output is not the same as installed capacity. Installed capacity tells you the size of the system. Energy output tells you how much electricity the system actually delivered over time.
Why It Matters
If uptime tells you the system was available, output tells you what it actually produced. That makes output the core number behind savings, revenue, and emissions reporting.
This is where the project starts to prove its value in plain terms:
Bill savings come from electricity produced.
Cost recovery depends on electricity produced.
Carbon estimates depend on electricity produced.
Revenue from power sales and bill credits follows electricity produced.
When output falls below projection, the ripple effect is immediate. Savings drop. Revenue comes in lower than expected. Carbon benefits shrink too.
How to Measure in U.S. Practice
In day-to-day U.S. project operations, the starting point is the revenue-grade meter at the point of interconnection. That meter is the source used for billing and utility credit calculations, so it serves as the main reference point. From there, operators usually rely on SCADA or inverter monitoring to collect 15-minute or hourly data and see how the system is performing across the day.
To judge whether the system is doing what it should, compare actual monthly and annual kWh against pre-construction energy yield models. Tools like NREL's PVWatts are common benchmarks for that check. If the gap between projected and actual output sticks around, it often points to a real issue such as equipment trouble, shading, soiling, or grid constraints.
Use the meter as the source of truth. Use monitoring tools to explain why the numbers moved.
Typical Data Sources
Source | What It Provides |
|---|---|
Revenue-grade meter (utility) | Authoritative kWh delivered; basis for billing and credits |
SCADA / inverter monitoring | Interval data; helps flag curtailment, outages, and production drops |
Inverter and equipment logs | Cross-check for meter data; records outages and curtailment |
Energy yield models (e.g., PVWatts) | Pre-construction benchmarks for variance analysis |
State program reporting platforms | Regulatory generation records; additional audit trail |
Reconciling utility and SCADA data gives operators a defensible output record for reporting and oversight. That record then serves as the baseline for cost recovery, savings, and carbon reporting.
3. Cost Recovery
Definition
Cost recovery is the rate at which a project's revenues cover its ongoing operating costs. In plain terms, it shows whether the money coming in is enough to pay for day-to-day expenses and debt service. That revenue can come from energy sales, subscriber payments, RECs, incentives, or tariffs. Costs usually include O&M, insurance, leases, administration, and debt service.
Why It Matters
Cost recovery sits at the point where system performance meets financial reality. If a project has strong uptime and good output, revenue should follow. When that doesn’t happen, the warning signs show up fast: maintenance gets pushed back, uptime slips, and confidence in the project starts to erode.
In community projects, the impact can hit residents directly. A shortfall may lead to higher tariffs or cuts in service. Lenders watch this closely as well, especially through DSCR, and many want to see at least 1.2 to 1.3.
How to Measure in U.S. Practice
In U.S. practice, teams usually track two KPIs each year:
Operating Cost Recovery Ratio = total revenues ÷ total operating costs
DSCR = net operating income ÷ annual debt service
Use recurring project revenue only. That means no one-time grants and no pilot subsidies in the calculation. The goal is to see whether the project can stand on its own, month after month, not just look good on paper for a single year.
For community solar, NREL benchmarks place annual O&M and subscriber management costs at about $39.83–$40.51 per kWdc [2][3]. That gives teams a grounded cost target when they review project performance.
If the project can cover its costs, the next thing to check is whether those savings are reaching participants.
Typical Data Sources
Source | What It Tracks | Who Holds It |
|---|---|---|
Project financial statements | Revenue, expenses, debt service, cash flow | Developer, municipal finance office, or SPE |
Utility billing and metering records | kWh exported, net metering credits, time-of-use revenue | Interconnecting utility |
Subscriber/CRM platform | Subscription levels, payment history, churn rate | Program administrator |
Contracts and incentive documents | PPA terms, REC sale agreements, incentive award letters | Developer or project sponsor |
O&M and vendor invoices | Actual maintenance and service costs | Project operator |
Good cost recovery analysis depends on clean, reconciled data across these sources. If the numbers from billing, finance, and operations don’t line up, the results can get shaky fast. Projects that set up data-sharing agreements with utility partners early usually have a much easier time producing reliable financial reports, especially when they’re seeking added funding or refinancing.
Once cost recovery is stable, the next question is whether households are seeing lower bills.
4. Bill Savings
Definition
Bill savings is the net drop in a participant's total electricity cost after credits and fees. The key is to measure savings against the full utility bill, not just supply charges. A deal may look good on paper, but fixed fees can wipe out much of the gain. Savings are usually shown as a monthly dollar amount, a percentage off the total bill, or a projected lifetime figure across the contract term.
Why It Matters
Cost recovery shows whether a project can keep going. Bill savings show whether it is helping households in a way they can feel. People notice one thing first: Did my bill go down?
For low- and moderate-income (LMI) households, lower power bills can ease energy burden, which can support housing stability, health, and climate resilience. Typical community solar subscribers save 5%–15%. Income-qualified programs often aim for 20% or more. [1][4][5]
How to Measure in U.S. Practice
The basic formula is simple: baseline bill minus post-enrollment bill, after credits and fees. In the field, teams usually compare 12 months of pre- and post-enrollment bills so seasonal swings do not distort the result.
It also helps to track kWh credits and dollar savings as separate measures. Why? Because the final bill is shaped by more than energy use alone. Rate changes, fixed charges, and program fees can all change what a household actually pays.
When rates shift, the cleanest approach is to compare the actual post-enrollment cost with a modeled cost under current tariffs.
Typical Data Sources
Source | What It Tracks |
|---|---|
Utility billing records | Pre- and post-enrollment charges, credits, and usage (kWh) |
Subscription or crediting system | Credits applied, discount rates, and program fees per customer |
Rate schedules and tariff filings | Current and historical rates and fees |
Smart meter / interval data | Consumption patterns for normalizing savings across seasons |
Regulatory filings or independent evaluations | Program-level savings validation and methodology benchmarks |
Consolidated billing, where credits and charges appear on one statement, makes savings much easier to check. Separate statements often lead to confusion and complaints. [5][6]
Once participant savings are clear, the next question is how widely those benefits reach.
5. Service Reach
Definition
Service reach shows how far a project's benefits actually spread. It should cover both active participants - like enrolled subscribers or tariff customers - and people who aren't enrolled but still may get better reliability or cleaner air.
Why It Matters
Bill savings only matter if the households meant to benefit can get through the door. Bill savings tell you how much participants gain. Service reach tells you who gets that gain. As of December 2022, LMI community solar accounted for only about 2% of the U.S. market. [7]
Federal frameworks like Justice40, along with state community solar rules, more and more call for a meaningful share of benefits to go to low-income and disadvantaged communities. If you don't track service reach, you can't tell whether that is happening.
How to Measure in U.S. Practice
Measure reach at both the household and neighborhood level. A common approach is to map participant addresses to census tracts using GIS. From there, teams can pull demographic data from the American Community Survey and flag participants in disadvantaged communities with tools like EPA's EJScreen or the federal Climate and Economic Justice Screening Tool.
The core questions are simple:
Who participated?
Who qualified but did not enroll?
Where did each group live?
A report might show 750 residential customers, with 52% low-income, along with 20 small businesses and 5 critical facilities across 12 census tracts. It might also show that 65% of participants live in disadvantaged communities.
Another metric worth watching is the gap between eligible and enrolled households. In plain terms, this is the share of customers in the project's footprint who qualify but still haven't signed up. That gap often points straight to trouble spots in outreach or program design.
Typical Data Sources
Source | What It Tracks |
|---|---|
Utility customer information systems (CIS) | Addresses, rate classes, enrollment status, usage history |
U.S. Census Bureau / American Community Survey | Income, race/ethnicity, housing type by census tract |
Tract-level energy burden, household counts, median income | |
EPA EJScreen / Climate and Economic Justice Screening Tool | Disadvantaged community designations for geographic targeting |
Program enrollment databases (LIHEAP, housing authorities) | Low-income status verification for eligible participants |
Community surveys | Lived experience, barriers to enrollment, gaps in outreach |
Illinois' Solar For All program gives a good example of what this looks like when the data gets specific. In Program Year 5, 64% of community solar participants were renters, compared with 33% statewide. 57% were Black or African American, compared with 14% statewide. And 13% of subscribers lived in high energy burden areas. [8][9]
That level of detail helps answer a basic but important question: is the project reaching priority households, or is it just filling seats?
Reach data can also show whether a program is building support, not just enrollment. The next step is to see whether participants trust the program enough to stay involved.
6. Partner Trust
Definition
Partner trust is the confidence that local governments, utilities, nonprofits, funders, and technical partners have in a project's leadership to keep commitments, manage risk openly, and act in the community's interest (competence, integrity, and good faith). [10][12]
Why It Matters
Once service reach grows, the project has to keep a lot of parties moving in the same direction. Trust makes that possible. It helps when terms need to be revisited, supports co-investment, and gives lenders and regulators confidence that the project can be counted on. If a model is meant to spread to other places, trust often decides whether growth holds up or starts to crack.
In places with a long record of underinvestment, this carries extra weight. Trust can shape whether residents and local institutions view the project as a community asset or as one more version of past damage.
How to Measure in U.S. Practice
In U.S. practice, trust is usually tracked through a mix of partner surveys and behavior data. Surveys ask partners to score transparency, fairness, and responsiveness on a 1–5 scale. Those scores are then tracked quarterly or once a year by partner type, such as utility, local government, or nonprofit. Behavioral signs include governance meeting attendance, MOU and PPA renewal rates, and response times for data requests. [13][11]
Confidential third-party surveys tend to get more candid feedback. Public support during council meetings or regulatory hearings is also a strong signal that trust is holding. [14]
Typical Data Sources
Source | What It Tracks |
|---|---|
Partner surveys administered by a third party | Perceived transparency, competence, fairness, and responsiveness |
Governance meeting attendance logs | Participation rates and consistency of engagement |
MOU / PPA / community benefit agreement records | Initial commitments, renewals, amendments, and disputes |
Grievance resolution logs | Issue type, closure time, and escalation patterns |
Public statements and regulatory filings | Testimony, press releases, and commission comments |
When trust slips, complaints tend to climb. The next metric looks at that directly.
7. Complaint Rates
When partner trust tells you how the relationship feels, complaint rate shows what happens when that relationship gets tested.
Definition
Complaint rate is the number of documented complaints from customers or residents per 1,000 active customers over a set period. That includes complaints logged through customer service, local government, regulators, and public meetings. It helps to sort them into clear groups: billing, outages, enrollment, equipment, service quality, and fairness. Routine questions should not be counted.
Why It Matters
Complaint rate works like an early warning signal. If complaints jump right after a tariff change or a billing update, the root cause is often a communication gap rather than a system failure. In plain terms, people may not be confused by the service itself - they may be confused by how it was explained.
This data can also reveal fairness problems that uptime and output numbers may miss. If billing complaints cluster within one group, such as low-income or underserved participants, that points to a program design issue. It is not just a customer service problem sitting in a queue.
Public complaint tracking also shows whether the project responds in a prompt and fair way. That makes complaint tracking a quick way to find trouble in billing, enrollment, or service delivery before it spreads.
How to Measure in U.S. Practice
The formula is straightforward:
Complaint Rate = Number of complaints in period ÷ Number of active customer accounts
In U.S. practice, teams usually track complaints per 1,000 customers each month or each year. From there, the numbers should be broken out by complaint type and customer segment. Complaint volume on its own only tells part of the story, so pair it with resolution time to show whether the program is actually responding.
Typical Data Sources
Source | What It Tracks |
|---|---|
CRM or ticketing systems | Complaint volume, category, severity, and resolution status |
Call center and IVR logs | Call volumes, call reasons, and outcomes |
State PUC or consumer protection databases | Escalated complaints filed externally |
Local government and community engagement records | Complaints surfaced through civic channels, public meetings, or surveys |
Using more than one source matters because not every complaint gets logged in the same place. A complaint known to the city's 311 system but missing from the project operator's records still says something important about program performance.
When the same complaints keep showing up, the next issue is hard to ignore: whether local staffing and training are strong enough to fix them.
8. Local Skill Growth
After complaint rates, the next thing to look at is whether the project is helping local people build the skills to fix problems fast and keep the system running year after year.
Definition
Local skill growth measures how a community energy project helps local residents gain clean energy jobs and recognized credentials.
Why It Matters
When repair know-how stays close to the project, uptime tends to improve. Issues can be handled faster, and complaint resolution doesn't depend as much on outside crews. There's also a bigger social payoff here: projects can open steady career paths for residents who have often been left out of past energy investment.
The labor market shows why this matters. U.S. clean energy employment grew by 142,000 jobs in 2023, a 4.2% increase, and solar jobs now appear in 79% of U.S. counties.[17][16][15]
How to Measure in U.S. Practice
Don't stop at training counts. A project may train plenty of people and still fall short if jobs don't follow, wages are weak, or workers leave after a few months. The better approach is to track both workforce development and job quality.
Core measures include:
Number of local residents trained
Share of local hires, including site technicians, customer service staff, outreach workers, and data monitors
Industry-recognized credentials, such as NABCEP certification or OSHA 30 training
12-month job placement rate in a clean energy role
Retention rates over time
Starting wages compared with the county median wage
Demographic breakdowns by ZIP code, race, gender, and income level to confirm benefits reach priority communities
Typical Data Sources
Source | What It Tracks |
|---|---|
Training provider records (community colleges, trade schools, union apprenticeship programs) | Enrollment, completion rates, credentials awarded |
Local workforce development boards and state labor departments | Job placements, wages, occupation codes, demographic data |
Project contractor payroll and HR records | Share of local hires, job-years created, wage levels |
Community-based organization program reports | Participant demographics, support service use, placement outcomes |
DOE U.S. Energy and Employment Report (USEER) | National and state clean energy job benchmarks for local comparison |
9. Carbon Savings
After output, the next question is climate impact.
Definition
Carbon savings measure the greenhouse gases a project avoids by replacing higher-emitting grid electricity. Results are reported in metric tons of CO₂-equivalent (CO₂e) per year. That gives leaders a clear way to turn delivered kWh into a climate result they can track over time.
Why It Matters
Quantified avoided emissions help communities track climate impact and support grant, investor, and philanthropic reporting. This KPI also serves as a gut check: is the project delivering the emissions reduction it promised at launch?
How to Measure in U.S. Practice
The core formula is:
Avoided emissions (metric tons CO₂e) = Energy generated (kWh) × Grid emissions factor (kg CO₂e/kWh) ÷ 1,000 [19]
Here’s a simple example. A 2 MW community solar array that produces 3,000,000 kWh per year in a region with a 0.4 kg CO₂e/kWh grid factor avoids about 1,200 metric tons of CO₂e each year.
Use a region-specific EPA eGRID factor, and note whether you are applying an average or marginal rate. That choice matters because regional factors can differ by 20%–50%. [20] Keep avoided emissions separate from Scope 1, 2, and 3 reporting so you don’t double count. [18][21] It also helps to stick with the same emissions method in each reporting period so year-over-year results stay comparable.
Typical Data Sources
Use these sources to calculate and verify avoided emissions.
Source | What It Provides |
|---|---|
EPA eGRID | Regional CO₂e/kWh factors by subregion and balancing authority |
EPA & EIA fuel emissions factors | CO₂e per unit of natural gas, heating oil, diesel, and propane |
Meter/inverter data | Verified AC output (kWh) for solar; consumption data for efficiency projects |
Utility interval data and EM&V reports | Customer-level consumption, pre/post comparisons, program-verified savings |
ISO/RTO and state agencies | Marginal emissions rates, grid mix trends, regional decarbonization trajectories |
Plain-language carbon equivalents |
10. Community Investor Returns
After carbon savings, the next issue is simple: do local investors share in the money the project makes?
Definition
Community investor returns are the cash and in-kind benefits paid to local investors, members, or stakeholder owners over the project life. This metric shows whether ownership leads to actual payouts, not just good intentions.
Why It Matters
This metric makes it easier to see whether residents, workers, and local stakeholders are getting measurable value from the project, not just a seat at the table. That distinction matters. A project can talk a lot about shared ownership, but if no money or material benefit reaches the people involved, the promise falls flat.
For federally funded projects, Justice40 puts benefit-sharing near the center of performance. It requires that 40% of overall benefits from federal climate and energy investments flow to disadvantaged communities. [22]
How to Measure in U.S. Practice
Start with the same revenue record used for cost recovery. From there, isolate the share returned to community investors. Track returns monthly or quarterly through:
cash distributions
patronage refunds
dividend yield
equity value growth
Report the results annually to external stakeholders. [23]
PPAs and REC sales logs can help confirm how much revenue is available for member distributions. Tax and finance records should come into play only when federal incentives affect investor payouts.
Typical Data Sources
Data Source | What It Tracks |
|---|---|
Cap table, payout ledger, K-1s or member statements | Individual investor distributions and equity positions |
Audited financial reports | Verified revenue, expenses, and net returns available for distribution |
Community Benefits Plans (CBPs) and DOE Loan Program Office (LPO) annual reports | Benefit-sharing commitments and compliance [22] |
Power Purchase Agreements (PPAs) and REC sales logs | Revenue available for member distributions [23] |
11. Grid Resilience Benefits
Definition
Grid resilience benefits measure how a community energy project helps the local electric system withstand major disruptions and recover faster. Unlike reliability, which covers routine outages, resilience deals with storms, wildfires, heat waves, and other extreme events.[25]
For a community solar or microgrid project, that usually means keeping places like hospitals, fire stations, and emergency shelters powered when the main grid goes down. It can also mean fewer customers losing service, shorter outages, and steadier voltage when the system is under strain.
Why It Matters
Local projects can keep critical facilities running and put recovery choices closer to the community. That value often becomes clear only after the project is up and running. NREL estimates that expanded community solar could deliver $80 million–$240 million per year in resilience value nationwide, and that figure could climb to $1.3 billion–$3.8 billion with battery storage.[1][31]
Federal programs show how much weight this issue carries. DOE's Grid Resilience State and Tribal Formula Grants and the GRIP program back projects that help local grids stand up to major disruptions and recover faster after outages. Solar-plus-storage projects are also getting support through efforts such as RACER to prevent power disruptions and restore power during outages.[26][27] When teams track these gains, they have a stronger case for project spending, future funding, and value that goes beyond bill savings.
These resilience gains also feed into the broader impact calculations in the next KPI.
How to Measure in U.S. Practice
Start with the standard outage metrics used by utilities: SAIDI, SAIFI, CAIDI, and MED-SAIDI, comparing results before and after the project goes live.[29]
Metric | What It Measures |
|---|---|
SAIDI (System Average Interruption Duration Index) | Average outage minutes per customer per year |
SAIFI (System Average Interruption Frequency Index) | Average number of outages per customer per year |
CAIDI (Customer Average Interruption Duration Index) | Average outage duration for affected customers |
MED-SAIDI | SAIDI during Major Event Days, such as storms or disasters |
Those numbers are only part of the story. Teams should also track event-level results: how many hours the system operated in island mode during an outage, which critical facilities stayed powered, for how long, and how long it took to restore service to 50%, 90%, and 100% of customers. To put a dollar amount on avoided outages, apply the Value of Lost Load (VoLL), the method NREL uses to put a price on resilience benefits.[31]
This gives operators a plain, direct way to show whether resilience spending changed outage results in practice.
Typical Data Sources
Utility outage management systems (OMS) provide baseline SAIDI, SAIFI, and CAIDI figures. If available, AMI data can add time-stamped consumption and voltage information. Project-level SCADA or monitoring platforms record islanding events, storage dispatch, and load served during outages.[24][28]
DOE and state resilience program reports, especially for GRIP and formula grant recipients, can provide standardized before-and-after comparisons.[29][30] For critical facilities, microgrid controller logs paired with facility records can confirm hours of islanded operation and the amount of load served.
12. Social Return on Investment
Definition
Social Return on Investment (SROI) estimates the total social, environmental, and economic value a project creates against its full cost, in dollar terms where possible. It brings outcomes like lower utility bills, jobs, health gains, resilience, and carbon cuts into one ratio. Unlike standard financial ROI, which looks at cash flow and payback, SROI includes results that never appear in project revenue.[33][34][36][37]
The final result is usually shown as a ratio. An SROI of 3:1 means every $1 invested produced $3 in total stakeholder value.[35][36][37]
Why It Matters
Some of the biggest gains from a community energy project sit outside a normal finance model. Lower shutoff risk, fewer health harms, better emergency readiness, and local job gains matter a lot, but they can disappear if the only lens is revenue. SROI puts those gains in plain view through one summary number.
It also helps people with very different goals talk about the same project in the same terms. Utilities, city agencies, philanthropic funders, and community groups may all care about different outcomes. Kilowatt-hours alone won't settle the discussion. A solid SROI ratio, backed by clear assumptions, gives each group a shared way to judge whether the project lived up to its promises. Use SROI as a summary metric, not as a stand-in for the operational KPIs above.
SROI pulls the earlier metrics into one snapshot of total project value.
How to Measure in U.S. Practice
To turn that snapshot into a defensible ratio, begin with scope and stakeholders. Next, map outcomes through a theory of change that ties project activities to short-term and long-term results. After that, assign each outcome a measurable indicator and a dollar value based on U.S. benchmarks.
Step | What It Involves |
|---|---|
Map outcomes | Link activities to results such as lower bills, fewer shutoffs, better air quality, and stronger emergency preparedness |
Select indicators | Track energy burden (% of income), outage hours avoided, local jobs created, and asthma ER visits |
Assign dollar values | Apply EPA's Social Cost of Carbon, CDC/CMS health care cost data, HUD housing stability and eviction-related costs, and DOE/NREL outage cost estimates |
Adjust for attribution | Subtract benefits the project would have produced anyway and adjust for shared or fading benefits |
Calculate the ratio | Divide the present value of total benefits by the present value of total costs, using a public-sector discount rate |
When assumptions can swing the result, report a range instead of one headline figure. A sensitivity analysis that shows how the ratio changes under conservative and optimistic cases helps keep the work credible and defensible.
Typical Data Sources
Federal datasets provide most valuation inputs.[31][36][37] The EPA supplies the Social Cost of Carbon and air pollution damage estimates. CDC and CMS provide health care cost data. HUD covers housing stability and eviction-related costs. DOE and NREL provide outage cost estimates and distributed energy benefit frameworks.
Local sources help close the remaining gaps. Utility outage management systems, state health department records, and workforce agency data on wages and training completions can add local detail. Project records also matter: participant intake forms, bill assistance logs, and training completion rates help support updates over time.
That makes SROI a useful wrap-up measure before comparing all KPIs together.
How the Metrics Work Together
No single number can explain a community energy project on its own. Each metric shows one slice of performance. Put them together, though, and you get a much clearer picture of whether the project is doing its job and where to look when something starts to shift. The table below highlights pairings where one strong result can mask a weak one.
Uptime does not equal resilience. A project can show strong annual uptime and still fail during the outage that matters most. That’s the gap. Resilience needs event-based measures that a single availability percentage simply can’t show.
Cost recovery and bill savings pull in different directions. A project can cover its costs and still leave households with only thin monthly savings. That’s why both metrics belong on the same dashboard. One should not stand in for the other.[32][41]
Partner trust and complaint rates are early warning signs for technical and financial trouble. If trust drops, permitting can slow and participation can fall before the problem appears in revenue. If billing complaints jump, that often points to technical or financial strain before it reaches the financial statements.
These are the tradeoffs that come up most often.
Metric Pair | What Each Measures | Why Both Matter |
|---|---|---|
Uptime vs. Resilience | Uptime = normal operating availability; Resilience = performance during extreme events and recovery speed | High uptime can hide failure during blackouts or heat emergencies.[38][40][41] |
Cost Recovery vs. Bill Savings | Cost recovery = project costs covered; Bill savings = household benefit on monthly bills | A financially stable project may still deliver little value to participants.[32][41] |
Carbon Savings vs. Grid Resilience | Carbon savings = emissions displaced; Resilience = continuity of service during disruptions | A low-carbon system can still be fragile if it cannot island or support critical loads.[38][39][41] |
Investor Returns vs. SROI | Investor returns = payouts to owners; SROI = total community value | Community energy can create value that never appears in project accounts.[42][43] |
Use these metrics as a balanced scorecard across technical, economic, social, and carbon performance.
KPI Snapshot Table
Use the table below as the quick-read version of the 12 KPIs. Once you've looked at the metrics side by side, this snapshot helps turn that high-level view into something a team can use in regular reviews.
Use U.S. currency, number, and date formats throughout.
Metric | Unit | Reporting Frequency | Common Data Source |
|---|---|---|---|
Uptime | % (e.g., 99.5%) | Monthly | SCADA system, inverter/monitoring logs |
Energy Output | kWh/month or MWh/year | Monthly | Revenue-grade meters, utility interconnection data |
Cost Recovery | % of annual operating costs | Quarterly or annually | Project financial models, accounting systems |
Bill Savings | $/household/month | Quarterly | Utility billing records, pre-/post-bill comparisons |
Service Reach | Number of customers | Quarterly | Enrollment databases, program CRM records |
Partner Trust | Index score (0–100) | Annually or semi-annually | Stakeholder surveys, partner interviews |
Complaint Rates | Complaints per 1,000 customers/year | Monthly | Customer service logs, ticketing systems |
Local Skill Growth | Workers trained or certified per year | Quarterly or annually | Training provider records, workforce program databases |
Carbon Savings | Metric tons CO₂e/year | Annually | U.S. EPA emission factors, GHG inventory spreadsheets |
Community Investor Returns | Annual return (%) or distributions ($) | Annually | Project financial statements, co-op accounting records |
Grid Resilience Benefits | Outage hours avoided per year; critical facilities served | Annually, plus after major events | Utility outage records, microgrid performance logs |
Social Return on Investment (SROI) | Ratio (e.g., 3.5:1) | Every 2–3 years | Community surveys, program datasets, SROI evaluation reports |
A simple rhythm works well here: track uptime, output, and complaints monthly. Review most of the other metrics quarterly or once a year. Refresh SROI every 2–3 years, since that kind of analysis usually takes more time and deeper community input.
Using Metrics to Guide Community Energy Decisions
Once you have the KPI snapshot, the job shifts from measuring to deciding. Think of that snapshot as an operating dashboard. When data starts coming in on a steady basis, it should shape day-to-day choices, budget talks, and expansion plans. Each metric should tie back to a clear decision so teams can step in before small issues turn into bigger ones.
Maintenance is usually the first and most direct use case. If uptime drops while complaint rates rise, that pattern can signal equipment or interconnection trouble that needs inspection before the issue spreads. Energy output adds another clue. When output falls without a matching drop in sunlight or wind, the likely causes are soiling, component wear, or control problems. A monthly or quarterly review helps teams turn those trends into work orders early, instead of waiting for a full failure.
On the financial and equity side, cost recovery, bill savings, and service reach make the clearest picture when viewed together. If cost recovery looks healthy but households still are not seeing meaningful savings, that points to a need to revisit the tariff structure, subscription size, or credit rate. If service reach shows that low-income households or certain neighborhoods are underrepresented, the problem may sit in eligibility rules or outreach efforts. Folding these checks into the annual budget cycle helps keep the program financially sound while staying focused on who it is meant to serve.
For workforce planning, local hiring share and retention can reveal where training pipelines are falling short. If only a small share of technical roles goes to community members, that is a direct signal to build deeper ties with local community colleges, trade schools, or apprenticeship programs. Wage data matters too. Comparing pay with the local living wage shows whether training is leading to steady careers and gives teams a concrete way to show economic impact.
For expansion decisions, it helps to read energy output, carbon savings, and grid resilience data side by side. A project that delivers strong output on a steady basis, keeps power flowing to essential facilities during outages, and cuts metric tons of CO₂e each year makes a strong case for replication. When those metrics are mapped by location, planners can see where a second or third project is most likely to deliver the best combined return for the community.
Used together in dashboards and regular governance routines, these metrics help local teams spot tradeoffs early and make sharper calls about where to invest next.
Conclusion
A community energy project can hit its production goals and still fall short. If low-income households see only small savings, complaint rates climb, or local skill-building barely moves, the project hasn’t done the whole job.
That’s why these 12 metrics matter. The main question isn’t just how much power the project produced. It’s how well the project served people, supported the grid, and cut climate harm.
Taken together, these indicators show the bigger picture: reliability, financial health, inclusion, trust, climate impact, owner returns, and community value. No single metric can tell that whole story.
Review all 12 at least once a year. Use them to catch trouble early, fix what’s off track, and scale what’s working. Measurement turns community values into day-to-day results - and helps keep the project tied to reliability, resilience, shared prosperity, and fair outcomes.
FAQs
Which KPI should we track first?
Track the KPI that lines up most closely with your project goals and what your stakeholders care about most.
Start with a baseline assessment of current performance, such as an energy audit or a greenhouse gas emissions measurement. From there, use the SMART framework so the metric is specific, measurable, attainable, relevant, and timely.
How do these metrics apply to low-income communities?
In low-income communities, these metrics show whether a project is making day-to-day life easier or just sounding good on paper. Measures like bill savings and service reach track direct financial relief, including lower utility costs and energy subsidies that put money back into household budgets.
Metrics such as partner trust, complaint rates, and local skill growth help keep projects accountable and responsive to what residents actually need. They also show whether the work is building long-term community gains instead of short-term wins.
How often should a community energy project review its KPIs?
Community energy projects need to review KPIs on a regular basis to stay accountable, see what’s working, and adjust course when needed. For most teams, quarterly or biannual reviews are a solid fit.
Not every metric moves on the same schedule, though. Timeline and cost-savings data can often be tracked continuously or checked at key milestones. Relationship-based metrics usually make more sense through quarterly or semiannual surveys, since trust, satisfaction, and partnership health tend to show up over time rather than all at once.
Related Blog Posts
Latest Articles
©2026
Narrative Change and Power Building: The Missing Half of Advocacy
Narrative change is the process of disrupting dominant narratives that normalize inequity and advancing new narratives from historically marginalized communities.
Funding Resilience Without Federal Grants
BRIC is unreliable and FEMA is shrinking. Here's how cities fund climate resilience with dedicated revenue, blended finance, and a coordinating authority.
The ESG Blind Spot: How AI Is Finding Risks in Companies Nobody Else Is Watching
Norway's sovereign wealth fund uses AI to screen 7,200 portfolio companies for forced labor and corruption within 24 hours. The real story is the emerging-market coverage gap that traditional ESG data vendors miss — and what it means for any company with a global supply chain.
FAQ
What does it really mean to “redefine profit”?
What makes Council Fire different?
Who does Council Fire work with?
What does working with Council Fire actually look like?
How does Council Fire help organizations turn big goals into action?
How does Council Fire define and measure success?
How does technology fit into Council Fire’s work?