
Sep 21, 2026
ESG Risk Assessment Through Scenario Analysis
ESG Strategy
In This Article
Use 3–4 decision-focused scenarios to test how climate, policy, and social shifts affect cash flow, assets, CapEx, and capital plans.
ESG Risk Assessment Through Scenario Analysis
If you only look backward, you miss the ESG risks most likely to hit next. I’d sum up the article this way: scenario analysis helps me test how policy shifts, climate events, labor issues, and governance failures could change cash flow, asset values, costs, and capital plans across the next 1 to 30+ years.
Here’s the core takeaway in plain English:
I start with a decision, not a report.
I define scope, time horizon, and owners up front.
I use 3 to 4 scenarios: baseline, adverse, and compound stress cases.
I connect each scenario to financial effects like revenue, CapEx, downtime, insurance, and cost of capital.
I turn results into board actions, project choices, and funded risk responses.
A few facts stand out:
Near-term risk reviews often miss slow-building ESG threats that show up over 5, 10, or 20 years.
A sample scenario in the article includes 50% higher insurance premiums, a $150 per metric ton carbon price by 2035, and 25% higher retail power prices.
The article also shows how firms can track issues such as 0.5–1.0 ft of sea-level rise by 2050, +3°F summer heat by 2040, and 10 more extreme heat days per year.
What I like most is the article’s main point: scenario analysis is not just about disclosure. It is a way to test when a business plan starts to fail, which assets face write-down risk, which suppliers may break, and what early warning signs should trigger action.
If I were reducing the article to one line, it would be this: use scenario analysis to turn ESG uncertainty into clear choices on spending, risk limits, and resilience.
Understanding ESG Risks through Scenario Analysis ft. Jared Forman, FORVIS
Frame the Right Questions and Set Governance
Start with the decision the scenario analysis needs to inform. Then make ownership clear and tie the work to a specific action. If that link is fuzzy, the analysis usually turns into a reporting exercise that sits on a shelf.
Decision-Focused Framing Questions
Start with these questions:
Cash flow: How could climate, regulatory, or social shifts change revenue?
Operating costs: How could insurance, energy, or labor costs change margins over 5–15 years?
Asset values: Which assets could be impaired or stranded as flood, fire, or code requirements tighten?
Service delivery: Under what conditions would logistics or data centers fail to meet service-level agreements because of grid disruptions, extreme heat, or water shortages?
Permits, approvals, or community support: What ESG-related controversies, regulatory violations, or environmental justice concerns could lead to shutdowns, fines, or project delays?
One question matters more than it may seem at first: under what conditions does the current capital allocation and infrastructure plan stop holding up under stress, and what early indicators would show the business is getting close to that point? That question ties scenario analysis straight to capital planning and strategy, which is where this work starts to matter.
Once those questions are clear, define exactly what the analysis will cover.
Scope, Boundaries, and Time Horizons
After the framing questions are set, spell out what is in scope. That means naming the business units, geographies, facilities, portfolios, and community systems the analysis will cover - and just as important, what it will not cover. Loose scope is one of the main reasons scenario analysis produces outputs no one uses.
A utility may focus on generation, transmission, and water-intensive assets in exposed regions. A retailer may zero in on logistics hubs and stores in flood- and heat-stressed areas.
Boundaries should also make clear whether upstream suppliers or downstream community systems - such as regional water management or transportation corridors - are included. Those systems can pass ESG risks into business operations even when direct physical assets seem protected.
For time horizons, use more than one window. Near-term (1–3 years) fits annual budgeting. Medium-term (5–10 years) lines up with capital investment cycles. Long-term (20–30 years) matches asset lifetimes in utilities, real estate, and infrastructure. Tie each window to a decision process on purpose. Ask which capital projects are locked in for 10–20 years, and which scenarios need stress testing across those timelines. [2][1][3]
After scope is set, assign ownership so the analysis feeds actual decisions.
Roles for Boards, Executives, Risk, Finance, and Sustainability Teams
Governance is the line between scenario analysis that shapes decisions and a one-time compliance task. Leading guidance - including TCFD and central bank supervisory handbooks - puts governance first, before scenario design or impact analysis. [4]
Board oversight usually sits with the risk, governance, or sustainability committee. Boards should approve the scenario framework and key assumptions, set risk appetite thresholds, and make sure findings feed into strategy and capital allocation decisions. They should also agree on escalation paths: the specific conditions under which scenario results trigger board-level review.
At the management level, a clear RACI structure helps keep teams from drifting into silos. Risk teams identify and rank ESG risk themes and keep the work aligned with broader ERM frameworks. Finance teams turn scenario narratives into quantified effects on cash flows, capital requirements, and balance sheet items. Sustainability teams bring subject-matter knowledge on environmental and social trends, regulatory frameworks, and external data sources. Executive leadership should name a senior sponsor - such as the CFO, Chief Risk Officer, or Chief Sustainability Officer - who is accountable for weaving scenario outputs into budgeting, investment decisions, and performance targets. It also helps to keep a shared assumption library that lists each parameter, its source, and its owner.
With governance in place, the next step is to design scenarios that reflect the most material ESG risks.
Design Scenarios That Reflect Material ESG Risks
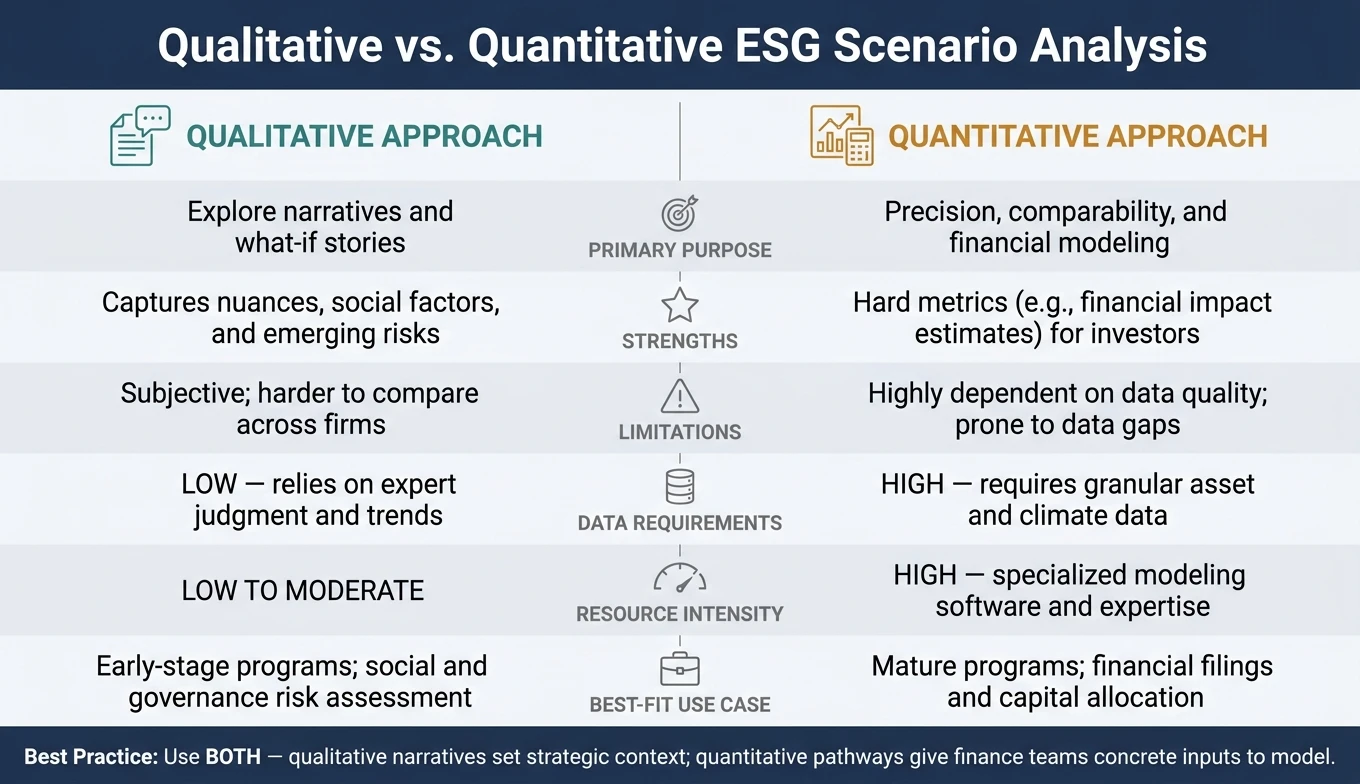
Qualitative vs. Quantitative ESG Scenario Analysis: Key Differences
The goal here is simple: build a small set of scenarios that are realistic enough to pressure-test decisions, but not so complicated that finance, risk, and strategy teams stop using them.
Choose Baseline, Adverse, and Resilience-Testing Scenarios
A good starting point is three to four scenarios. That’s usually enough to cover a useful range of outcomes without turning the exercise into a modeling maze.
A baseline case assumes gradual ESG change. Think moderate carbon-price increases, lower renewable power costs, broadly stable fossil-fuel prices, broad insurance availability across most U.S. locations, and step-by-step regulatory tightening. [6][9][10]
Adverse cases should push harder. These may include a delayed transition, a disorderly transition, or a severe physical-risk pathway tied to 3°C+ warming. In plain terms, that means more frequent storms, floods, heatwaves, and wildfires, along with asset damage, productivity losses, and insurance pullback. [6][9][5][10]
Resilience-testing scenarios go a step further by combining stressors. A compound case might stack high carbon prices, rising electricity costs, tighter labor and human-rights standards across global supply chains, and a macroeconomic downturn happening at the same time. These scenarios are tougher to model, but they tend to mirror the way disruption shows up in the real world: not one problem at a time, but several at once. [8][10]
Once you’ve set the scenario mix, the next move is to turn each one into assumptions that finance and risk teams can run through their models.
Build Narratives and Quantitative Pathways
Each scenario needs two parts: a clear story and a set of numbers. The story explains what is happening and why it matters. The numbers make the story usable.
A solid narrative might look like this: between 2025 and 2040, Gulf Coast facilities face stronger hurricanes, hotter summers, heavier rainfall, 50% higher insurance premiums, a USD 150 per metric ton carbon price by 2035, and 25% higher retail power prices. From there, translate the story into model inputs such as power prices per kWh, labor costs per hour, CapEx timing, and demand shifts. Use U.S. formatting throughout: commas for thousands, °F for local temperatures, °C for global warming benchmarks, and USD per metric ton for carbon prices. [6][7][10]
If the narrative says power gets more expensive, the model should show where, when, and by how much. If it says storms get worse, that should feed into downtime, repair costs, insurance expense, or asset life. That link matters. Otherwise, the scenario reads well but does little work.
Qualitative vs. Quantitative Approaches: A Comparison
Most early-stage programs begin with qualitative scenarios and then add quantitative modeling as data gets better. TCFD technical guidance makes this point clearly: for many organizations, scenario analysis will start out largely qualitative, with more rigorous quantitative analysis added over time as data and internal capability improve. [6]
Here’s the practical difference between the two approaches:
Feature | Qualitative Approach | Quantitative Approach |
|---|---|---|
Primary Purpose | Explore narratives and what-if stories | Precision, comparability, and financial modeling |
Strengths | Captures nuances, social factors, and emerging risks | Provides hard metrics, such as financial impact estimates, for investors |
Limitations | Subjective and harder to compare across firms | Highly dependent on data quality; prone to data gaps |
Data Requirements | Low; relies on expert judgment and trends | High; requires granular asset and climate data |
Resource Intensity | Low to moderate | High; requires specialized modeling software and expertise |
Best-Fit Use Case | Early-stage programs; assessing social and governance risks | Mature programs; financial filings and capital allocation |
In practice, most organizations use both. Qualitative narratives set the strategic context. Quantitative pathways - carbon prices, power costs, storm frequency, and CapEx timing - give finance teams something concrete to model. The key is to keep the narrative and the numbers in sync.
Next, identify the material ESG themes, assumptions, and transmission channels each scenario is testing.
Identify Material Risk Themes, Assumptions, and Transmission Channels
Once the scenarios are built, the next move is to get precise. Which ESG risks matter for this organization under each scenario? And how does an outside shock turn into a financial result?
Prioritize ESG Themes That Are Material to Cash Flow and Strategy
Focus on ESG risks that can change cash flow, asset value, CapEx, or cost of capital. A two-way materiality test helps here: look at both financial exposure and external impact.
For U.S. companies, the themes that most often matter are climate physical risk and climate transition risk. Physical risks include acute events like hurricanes along the Gulf Coast and Eastern Seaboard, wildfires in the West, and flooding in inland and coastal areas. Chronic risks matter too. Rising average temperatures, sea-level rise, and shifting precipitation patterns can hit long-lived infrastructure and real estate hard.
Transition risks tend to matter most in energy, heavy industry, and utilities. Carbon pricing, fuel-switching rules, and technology shifts can strand assets or squeeze margins.
Climate is only part of the picture. Water scarcity, biodiversity loss, and land-use limits can be material for agriculture, food processing, mining, construction, and other water- or land-intensive sectors. Workforce and human rights risks also hit the numbers. Labor availability, wage pressure, and supply chain working conditions can affect retailers, logistics firms, and manufacturers with global sourcing.
Governance failures matter because they can hit financing and legal exposure at the same time. Weak board oversight or misstated ESG disclosures can push up the cost of capital and trigger litigation. Community opposition can do damage in a different way: delays, canceled projects, and cost overruns when new facilities or infrastructure face local resistance.
Refresh the ranking every year, and also after major regulatory or market shifts.
These ranked themes set the scope of what the scenario needs to test.
Document Assumptions and Risk Transmission Channels
Document two sets of assumptions: macroeconomic inputs and ESG-specific inputs. Without clear assumptions, the scenario stays too abstract to test.
Macroeconomic assumptions include GDP growth paths, inflation, interest rates, and exchange rates for multinational operations. ESG-specific assumptions include carbon prices or internal shadow carbon prices, energy prices across different transition paths, insurance premium paths and possible coverage withdrawal in high-risk areas, and the timing and cost of adaptation spending such as flood defenses, cooling systems, renewable generation, or workforce training.
Those assumptions feed the transmission channels and the metrics that sit underneath them.
Transmission channels show how an assumption becomes a financial effect. The main channels to map are:
Regulation and policy: New emissions limits or labor standards can lift compliance costs, force capital upgrades, or block certain activities.
Litigation: Claims tied to environmental harm or misstated ESG disclosures can create direct legal costs and reputational damage that hits revenue and valuation.
Market demand and technology shifts: If customers move toward low-carbon or ethically sourced products, demand can fall for legacy offerings and margins can shift.
Infrastructure damage: Storms, floods, and heatwaves can cause downtime, repair bills, and asset impairments.
Workforce disruption: Extreme heat, unsafe conditions, or labor unrest can cut productivity and push up hiring and training costs.
Stakeholder and investor pressure: Ratings downgrades or activist campaigns can increase the cost of capital and force strategy changes that bring their own transition costs.
Each channel should be tied to the financial lever it changes: cost, revenue, CapEx, asset life, or risk premium. That way, analysts can trace a straight line from the scenario story to the financial model.
Map Risk Themes to Metrics and Expected Impacts
The goal is simple: turn scenarios into inputs the business can use. The table below links each risk theme to its assumptions, transmission channels, exposures, and metrics.
ESG Risk Theme | Key Assumptions | Transmission Channels | Affected Assets / Stakeholders | Impact Metrics |
|---|---|---|---|---|
Coastal flooding & storms | Sea-level rise of 0.5–1.0 ft by 2050; 20% more Category 4–5 storms; insurance premiums +30% by 2030 | Infrastructure damage, insurance cost increases, regulatory pressure for resilience investment | Coastal facilities, distribution centers, nearby communities, customers | CapEx for flood defenses (USD); downtime (hours/year); service reliability; asset write-downs (USD) |
Carbon regulation & pricing | Federal emissions standards tighten by 2030; internal carbon price of $75/ton by 2035 | Compliance costs, fuel-mix changes, technology upgrades, investor pressure | Emissions-intensive assets, corporate treasury, investors | Operating cost per unit; CapEx for low-carbon tech; margin changes; stranded asset risk (USD) |
Water scarcity | Water stress rises in key operating regions by 2035; local water restrictions tighten | Operational constraints, regulatory limits, community opposition | Processing facilities, agricultural suppliers, local communities | Water procurement costs (USD/year); production downtime; permit delays (months) |
Heat stress on workforce | Average summer temperature +3°F by 2040; 10 additional extreme heat days/year | Reduced productivity, increased health and safety incidents, union and community pressure | Outdoor workers, field crews, nearby communities | Lost work hours; safety incident rates; overtime and mitigation costs (USD) |
Supply chain human rights | Stricter enforcement of labor standards; customer contract requirements tighten | Shipment cancellations, regulatory fines, reputational damage, loss of contracts | Tier 1–2 suppliers, procurement teams, brand equity | Revenue at risk (USD); legal fees; supplier remediation costs; customer churn |
Governance failure | Regulatory oversight increases; board accountability expectations expand | Litigation, investor engagement, ratings downgrades, compliance investigations | Corporate leadership, investors, lenders | Cost of capital; compliance fines (USD); share price volatility; borrowing spread changes |
Community opposition | Local resistance to new infrastructure; permitting timelines lengthen by 50% | Legal challenges, project delays, reputational damage, changes in project pipeline | Prospective project sites, local governments, community groups | Project delay (months); legal and engagement costs (USD); canceled or redesigned projects |
Keep this table as a working register. Update it before each scenario run, and keep it current as conditions change.
Use the register to compare scenarios and build outputs that decision-makers can use.
These metrics become the inputs for reporting and decision-making in the next section.
Report Results and Use Them in Decisions
Once scenarios are quantified, the next step is simple: turn them into outputs people can use. Scenario metrics have no value if decision-makers can’t do anything with them.
Use Clear Reporting Formats for Different Audiences
The same scenario run should not be presented the same way to every audience. A Board member, a regulator, and a local community group are not looking for the same level of detail, and they shouldn’t have to dig through it.
Audience | Primary Decision Supported | Key Content | Preferred Format | Technical Depth |
|---|---|---|---|---|
Board | Risk appetite, capital strategy, governance oversight | High-level risk exposure, resilience of the business model, proposed management actions | Dashboard, heat map, concise scenario summary | Low - strategic framing |
Management Team | CapEx prioritization, operational planning, supply chain decisions | Financial metrics by business unit, assumption log, risk register, scenario pathway charts | Side-by-side scenario tables, risk pathway charts | Medium - operational detail |
Investors / Funders | Portfolio exposure, alignment with temperature pathways | Scenario-adjusted valuations, emissions intensity, capital deployment implications | TCFD/ISSB-aligned tables, assumptions log | Medium-high - methodology visible |
Regulators | Compliance, capital adequacy, risk governance | Scenario methodology, assumptions, transmission channels, metrics under each scenario | Standardized templates, formal disclosure documents | High - full methodology |
Community Stakeholders | Local resilience, adaptation co-benefits | Physical risk exposure by location, planned responses, community benefits | Plain-language narrative, maps, infographics | Low - accessible language |
A traffic-light system helps keep reporting easy to scan: high, moderate, or low by scenario. It’s fast, familiar, and hard to misread.
Just don’t stop at the visual. Every chart, map, or table should come with a short narrative that answers three things: What changed in this scenario? Why does it matter? What does management plan to do? That framing keeps the conversation tied to choices, not just numbers.
Link Findings to Capital Allocation, Resilience, and Policy Choices
Reporting only matters if it changes what gets funded, delayed, redesigned, or dropped.
One practical move is to build scenario assumptions straight into DCF models, project rankings, and investment committee reviews. Major CapEx proposals should show how they perform under at least a baseline scenario and an adverse scenario before they reach the committee. If a project only works when every assumption goes right, that’s a red flag. By contrast, investments that hold up across multiple scenarios - such as energy efficiency upgrades, resilience infrastructure, and supplier diversification - should move up the queue.[11][12]
The same logic applies to resilience and supply chain planning. Scenario findings should connect straight to action, with cost estimates and timelines attached. If drought risk climbs in a key sourcing region, the response might include supplier diversification in lower-risk geographies, water-efficient processing investments, or regenerative agriculture partnerships. The point is to attach each option to a budget and an implementation window, not leave it as a vague intention.
Translate scenario findings into funded actions with owners, budgets, and timelines.
Conclusion: What a Strong ESG Scenario Analysis Process Should Deliver
A strong ESG scenario analysis process is iterative, tied to decisions, and built into finance. TCFD, NGFS, and ISSB guidance all make the same point: the process should be updated as new data comes in, as rules shift, and as the organization’s own capability improves.[11][13] Early rounds may lean more qualitative. Later rounds can bring tighter quantitative modeling and deeper financial integration. Both approaches work if the output shapes actual decisions.
Done well, the process gives leaders a clearer view of risk appetite, a tougher project pipeline, stronger supply chains, and a habit of treating ESG uncertainty as part of day-to-day decision-making.
FAQs
How do I choose the right scenarios?
Choose scenarios that match your sector, geography, and business model while still giving you a tough enough test. The goal is to stay disciplined without drifting into abstract modeling that no one uses. At a bare minimum, use at least two scenarios so you can compare a range of outcomes instead of betting on a single future.
Common options include:
an orderly transition scenario at 1.5°C or 2°C
a high-warming scenario at 3°C+
in some cases, a disorderly transition scenario
Tie those scenarios to recognized frameworks, your planning cycle, and your time horizons. When you quantify impacts, keep the spotlight on your most material risks rather than trying to model everything at once.
What data do I need to start?
Start with the core data behind your business: asset locations, day-to-day operations, and the value chain that keeps everything moving. That means facility locations, supply chain dependencies, workforce distribution, and Scope 1 and 2 emissions - plus Scope 3 where it matters.
For scenario analysis, bring in climate projections tied to physical risk, along with data on carbon footprint, energy mix, carbon pricing, and any market or rule changes that could affect the business. If your data is incomplete, that’s fine - use what’s available, or use proxies as a starting point, then sharpen the picture over time with financial data and guidance from TCFD, SASB, or ISSB.
How do I turn scenario results into action?
Move past compliance and put scenario results to work in strategy, governance, and capital allocation. The point isn't to file a report and move on. It's to turn those results into business terms people can act on: revenue at risk, asset impairment, and the adaptation capex needed to respond.
From there, update your risk register and assign clear owners. If no one owns a risk, it tends to drift. And when it drifts, it usually gets handled too late.
Bring these insights into the day-to-day decisions that shape the business, including:
planning
underwriting
supply chain processes
Set monitoring triggers for key risk indicators so teams know when a condition has changed and action is needed. Then make sure the board stays involved through executive metrics and stakeholder reporting.
Related Blog Posts
Latest Articles
©2026

Narrative Change and Power Building: The Missing Half of Advocacy
Narrative change is the process of disrupting dominant narratives that normalize inequity and advancing new narratives from historically marginalized communities.

Funding Resilience Without Federal Grants
BRIC is unreliable and FEMA is shrinking. Here's how cities fund climate resilience with dedicated revenue, blended finance, and a coordinating authority.

The ESG Blind Spot: How AI Is Finding Risks in Companies Nobody Else Is Watching
Norway's sovereign wealth fund uses AI to screen 7,200 portfolio companies for forced labor and corruption within 24 hours. The real story is the emerging-market coverage gap that traditional ESG data vendors miss — and what it means for any company with a global supply chain.
Narrative Change and Power Building: The Missing Half of Advocacy
Narrative change is the process of disrupting dominant narratives that normalize inequity and advancing new narratives from historically marginalized communities.
Funding Resilience Without Federal Grants
BRIC is unreliable and FEMA is shrinking. Here's how cities fund climate resilience with dedicated revenue, blended finance, and a coordinating authority.
The ESG Blind Spot: How AI Is Finding Risks in Companies Nobody Else Is Watching
Norway's sovereign wealth fund uses AI to screen 7,200 portfolio companies for forced labor and corruption within 24 hours. The real story is the emerging-market coverage gap that traditional ESG data vendors miss — and what it means for any company with a global supply chain.
FAQ
01
What does it really mean to “redefine profit”?
02
What makes Council Fire different?
03
Who does Council Fire work with?
04
What does working with Council Fire actually look like?
05
How does Council Fire help organizations turn big goals into action?
06
How does Council Fire define and measure success?
07
How does technology fit into Council Fire’s work?
Sep 21, 2026
ESG Risk Assessment Through Scenario Analysis
ESG Strategy
In This Article
Use 3–4 decision-focused scenarios to test how climate, policy, and social shifts affect cash flow, assets, CapEx, and capital plans.
ESG Risk Assessment Through Scenario Analysis
If you only look backward, you miss the ESG risks most likely to hit next. I’d sum up the article this way: scenario analysis helps me test how policy shifts, climate events, labor issues, and governance failures could change cash flow, asset values, costs, and capital plans across the next 1 to 30+ years.
Here’s the core takeaway in plain English:
I start with a decision, not a report.
I define scope, time horizon, and owners up front.
I use 3 to 4 scenarios: baseline, adverse, and compound stress cases.
I connect each scenario to financial effects like revenue, CapEx, downtime, insurance, and cost of capital.
I turn results into board actions, project choices, and funded risk responses.
A few facts stand out:
Near-term risk reviews often miss slow-building ESG threats that show up over 5, 10, or 20 years.
A sample scenario in the article includes 50% higher insurance premiums, a $150 per metric ton carbon price by 2035, and 25% higher retail power prices.
The article also shows how firms can track issues such as 0.5–1.0 ft of sea-level rise by 2050, +3°F summer heat by 2040, and 10 more extreme heat days per year.
What I like most is the article’s main point: scenario analysis is not just about disclosure. It is a way to test when a business plan starts to fail, which assets face write-down risk, which suppliers may break, and what early warning signs should trigger action.
If I were reducing the article to one line, it would be this: use scenario analysis to turn ESG uncertainty into clear choices on spending, risk limits, and resilience.
Understanding ESG Risks through Scenario Analysis ft. Jared Forman, FORVIS
Frame the Right Questions and Set Governance
Start with the decision the scenario analysis needs to inform. Then make ownership clear and tie the work to a specific action. If that link is fuzzy, the analysis usually turns into a reporting exercise that sits on a shelf.
Decision-Focused Framing Questions
Start with these questions:
Cash flow: How could climate, regulatory, or social shifts change revenue?
Operating costs: How could insurance, energy, or labor costs change margins over 5–15 years?
Asset values: Which assets could be impaired or stranded as flood, fire, or code requirements tighten?
Service delivery: Under what conditions would logistics or data centers fail to meet service-level agreements because of grid disruptions, extreme heat, or water shortages?
Permits, approvals, or community support: What ESG-related controversies, regulatory violations, or environmental justice concerns could lead to shutdowns, fines, or project delays?
One question matters more than it may seem at first: under what conditions does the current capital allocation and infrastructure plan stop holding up under stress, and what early indicators would show the business is getting close to that point? That question ties scenario analysis straight to capital planning and strategy, which is where this work starts to matter.
Once those questions are clear, define exactly what the analysis will cover.
Scope, Boundaries, and Time Horizons
After the framing questions are set, spell out what is in scope. That means naming the business units, geographies, facilities, portfolios, and community systems the analysis will cover - and just as important, what it will not cover. Loose scope is one of the main reasons scenario analysis produces outputs no one uses.
A utility may focus on generation, transmission, and water-intensive assets in exposed regions. A retailer may zero in on logistics hubs and stores in flood- and heat-stressed areas.
Boundaries should also make clear whether upstream suppliers or downstream community systems - such as regional water management or transportation corridors - are included. Those systems can pass ESG risks into business operations even when direct physical assets seem protected.
For time horizons, use more than one window. Near-term (1–3 years) fits annual budgeting. Medium-term (5–10 years) lines up with capital investment cycles. Long-term (20–30 years) matches asset lifetimes in utilities, real estate, and infrastructure. Tie each window to a decision process on purpose. Ask which capital projects are locked in for 10–20 years, and which scenarios need stress testing across those timelines. [2][1][3]
After scope is set, assign ownership so the analysis feeds actual decisions.
Roles for Boards, Executives, Risk, Finance, and Sustainability Teams
Governance is the line between scenario analysis that shapes decisions and a one-time compliance task. Leading guidance - including TCFD and central bank supervisory handbooks - puts governance first, before scenario design or impact analysis. [4]
Board oversight usually sits with the risk, governance, or sustainability committee. Boards should approve the scenario framework and key assumptions, set risk appetite thresholds, and make sure findings feed into strategy and capital allocation decisions. They should also agree on escalation paths: the specific conditions under which scenario results trigger board-level review.
At the management level, a clear RACI structure helps keep teams from drifting into silos. Risk teams identify and rank ESG risk themes and keep the work aligned with broader ERM frameworks. Finance teams turn scenario narratives into quantified effects on cash flows, capital requirements, and balance sheet items. Sustainability teams bring subject-matter knowledge on environmental and social trends, regulatory frameworks, and external data sources. Executive leadership should name a senior sponsor - such as the CFO, Chief Risk Officer, or Chief Sustainability Officer - who is accountable for weaving scenario outputs into budgeting, investment decisions, and performance targets. It also helps to keep a shared assumption library that lists each parameter, its source, and its owner.
With governance in place, the next step is to design scenarios that reflect the most material ESG risks.
Design Scenarios That Reflect Material ESG Risks
Qualitative vs. Quantitative ESG Scenario Analysis: Key Differences
The goal here is simple: build a small set of scenarios that are realistic enough to pressure-test decisions, but not so complicated that finance, risk, and strategy teams stop using them.
Choose Baseline, Adverse, and Resilience-Testing Scenarios
A good starting point is three to four scenarios. That’s usually enough to cover a useful range of outcomes without turning the exercise into a modeling maze.
A baseline case assumes gradual ESG change. Think moderate carbon-price increases, lower renewable power costs, broadly stable fossil-fuel prices, broad insurance availability across most U.S. locations, and step-by-step regulatory tightening. [6][9][10]
Adverse cases should push harder. These may include a delayed transition, a disorderly transition, or a severe physical-risk pathway tied to 3°C+ warming. In plain terms, that means more frequent storms, floods, heatwaves, and wildfires, along with asset damage, productivity losses, and insurance pullback. [6][9][5][10]
Resilience-testing scenarios go a step further by combining stressors. A compound case might stack high carbon prices, rising electricity costs, tighter labor and human-rights standards across global supply chains, and a macroeconomic downturn happening at the same time. These scenarios are tougher to model, but they tend to mirror the way disruption shows up in the real world: not one problem at a time, but several at once. [8][10]
Once you’ve set the scenario mix, the next move is to turn each one into assumptions that finance and risk teams can run through their models.
Build Narratives and Quantitative Pathways
Each scenario needs two parts: a clear story and a set of numbers. The story explains what is happening and why it matters. The numbers make the story usable.
A solid narrative might look like this: between 2025 and 2040, Gulf Coast facilities face stronger hurricanes, hotter summers, heavier rainfall, 50% higher insurance premiums, a USD 150 per metric ton carbon price by 2035, and 25% higher retail power prices. From there, translate the story into model inputs such as power prices per kWh, labor costs per hour, CapEx timing, and demand shifts. Use U.S. formatting throughout: commas for thousands, °F for local temperatures, °C for global warming benchmarks, and USD per metric ton for carbon prices. [6][7][10]
If the narrative says power gets more expensive, the model should show where, when, and by how much. If it says storms get worse, that should feed into downtime, repair costs, insurance expense, or asset life. That link matters. Otherwise, the scenario reads well but does little work.
Qualitative vs. Quantitative Approaches: A Comparison
Most early-stage programs begin with qualitative scenarios and then add quantitative modeling as data gets better. TCFD technical guidance makes this point clearly: for many organizations, scenario analysis will start out largely qualitative, with more rigorous quantitative analysis added over time as data and internal capability improve. [6]
Here’s the practical difference between the two approaches:
Feature | Qualitative Approach | Quantitative Approach |
|---|---|---|
Primary Purpose | Explore narratives and what-if stories | Precision, comparability, and financial modeling |
Strengths | Captures nuances, social factors, and emerging risks | Provides hard metrics, such as financial impact estimates, for investors |
Limitations | Subjective and harder to compare across firms | Highly dependent on data quality; prone to data gaps |
Data Requirements | Low; relies on expert judgment and trends | High; requires granular asset and climate data |
Resource Intensity | Low to moderate | High; requires specialized modeling software and expertise |
Best-Fit Use Case | Early-stage programs; assessing social and governance risks | Mature programs; financial filings and capital allocation |
In practice, most organizations use both. Qualitative narratives set the strategic context. Quantitative pathways - carbon prices, power costs, storm frequency, and CapEx timing - give finance teams something concrete to model. The key is to keep the narrative and the numbers in sync.
Next, identify the material ESG themes, assumptions, and transmission channels each scenario is testing.
Identify Material Risk Themes, Assumptions, and Transmission Channels
Once the scenarios are built, the next move is to get precise. Which ESG risks matter for this organization under each scenario? And how does an outside shock turn into a financial result?
Prioritize ESG Themes That Are Material to Cash Flow and Strategy
Focus on ESG risks that can change cash flow, asset value, CapEx, or cost of capital. A two-way materiality test helps here: look at both financial exposure and external impact.
For U.S. companies, the themes that most often matter are climate physical risk and climate transition risk. Physical risks include acute events like hurricanes along the Gulf Coast and Eastern Seaboard, wildfires in the West, and flooding in inland and coastal areas. Chronic risks matter too. Rising average temperatures, sea-level rise, and shifting precipitation patterns can hit long-lived infrastructure and real estate hard.
Transition risks tend to matter most in energy, heavy industry, and utilities. Carbon pricing, fuel-switching rules, and technology shifts can strand assets or squeeze margins.
Climate is only part of the picture. Water scarcity, biodiversity loss, and land-use limits can be material for agriculture, food processing, mining, construction, and other water- or land-intensive sectors. Workforce and human rights risks also hit the numbers. Labor availability, wage pressure, and supply chain working conditions can affect retailers, logistics firms, and manufacturers with global sourcing.
Governance failures matter because they can hit financing and legal exposure at the same time. Weak board oversight or misstated ESG disclosures can push up the cost of capital and trigger litigation. Community opposition can do damage in a different way: delays, canceled projects, and cost overruns when new facilities or infrastructure face local resistance.
Refresh the ranking every year, and also after major regulatory or market shifts.
These ranked themes set the scope of what the scenario needs to test.
Document Assumptions and Risk Transmission Channels
Document two sets of assumptions: macroeconomic inputs and ESG-specific inputs. Without clear assumptions, the scenario stays too abstract to test.
Macroeconomic assumptions include GDP growth paths, inflation, interest rates, and exchange rates for multinational operations. ESG-specific assumptions include carbon prices or internal shadow carbon prices, energy prices across different transition paths, insurance premium paths and possible coverage withdrawal in high-risk areas, and the timing and cost of adaptation spending such as flood defenses, cooling systems, renewable generation, or workforce training.
Those assumptions feed the transmission channels and the metrics that sit underneath them.
Transmission channels show how an assumption becomes a financial effect. The main channels to map are:
Regulation and policy: New emissions limits or labor standards can lift compliance costs, force capital upgrades, or block certain activities.
Litigation: Claims tied to environmental harm or misstated ESG disclosures can create direct legal costs and reputational damage that hits revenue and valuation.
Market demand and technology shifts: If customers move toward low-carbon or ethically sourced products, demand can fall for legacy offerings and margins can shift.
Infrastructure damage: Storms, floods, and heatwaves can cause downtime, repair bills, and asset impairments.
Workforce disruption: Extreme heat, unsafe conditions, or labor unrest can cut productivity and push up hiring and training costs.
Stakeholder and investor pressure: Ratings downgrades or activist campaigns can increase the cost of capital and force strategy changes that bring their own transition costs.
Each channel should be tied to the financial lever it changes: cost, revenue, CapEx, asset life, or risk premium. That way, analysts can trace a straight line from the scenario story to the financial model.
Map Risk Themes to Metrics and Expected Impacts
The goal is simple: turn scenarios into inputs the business can use. The table below links each risk theme to its assumptions, transmission channels, exposures, and metrics.
ESG Risk Theme | Key Assumptions | Transmission Channels | Affected Assets / Stakeholders | Impact Metrics |
|---|---|---|---|---|
Coastal flooding & storms | Sea-level rise of 0.5–1.0 ft by 2050; 20% more Category 4–5 storms; insurance premiums +30% by 2030 | Infrastructure damage, insurance cost increases, regulatory pressure for resilience investment | Coastal facilities, distribution centers, nearby communities, customers | CapEx for flood defenses (USD); downtime (hours/year); service reliability; asset write-downs (USD) |
Carbon regulation & pricing | Federal emissions standards tighten by 2030; internal carbon price of $75/ton by 2035 | Compliance costs, fuel-mix changes, technology upgrades, investor pressure | Emissions-intensive assets, corporate treasury, investors | Operating cost per unit; CapEx for low-carbon tech; margin changes; stranded asset risk (USD) |
Water scarcity | Water stress rises in key operating regions by 2035; local water restrictions tighten | Operational constraints, regulatory limits, community opposition | Processing facilities, agricultural suppliers, local communities | Water procurement costs (USD/year); production downtime; permit delays (months) |
Heat stress on workforce | Average summer temperature +3°F by 2040; 10 additional extreme heat days/year | Reduced productivity, increased health and safety incidents, union and community pressure | Outdoor workers, field crews, nearby communities | Lost work hours; safety incident rates; overtime and mitigation costs (USD) |
Supply chain human rights | Stricter enforcement of labor standards; customer contract requirements tighten | Shipment cancellations, regulatory fines, reputational damage, loss of contracts | Tier 1–2 suppliers, procurement teams, brand equity | Revenue at risk (USD); legal fees; supplier remediation costs; customer churn |
Governance failure | Regulatory oversight increases; board accountability expectations expand | Litigation, investor engagement, ratings downgrades, compliance investigations | Corporate leadership, investors, lenders | Cost of capital; compliance fines (USD); share price volatility; borrowing spread changes |
Community opposition | Local resistance to new infrastructure; permitting timelines lengthen by 50% | Legal challenges, project delays, reputational damage, changes in project pipeline | Prospective project sites, local governments, community groups | Project delay (months); legal and engagement costs (USD); canceled or redesigned projects |
Keep this table as a working register. Update it before each scenario run, and keep it current as conditions change.
Use the register to compare scenarios and build outputs that decision-makers can use.
These metrics become the inputs for reporting and decision-making in the next section.
Report Results and Use Them in Decisions
Once scenarios are quantified, the next step is simple: turn them into outputs people can use. Scenario metrics have no value if decision-makers can’t do anything with them.
Use Clear Reporting Formats for Different Audiences
The same scenario run should not be presented the same way to every audience. A Board member, a regulator, and a local community group are not looking for the same level of detail, and they shouldn’t have to dig through it.
Audience | Primary Decision Supported | Key Content | Preferred Format | Technical Depth |
|---|---|---|---|---|
Board | Risk appetite, capital strategy, governance oversight | High-level risk exposure, resilience of the business model, proposed management actions | Dashboard, heat map, concise scenario summary | Low - strategic framing |
Management Team | CapEx prioritization, operational planning, supply chain decisions | Financial metrics by business unit, assumption log, risk register, scenario pathway charts | Side-by-side scenario tables, risk pathway charts | Medium - operational detail |
Investors / Funders | Portfolio exposure, alignment with temperature pathways | Scenario-adjusted valuations, emissions intensity, capital deployment implications | TCFD/ISSB-aligned tables, assumptions log | Medium-high - methodology visible |
Regulators | Compliance, capital adequacy, risk governance | Scenario methodology, assumptions, transmission channels, metrics under each scenario | Standardized templates, formal disclosure documents | High - full methodology |
Community Stakeholders | Local resilience, adaptation co-benefits | Physical risk exposure by location, planned responses, community benefits | Plain-language narrative, maps, infographics | Low - accessible language |
A traffic-light system helps keep reporting easy to scan: high, moderate, or low by scenario. It’s fast, familiar, and hard to misread.
Just don’t stop at the visual. Every chart, map, or table should come with a short narrative that answers three things: What changed in this scenario? Why does it matter? What does management plan to do? That framing keeps the conversation tied to choices, not just numbers.
Link Findings to Capital Allocation, Resilience, and Policy Choices
Reporting only matters if it changes what gets funded, delayed, redesigned, or dropped.
One practical move is to build scenario assumptions straight into DCF models, project rankings, and investment committee reviews. Major CapEx proposals should show how they perform under at least a baseline scenario and an adverse scenario before they reach the committee. If a project only works when every assumption goes right, that’s a red flag. By contrast, investments that hold up across multiple scenarios - such as energy efficiency upgrades, resilience infrastructure, and supplier diversification - should move up the queue.[11][12]
The same logic applies to resilience and supply chain planning. Scenario findings should connect straight to action, with cost estimates and timelines attached. If drought risk climbs in a key sourcing region, the response might include supplier diversification in lower-risk geographies, water-efficient processing investments, or regenerative agriculture partnerships. The point is to attach each option to a budget and an implementation window, not leave it as a vague intention.
Translate scenario findings into funded actions with owners, budgets, and timelines.
Conclusion: What a Strong ESG Scenario Analysis Process Should Deliver
A strong ESG scenario analysis process is iterative, tied to decisions, and built into finance. TCFD, NGFS, and ISSB guidance all make the same point: the process should be updated as new data comes in, as rules shift, and as the organization’s own capability improves.[11][13] Early rounds may lean more qualitative. Later rounds can bring tighter quantitative modeling and deeper financial integration. Both approaches work if the output shapes actual decisions.
Done well, the process gives leaders a clearer view of risk appetite, a tougher project pipeline, stronger supply chains, and a habit of treating ESG uncertainty as part of day-to-day decision-making.
FAQs
How do I choose the right scenarios?
Choose scenarios that match your sector, geography, and business model while still giving you a tough enough test. The goal is to stay disciplined without drifting into abstract modeling that no one uses. At a bare minimum, use at least two scenarios so you can compare a range of outcomes instead of betting on a single future.
Common options include:
an orderly transition scenario at 1.5°C or 2°C
a high-warming scenario at 3°C+
in some cases, a disorderly transition scenario
Tie those scenarios to recognized frameworks, your planning cycle, and your time horizons. When you quantify impacts, keep the spotlight on your most material risks rather than trying to model everything at once.
What data do I need to start?
Start with the core data behind your business: asset locations, day-to-day operations, and the value chain that keeps everything moving. That means facility locations, supply chain dependencies, workforce distribution, and Scope 1 and 2 emissions - plus Scope 3 where it matters.
For scenario analysis, bring in climate projections tied to physical risk, along with data on carbon footprint, energy mix, carbon pricing, and any market or rule changes that could affect the business. If your data is incomplete, that’s fine - use what’s available, or use proxies as a starting point, then sharpen the picture over time with financial data and guidance from TCFD, SASB, or ISSB.
How do I turn scenario results into action?
Move past compliance and put scenario results to work in strategy, governance, and capital allocation. The point isn't to file a report and move on. It's to turn those results into business terms people can act on: revenue at risk, asset impairment, and the adaptation capex needed to respond.
From there, update your risk register and assign clear owners. If no one owns a risk, it tends to drift. And when it drifts, it usually gets handled too late.
Bring these insights into the day-to-day decisions that shape the business, including:
planning
underwriting
supply chain processes
Set monitoring triggers for key risk indicators so teams know when a condition has changed and action is needed. Then make sure the board stays involved through executive metrics and stakeholder reporting.
Related Blog Posts
Latest Articles
©2026
Narrative Change and Power Building: The Missing Half of Advocacy
Narrative change is the process of disrupting dominant narratives that normalize inequity and advancing new narratives from historically marginalized communities.
Funding Resilience Without Federal Grants
BRIC is unreliable and FEMA is shrinking. Here's how cities fund climate resilience with dedicated revenue, blended finance, and a coordinating authority.
The ESG Blind Spot: How AI Is Finding Risks in Companies Nobody Else Is Watching
Norway's sovereign wealth fund uses AI to screen 7,200 portfolio companies for forced labor and corruption within 24 hours. The real story is the emerging-market coverage gap that traditional ESG data vendors miss — and what it means for any company with a global supply chain.
FAQ
What does it really mean to “redefine profit”?
What makes Council Fire different?
Who does Council Fire work with?
What does working with Council Fire actually look like?
How does Council Fire help organizations turn big goals into action?
How does Council Fire define and measure success?
How does technology fit into Council Fire’s work?