
Aug 26, 2026
Climate Risk Compliance: 7 Assessment Steps
ESG Strategy
In This Article
Seven-step annual process to assess and disclose climate risks: scope, materiality, mapping, scenarios, metrics, controls, and audit-ready filings.
Climate Risk Compliance: 7 Assessment Steps
If I want climate risk work to hold up in reporting, audit, and board review, I need a process I can run every year - not a one-time exercise. This article boils that process down to 7 steps: define scope, pick material topics, map exposure, test scenarios, choose metrics, check controls, and draft disclosures.
Here’s the short version:
I start by deciding what parts of the business the review covers.
I sort climate issues into physical risk, transition risk, and opportunity.
I link those issues to sites, suppliers, and logistics points.
I test hot spots against 2030, 2040, and 2050 scenarios.
I choose metrics tied to cost, downtime, emissions, and supplier exposure.
I confirm board oversight, executive ownership, and review controls.
I keep source data, logs, approvals, and disclosure files in one place.
A few facts stand out. The article notes $162 billion in global natural-catastrophe losses in the first half of 2025 alone. It also centers U.S. reporting needs tied to IFRS S2, TCFD, and SEC climate disclosure expectations.
What I take from it is simple: good climate compliance is less about one report and more about a repeatable yearly workflow tied to Q1–Q4 planning, finance, risk, and board review.
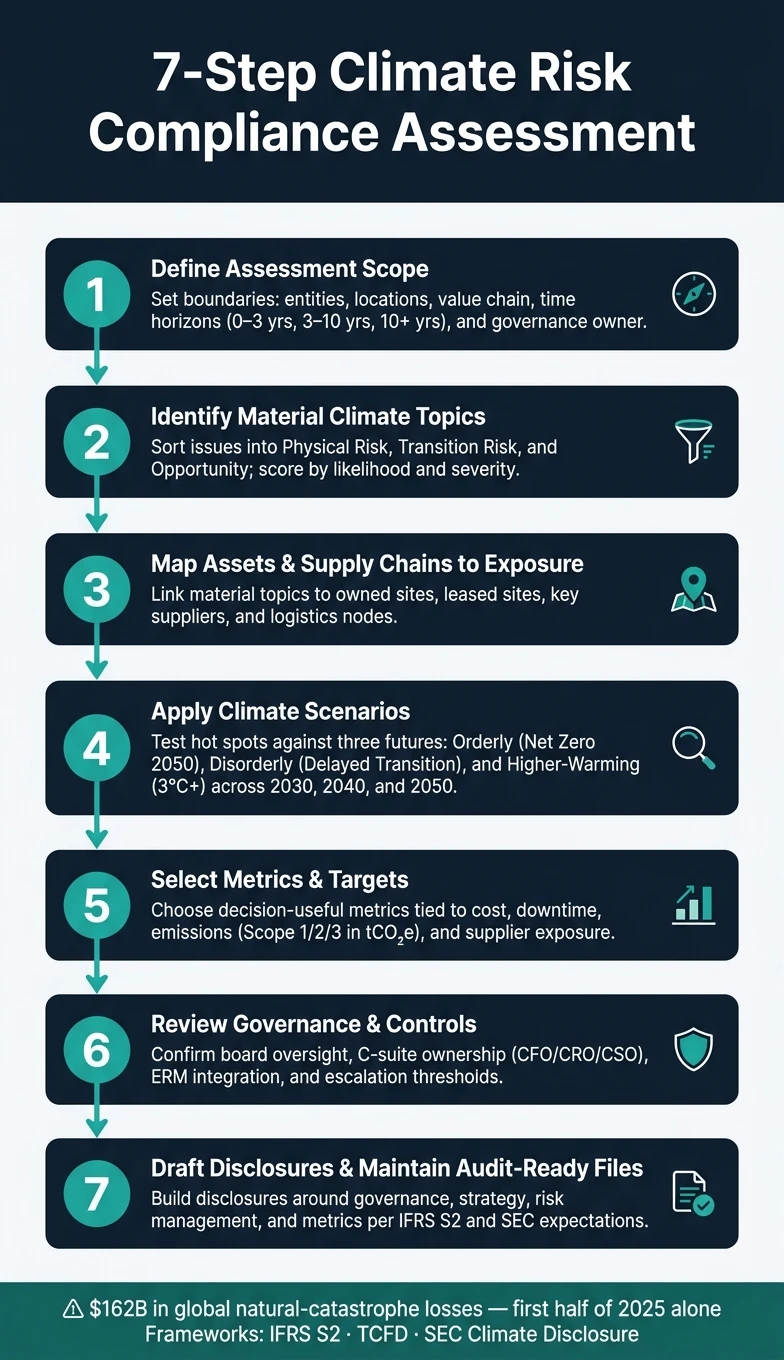
7-Step Climate Risk Compliance Assessment Process
Steps 1-2: Set scope and confirm material climate topics
Step 1: Define the assessment scope
Before you gather data or score risk, set the boundaries. If the scope is fuzzy, teams can spend weeks studying the wrong assets or miss the exposures that matter most.
A solid scope answers six basic questions. Which legal entities and business units are included? Which operating locations matter most? How far should value chain coverage go - upstream to suppliers, downstream to customers? What time horizons apply? What will the results be used for? And what level of evidence will audit or assurance expect?
For time horizons, short-term usually means 0–3 years, medium-term covers 3–10 years, and long-term stretches beyond 10 years toward policy markers such as 2030 and 2050. These ranges should line up with capital planning cycles and reporting timelines.
One choice that often slips through the cracks is governance ownership. Put a named senior leader in charge - CFO, CRO, or CSO - and confirm which board committee oversees the work. That keeps the process tied to SEC governance disclosure expectations and broader board risk oversight.
Use this table to weigh narrow and broad scope options.
Narrow Scope | Broad Scope | |
|---|---|---|
Organizational coverage | SEC registrant and core U.S. operations | Registrant plus global subsidiaries and joint ventures |
Value chain coverage | Owned/leased facilities only | Key upstream suppliers and downstream customer segments |
Time horizons | Short- to medium-term | Short-, medium-, and long-term aligned with 2050 decarbonization pathways |
Risk types analyzed | Major physical risks for critical assets | Physical risks, transition risks, and opportunities |
Data requirements | Lower; relies on internal asset and operations data | Higher; requires external climate data providers and supplier input |
Pros | Faster to execute, lower cost, easier to document | Richer strategic insight, stronger alignment with TCFD/ISSB and investor expectations |
Cons | Potential blind spots in value chain; weaker long-term strategy alignment | More resource-intensive; higher coordination demands across functions |
Best for | Smaller registrants, early-stage programs, or single-business-unit pilots | Mature ESG programs, climate-exposed sectors, and organizations preparing for assurance |
Scope choices shape everything that follows: what gets mapped, what gets modeled, and what ends up in disclosure. Once those lines are set, the job becomes much simpler: sort the issues that matter from the background noise.
Step 2: Identify material climate topics
Use the scope as your filter. Place each issue into one of three buckets: physical risk, transition risk, or opportunity. Then narrow the list to topics that could affect strategy, operations, cash flow, access to capital, or disclosure.
Physical Risks | Transition Risks | Opportunities | |
|---|---|---|---|
Definition | Acute events (floods, hurricanes, wildfires) and chronic shifts (sea-level rise, temperature increase, drought) | Policy/legal changes, technology disruption, market demand shifts, and reputational pressure | Efficiency gains, new low-carbon products/services, access to green finance, resilient infrastructure |
ERM category | Operational, financial | Legal/regulatory, reputational, financial | Strategic, financial |
Example U.S. business impacts | Gulf Coast facility flooding, wildfire-driven supply chain disruption, higher insurance premiums | State clean energy mandates affecting utility revenue, carbon pricing increasing input costs, stranded fossil-fuel assets | Revenue from energy-efficient building materials, lower operating costs from electrification, improved credit terms from green lenders |
Common metrics | Expected annual loss (EAL), number of high-risk assets, days of production downtime | Carbon intensity, regulatory compliance costs, % revenue from high-emissions products | Low-carbon revenue share, emissions avoided, payback period on resilience investments |
After that mapping step, score each risk and opportunity by likelihood and severity using your current ERM method. Focus first on topics that could affect financial statements, strategy, or compliance duties under U.S. securities law and IFRS S1/S2.
Not every topic will make the cut, and that’s fine. Items that do not meet the threshold can still be logged as reviewed but not prioritized. That record helps support a defensible audit trail.
Once the material topics are ranked, map them to the assets and suppliers they affect.
Steps 3-5: Map exposures, run scenarios, and choose metrics
Step 3: Map assets and supply chains to climate exposure
Once you've ranked the material topics, the next move is to connect each one to the sites and suppliers it touches. Start with a clear inventory of owned sites, leased sites, key suppliers, logistics nodes, and any single-source dependencies. From there, map each site or supplier to both physical and transition risks.
On the physical side, flag exposure to flooding, extreme heat, wildfire, drought, hurricanes, and storm surge. On the transition side, look at carbon pricing, tighter policy, technology substitution, and shifts in market demand. A coastal distribution center, for example, may be dealing with storm surge risk at the same time that transport costs climb because of fuel prices or stricter emissions rules.
Not every exposure deserves the same level of attention. Push the most critical and most vulnerable items to the top of the review list. That usually includes revenue-generating facilities, assets that are hard to replace, and single-source suppliers located in high-hazard zones.
Local input matters here. A map can show exposure, but local teams often know what the map misses. Levees, backup power, or supplier diversification can change the risk picture in a material way. It also helps to document your data sources, location precision, and any proxies used when exact coordinates aren't available. That paper trail will matter later.
Use a heatmap to bring the full picture together. Combine hazard severity, likelihood, criticality, and time horizon in one view, then use that heatmap as the baseline for scenario testing.
Step 4: Apply climate scenarios
With the Step 3 hot spots flagged, test them against more than one future. Scenario analysis helps you see how sites and suppliers might hold up under a range of plausible conditions. Keep the time frames tied to planning cycles and asset life: near term (2030), mid-term (2040), and long term (2050).
Scenario Type | Core Assumptions | Likely Use Case | Type of Impact Assessed |
|---|---|---|---|
Orderly (e.g., Net Zero 2050) | Early, coordinated policy action; warming around 1.5°C to 1.7°C | Long-term investment strategy, decarbonization planning | Lower transition risk; lower physical risk |
Disorderly (e.g., Delayed Transition) | Delayed policy action, then abrupt tightening; warming around 1.5°C to 1.8°C | Stress-testing carbon cost exposure and stranded assets | High transition risk; moderate physical risk |
Higher-Warming (Current Policies) | Limited mitigation; warming above 3°C | Physical resilience of operations, supply chains, and infrastructure | Severe physical risk; lower transition risk |
For each scenario, document the effect on operations, supply chains, revenue, capital spending, insurance, and adaptation priorities. Be plain about the limits of the analysis. If supplier geolocation is incomplete or hazard projections carry uncertainty, say so. Leaders need to know which estimates are solid and which are more directional.
That distinction is important because the scenario output feeds directly into Step 5. If the scenario work shows that carbon cost exposure is the big pressure point, your metrics should reflect that. If physical disruption is the bigger issue, the metric set should lean that way instead.
Step 5: Select climate risk metrics and targets
Pick metrics that help people make decisions, not metrics that just fill out a disclosure table. Each metric should answer a usable question. Which site needs adaptation first? What happens to financial exposure if carbon prices go up?
Use current-state metrics to show today's exposure, and pair them with forward-looking indicators that show scenario impact. The goal is simple: measure the risks you identified in Steps 3 and 4 in a way that management can act on.
Key Risk | Financial / Operational Impact | Selected Metric | Target or Threshold | Data Source | Reporting Owner |
|---|---|---|---|---|---|
Coastal flooding at warehouse network | Service disruption, higher logistics costs | % of warehousing capacity in high-flood zones | Reduce high-risk exposure over time | Geospatial hazard data, asset register | Operations |
Supplier transition risk | Higher input costs, supply interruption | Share of spend with high-emitting suppliers | Increase supplier emissions coverage and set supplier targets | Supplier surveys, procurement records | Procurement |
Carbon pricing exposure | Rising input and compliance costs | Scope 1, 2, and 3 emissions (tCO₂e) | Interim and long-term emissions reduction milestones | Utility bills, ERP systems | Finance / Sustainability |
Extreme heat at manufacturing sites | Labor productivity loss, operational disruption | % of manufacturing capacity in high-heat zones | Track adaptation progress and reduce exposure | Climate projections, facility data | Operations |
Each metric should trace back to a material risk, a disclosure requirement, or a management target. Record the source for each one so reporting stays audit-ready. That source tracking also makes year-over-year comparisons easier to defend. From there, the next step is to confirm that the metrics have clear ownership, proper controls, and disclosure readiness.
Steps 6-7: Review controls and draft disclosures
Step 6: Review governance, processes, and controls
Once the metrics are in place, test the controls around them. Before you lock in findings, check who oversees the work at the board level, who owns it at the executive level, and how issues move up the chain. In sectors with high exposure, climate risk often goes to review every quarter.
A named C-suite leader - CFO, CRO, CSO, or COO - should have climate risk management written into performance goals and tied to incentive plans. Under that, a risk committee or ESG steering group should link climate risk to the broader enterprise risk management (ERM) framework. It belongs inside ERM, not off to the side.
Escalation thresholds also need to be spelled out. If scenario analysis points to a financial hit or supply chain exposure that goes past risk appetite, there should be a documented route to management or board review. Climate-risk sign-off should also be required for material capital projects and material supplier contracts.
For this step, the document package should include:
A methodology memo
Model assumption logs
Version control records
Internal review sign-offs from risk, finance, legal/compliance, and sustainability teams
The World Bank recommends that internal audit periodically review climate-related data collection, risk registers, policies, procedures, and controls, and report results to the audit committee. [4]
With the controls checked, the next move is simple: use that same evidence in the disclosure draft.
Step 7: Draft disclosures and maintain audit-ready files
Build disclosures around governance, strategy, risk management, and metrics and targets. IFRS S2 requires disclosure of the governance processes, controls, and procedures used to monitor, manage, and oversee climate-related risks and opportunities. [2] [6] The SEC's climate-related disclosure expectations follow a similar pattern, with one added point: disclosure controls must make sure required information is recorded, processed, summarized, and reported on time. [3]
Use one central repository so each disclosed metric can be traced back to source data, transformations, models, and checks. That helps keep old spreadsheet data from slipping into the narrative. KPMG advises boards and audit committees to have management reassess internal controls and disclosure controls and procedures for climate disclosures in both SEC filings and voluntary sustainability reports, which lowers the risk of mixed messages across channels. [5]
Use this checklist to sign off on controls and disclosures.
Assessment Step | Required Documentation | Governance Approver | Disclosure Reference |
|---|---|---|---|
6. Review controls | Internal control coverage report, escalation procedures, internal audit review | Internal Audit / Board | Governance, Risk Management |
7. Draft disclosures | Final disclosure narrative, traceability log, board/legal approval | Board of Directors / Legal | All four pillars |
Retain source data, calculation logs, board minutes, policy approvals, and change histories.
ESG quick play: Mastering climate risk: Your path to global compliance
Conclusion: Make the 7-step checklist part of your annual ESG reporting cycle
Run the seven-step process every year so your scope, scenarios, metrics, controls, and disclosures stay up to date. The key is simple: tie each step to the same operating calendar each year.
Map the work to your annual reporting cycle. Scope and materiality reviews fit well in Q1 strategy and risk sessions. Asset mapping and scenario updates line up with Q2 capital planning. Metric and target reviews make sense in Q3 alongside financial planning. Control testing and disclosure drafting belong in Q4, ahead of SEC filings and annual ESG reports. For U.S. teams, it also helps to line this up with 10-K prep, risk committee review, and internal audit.
That rhythm matters because climate losses are already material. Global economic losses from natural catastrophes reached $162 billion in the first half of 2025 alone. [7] That kind of number is hard to brush aside. It points to the kind of impairments, disruptions, and earnings pressure that can hit a business when risk reviews lag behind reality.
The next move is turning assessment results into decisions. Use each annual cycle to translate findings into capital allocation, supplier choices, and resilience planning. For organizations ready to move from assessment results into concrete action, Council Fire helps turn climate-risk findings into measurable action. [1]
FAQs
How do I decide the right scope?
Start by getting clear on why you're doing the assessment. That one step shapes everything that follows. If the goal is disclosure, you may need a broader view and tighter documentation. If it's for strategic planning, the focus may shift to where risk and opportunity could affect operations, growth, or capital allocation. If you're using it for investment analysis, the scope should line up with the factors that matter most to financial performance and portfolio decisions.
From there, define the boundaries of the assessment in plain terms:
Organizational boundaries: Decide which business units, subsidiaries, joint ventures, or assets are included.
Geographic scope: Set the locations, regions, or markets the assessment will cover.
Value chain dependencies: Map the upstream and downstream relationships that could affect exposure, from suppliers to customers and logistics partners.
Time horizons: Use short-term (1–3 years), medium-term (3–10 years), and long-term (10–30+ years) views so today's decisions aren't cut off from what may hit later.
A tight scope keeps the work useful. Too narrow, and you miss material issues. Too broad, and the assessment turns into a catch-all that doesn't help anyone make decisions.
Which climate risks are usually material first?
It depends on the framework a company uses.
Under financial materiality standards like the ISSB, a risk is material if it could reasonably affect enterprise value or influence investor decisions. The focus is narrow and finance-led: does this issue matter to the business and the people putting money into it?
Under double materiality frameworks like the CSRD, the lens is broader. Companies look at both sides of the equation: the financial effects on the business and the company’s impacts on people and the planet.
In day-to-day practice, most companies put physical and transition risks at the top of the list when those risks show medium or high financial magnitude and show a moderate likelihood of happening within a five-year time horizon.
What evidence should I keep for audit readiness?
Keep a clear evidence trail that backs up your process, methodology, and data integrity.
That means holding onto the records that show how decisions were made, what data was used, and how reported numbers were checked. If someone reviews your work later - whether it’s leadership, auditors, investors, or regulators - the file should tell a clear story from start to finish.
Include support such as:
Governance records, including board and management meeting minutes
Materiality assessment records, including stakeholders, criteria, thresholds, and rationale
Climate risk methodology, assumptions, scenario inputs, and limitations
Support for reported metrics, internal controls, and links to financial reporting
Think of this as your paper trail. If a figure appears in a report, you should be able to trace it back to its source. If a climate risk judgment was made, the assumptions behind it should be easy to find. That kind of discipline doesn’t just help with review - it makes the whole reporting process easier to defend and easier to repeat.
Related Blog Posts
Latest Articles
©2026

Narrative Change and Power Building: The Missing Half of Advocacy
Narrative change is the process of disrupting dominant narratives that normalize inequity and advancing new narratives from historically marginalized communities.

Funding Resilience Without Federal Grants
BRIC is unreliable and FEMA is shrinking. Here's how cities fund climate resilience with dedicated revenue, blended finance, and a coordinating authority.

The ESG Blind Spot: How AI Is Finding Risks in Companies Nobody Else Is Watching
Norway's sovereign wealth fund uses AI to screen 7,200 portfolio companies for forced labor and corruption within 24 hours. The real story is the emerging-market coverage gap that traditional ESG data vendors miss — and what it means for any company with a global supply chain.
Narrative Change and Power Building: The Missing Half of Advocacy
Narrative change is the process of disrupting dominant narratives that normalize inequity and advancing new narratives from historically marginalized communities.
Funding Resilience Without Federal Grants
BRIC is unreliable and FEMA is shrinking. Here's how cities fund climate resilience with dedicated revenue, blended finance, and a coordinating authority.
The ESG Blind Spot: How AI Is Finding Risks in Companies Nobody Else Is Watching
Norway's sovereign wealth fund uses AI to screen 7,200 portfolio companies for forced labor and corruption within 24 hours. The real story is the emerging-market coverage gap that traditional ESG data vendors miss — and what it means for any company with a global supply chain.
FAQ
01
What does it really mean to “redefine profit”?
02
What makes Council Fire different?
03
Who does Council Fire work with?
04
What does working with Council Fire actually look like?
05
How does Council Fire help organizations turn big goals into action?
06
How does Council Fire define and measure success?
07
How does technology fit into Council Fire’s work?
Aug 26, 2026
Climate Risk Compliance: 7 Assessment Steps
ESG Strategy
In This Article
Seven-step annual process to assess and disclose climate risks: scope, materiality, mapping, scenarios, metrics, controls, and audit-ready filings.
Climate Risk Compliance: 7 Assessment Steps
If I want climate risk work to hold up in reporting, audit, and board review, I need a process I can run every year - not a one-time exercise. This article boils that process down to 7 steps: define scope, pick material topics, map exposure, test scenarios, choose metrics, check controls, and draft disclosures.
Here’s the short version:
I start by deciding what parts of the business the review covers.
I sort climate issues into physical risk, transition risk, and opportunity.
I link those issues to sites, suppliers, and logistics points.
I test hot spots against 2030, 2040, and 2050 scenarios.
I choose metrics tied to cost, downtime, emissions, and supplier exposure.
I confirm board oversight, executive ownership, and review controls.
I keep source data, logs, approvals, and disclosure files in one place.
A few facts stand out. The article notes $162 billion in global natural-catastrophe losses in the first half of 2025 alone. It also centers U.S. reporting needs tied to IFRS S2, TCFD, and SEC climate disclosure expectations.
What I take from it is simple: good climate compliance is less about one report and more about a repeatable yearly workflow tied to Q1–Q4 planning, finance, risk, and board review.
7-Step Climate Risk Compliance Assessment Process
Steps 1-2: Set scope and confirm material climate topics
Step 1: Define the assessment scope
Before you gather data or score risk, set the boundaries. If the scope is fuzzy, teams can spend weeks studying the wrong assets or miss the exposures that matter most.
A solid scope answers six basic questions. Which legal entities and business units are included? Which operating locations matter most? How far should value chain coverage go - upstream to suppliers, downstream to customers? What time horizons apply? What will the results be used for? And what level of evidence will audit or assurance expect?
For time horizons, short-term usually means 0–3 years, medium-term covers 3–10 years, and long-term stretches beyond 10 years toward policy markers such as 2030 and 2050. These ranges should line up with capital planning cycles and reporting timelines.
One choice that often slips through the cracks is governance ownership. Put a named senior leader in charge - CFO, CRO, or CSO - and confirm which board committee oversees the work. That keeps the process tied to SEC governance disclosure expectations and broader board risk oversight.
Use this table to weigh narrow and broad scope options.
Narrow Scope | Broad Scope | |
|---|---|---|
Organizational coverage | SEC registrant and core U.S. operations | Registrant plus global subsidiaries and joint ventures |
Value chain coverage | Owned/leased facilities only | Key upstream suppliers and downstream customer segments |
Time horizons | Short- to medium-term | Short-, medium-, and long-term aligned with 2050 decarbonization pathways |
Risk types analyzed | Major physical risks for critical assets | Physical risks, transition risks, and opportunities |
Data requirements | Lower; relies on internal asset and operations data | Higher; requires external climate data providers and supplier input |
Pros | Faster to execute, lower cost, easier to document | Richer strategic insight, stronger alignment with TCFD/ISSB and investor expectations |
Cons | Potential blind spots in value chain; weaker long-term strategy alignment | More resource-intensive; higher coordination demands across functions |
Best for | Smaller registrants, early-stage programs, or single-business-unit pilots | Mature ESG programs, climate-exposed sectors, and organizations preparing for assurance |
Scope choices shape everything that follows: what gets mapped, what gets modeled, and what ends up in disclosure. Once those lines are set, the job becomes much simpler: sort the issues that matter from the background noise.
Step 2: Identify material climate topics
Use the scope as your filter. Place each issue into one of three buckets: physical risk, transition risk, or opportunity. Then narrow the list to topics that could affect strategy, operations, cash flow, access to capital, or disclosure.
Physical Risks | Transition Risks | Opportunities | |
|---|---|---|---|
Definition | Acute events (floods, hurricanes, wildfires) and chronic shifts (sea-level rise, temperature increase, drought) | Policy/legal changes, technology disruption, market demand shifts, and reputational pressure | Efficiency gains, new low-carbon products/services, access to green finance, resilient infrastructure |
ERM category | Operational, financial | Legal/regulatory, reputational, financial | Strategic, financial |
Example U.S. business impacts | Gulf Coast facility flooding, wildfire-driven supply chain disruption, higher insurance premiums | State clean energy mandates affecting utility revenue, carbon pricing increasing input costs, stranded fossil-fuel assets | Revenue from energy-efficient building materials, lower operating costs from electrification, improved credit terms from green lenders |
Common metrics | Expected annual loss (EAL), number of high-risk assets, days of production downtime | Carbon intensity, regulatory compliance costs, % revenue from high-emissions products | Low-carbon revenue share, emissions avoided, payback period on resilience investments |
After that mapping step, score each risk and opportunity by likelihood and severity using your current ERM method. Focus first on topics that could affect financial statements, strategy, or compliance duties under U.S. securities law and IFRS S1/S2.
Not every topic will make the cut, and that’s fine. Items that do not meet the threshold can still be logged as reviewed but not prioritized. That record helps support a defensible audit trail.
Once the material topics are ranked, map them to the assets and suppliers they affect.
Steps 3-5: Map exposures, run scenarios, and choose metrics
Step 3: Map assets and supply chains to climate exposure
Once you've ranked the material topics, the next move is to connect each one to the sites and suppliers it touches. Start with a clear inventory of owned sites, leased sites, key suppliers, logistics nodes, and any single-source dependencies. From there, map each site or supplier to both physical and transition risks.
On the physical side, flag exposure to flooding, extreme heat, wildfire, drought, hurricanes, and storm surge. On the transition side, look at carbon pricing, tighter policy, technology substitution, and shifts in market demand. A coastal distribution center, for example, may be dealing with storm surge risk at the same time that transport costs climb because of fuel prices or stricter emissions rules.
Not every exposure deserves the same level of attention. Push the most critical and most vulnerable items to the top of the review list. That usually includes revenue-generating facilities, assets that are hard to replace, and single-source suppliers located in high-hazard zones.
Local input matters here. A map can show exposure, but local teams often know what the map misses. Levees, backup power, or supplier diversification can change the risk picture in a material way. It also helps to document your data sources, location precision, and any proxies used when exact coordinates aren't available. That paper trail will matter later.
Use a heatmap to bring the full picture together. Combine hazard severity, likelihood, criticality, and time horizon in one view, then use that heatmap as the baseline for scenario testing.
Step 4: Apply climate scenarios
With the Step 3 hot spots flagged, test them against more than one future. Scenario analysis helps you see how sites and suppliers might hold up under a range of plausible conditions. Keep the time frames tied to planning cycles and asset life: near term (2030), mid-term (2040), and long term (2050).
Scenario Type | Core Assumptions | Likely Use Case | Type of Impact Assessed |
|---|---|---|---|
Orderly (e.g., Net Zero 2050) | Early, coordinated policy action; warming around 1.5°C to 1.7°C | Long-term investment strategy, decarbonization planning | Lower transition risk; lower physical risk |
Disorderly (e.g., Delayed Transition) | Delayed policy action, then abrupt tightening; warming around 1.5°C to 1.8°C | Stress-testing carbon cost exposure and stranded assets | High transition risk; moderate physical risk |
Higher-Warming (Current Policies) | Limited mitigation; warming above 3°C | Physical resilience of operations, supply chains, and infrastructure | Severe physical risk; lower transition risk |
For each scenario, document the effect on operations, supply chains, revenue, capital spending, insurance, and adaptation priorities. Be plain about the limits of the analysis. If supplier geolocation is incomplete or hazard projections carry uncertainty, say so. Leaders need to know which estimates are solid and which are more directional.
That distinction is important because the scenario output feeds directly into Step 5. If the scenario work shows that carbon cost exposure is the big pressure point, your metrics should reflect that. If physical disruption is the bigger issue, the metric set should lean that way instead.
Step 5: Select climate risk metrics and targets
Pick metrics that help people make decisions, not metrics that just fill out a disclosure table. Each metric should answer a usable question. Which site needs adaptation first? What happens to financial exposure if carbon prices go up?
Use current-state metrics to show today's exposure, and pair them with forward-looking indicators that show scenario impact. The goal is simple: measure the risks you identified in Steps 3 and 4 in a way that management can act on.
Key Risk | Financial / Operational Impact | Selected Metric | Target or Threshold | Data Source | Reporting Owner |
|---|---|---|---|---|---|
Coastal flooding at warehouse network | Service disruption, higher logistics costs | % of warehousing capacity in high-flood zones | Reduce high-risk exposure over time | Geospatial hazard data, asset register | Operations |
Supplier transition risk | Higher input costs, supply interruption | Share of spend with high-emitting suppliers | Increase supplier emissions coverage and set supplier targets | Supplier surveys, procurement records | Procurement |
Carbon pricing exposure | Rising input and compliance costs | Scope 1, 2, and 3 emissions (tCO₂e) | Interim and long-term emissions reduction milestones | Utility bills, ERP systems | Finance / Sustainability |
Extreme heat at manufacturing sites | Labor productivity loss, operational disruption | % of manufacturing capacity in high-heat zones | Track adaptation progress and reduce exposure | Climate projections, facility data | Operations |
Each metric should trace back to a material risk, a disclosure requirement, or a management target. Record the source for each one so reporting stays audit-ready. That source tracking also makes year-over-year comparisons easier to defend. From there, the next step is to confirm that the metrics have clear ownership, proper controls, and disclosure readiness.
Steps 6-7: Review controls and draft disclosures
Step 6: Review governance, processes, and controls
Once the metrics are in place, test the controls around them. Before you lock in findings, check who oversees the work at the board level, who owns it at the executive level, and how issues move up the chain. In sectors with high exposure, climate risk often goes to review every quarter.
A named C-suite leader - CFO, CRO, CSO, or COO - should have climate risk management written into performance goals and tied to incentive plans. Under that, a risk committee or ESG steering group should link climate risk to the broader enterprise risk management (ERM) framework. It belongs inside ERM, not off to the side.
Escalation thresholds also need to be spelled out. If scenario analysis points to a financial hit or supply chain exposure that goes past risk appetite, there should be a documented route to management or board review. Climate-risk sign-off should also be required for material capital projects and material supplier contracts.
For this step, the document package should include:
A methodology memo
Model assumption logs
Version control records
Internal review sign-offs from risk, finance, legal/compliance, and sustainability teams
The World Bank recommends that internal audit periodically review climate-related data collection, risk registers, policies, procedures, and controls, and report results to the audit committee. [4]
With the controls checked, the next move is simple: use that same evidence in the disclosure draft.
Step 7: Draft disclosures and maintain audit-ready files
Build disclosures around governance, strategy, risk management, and metrics and targets. IFRS S2 requires disclosure of the governance processes, controls, and procedures used to monitor, manage, and oversee climate-related risks and opportunities. [2] [6] The SEC's climate-related disclosure expectations follow a similar pattern, with one added point: disclosure controls must make sure required information is recorded, processed, summarized, and reported on time. [3]
Use one central repository so each disclosed metric can be traced back to source data, transformations, models, and checks. That helps keep old spreadsheet data from slipping into the narrative. KPMG advises boards and audit committees to have management reassess internal controls and disclosure controls and procedures for climate disclosures in both SEC filings and voluntary sustainability reports, which lowers the risk of mixed messages across channels. [5]
Use this checklist to sign off on controls and disclosures.
Assessment Step | Required Documentation | Governance Approver | Disclosure Reference |
|---|---|---|---|
6. Review controls | Internal control coverage report, escalation procedures, internal audit review | Internal Audit / Board | Governance, Risk Management |
7. Draft disclosures | Final disclosure narrative, traceability log, board/legal approval | Board of Directors / Legal | All four pillars |
Retain source data, calculation logs, board minutes, policy approvals, and change histories.
ESG quick play: Mastering climate risk: Your path to global compliance
Conclusion: Make the 7-step checklist part of your annual ESG reporting cycle
Run the seven-step process every year so your scope, scenarios, metrics, controls, and disclosures stay up to date. The key is simple: tie each step to the same operating calendar each year.
Map the work to your annual reporting cycle. Scope and materiality reviews fit well in Q1 strategy and risk sessions. Asset mapping and scenario updates line up with Q2 capital planning. Metric and target reviews make sense in Q3 alongside financial planning. Control testing and disclosure drafting belong in Q4, ahead of SEC filings and annual ESG reports. For U.S. teams, it also helps to line this up with 10-K prep, risk committee review, and internal audit.
That rhythm matters because climate losses are already material. Global economic losses from natural catastrophes reached $162 billion in the first half of 2025 alone. [7] That kind of number is hard to brush aside. It points to the kind of impairments, disruptions, and earnings pressure that can hit a business when risk reviews lag behind reality.
The next move is turning assessment results into decisions. Use each annual cycle to translate findings into capital allocation, supplier choices, and resilience planning. For organizations ready to move from assessment results into concrete action, Council Fire helps turn climate-risk findings into measurable action. [1]
FAQs
How do I decide the right scope?
Start by getting clear on why you're doing the assessment. That one step shapes everything that follows. If the goal is disclosure, you may need a broader view and tighter documentation. If it's for strategic planning, the focus may shift to where risk and opportunity could affect operations, growth, or capital allocation. If you're using it for investment analysis, the scope should line up with the factors that matter most to financial performance and portfolio decisions.
From there, define the boundaries of the assessment in plain terms:
Organizational boundaries: Decide which business units, subsidiaries, joint ventures, or assets are included.
Geographic scope: Set the locations, regions, or markets the assessment will cover.
Value chain dependencies: Map the upstream and downstream relationships that could affect exposure, from suppliers to customers and logistics partners.
Time horizons: Use short-term (1–3 years), medium-term (3–10 years), and long-term (10–30+ years) views so today's decisions aren't cut off from what may hit later.
A tight scope keeps the work useful. Too narrow, and you miss material issues. Too broad, and the assessment turns into a catch-all that doesn't help anyone make decisions.
Which climate risks are usually material first?
It depends on the framework a company uses.
Under financial materiality standards like the ISSB, a risk is material if it could reasonably affect enterprise value or influence investor decisions. The focus is narrow and finance-led: does this issue matter to the business and the people putting money into it?
Under double materiality frameworks like the CSRD, the lens is broader. Companies look at both sides of the equation: the financial effects on the business and the company’s impacts on people and the planet.
In day-to-day practice, most companies put physical and transition risks at the top of the list when those risks show medium or high financial magnitude and show a moderate likelihood of happening within a five-year time horizon.
What evidence should I keep for audit readiness?
Keep a clear evidence trail that backs up your process, methodology, and data integrity.
That means holding onto the records that show how decisions were made, what data was used, and how reported numbers were checked. If someone reviews your work later - whether it’s leadership, auditors, investors, or regulators - the file should tell a clear story from start to finish.
Include support such as:
Governance records, including board and management meeting minutes
Materiality assessment records, including stakeholders, criteria, thresholds, and rationale
Climate risk methodology, assumptions, scenario inputs, and limitations
Support for reported metrics, internal controls, and links to financial reporting
Think of this as your paper trail. If a figure appears in a report, you should be able to trace it back to its source. If a climate risk judgment was made, the assumptions behind it should be easy to find. That kind of discipline doesn’t just help with review - it makes the whole reporting process easier to defend and easier to repeat.
Related Blog Posts
Latest Articles
©2026
Narrative Change and Power Building: The Missing Half of Advocacy
Narrative change is the process of disrupting dominant narratives that normalize inequity and advancing new narratives from historically marginalized communities.
Funding Resilience Without Federal Grants
BRIC is unreliable and FEMA is shrinking. Here's how cities fund climate resilience with dedicated revenue, blended finance, and a coordinating authority.
The ESG Blind Spot: How AI Is Finding Risks in Companies Nobody Else Is Watching
Norway's sovereign wealth fund uses AI to screen 7,200 portfolio companies for forced labor and corruption within 24 hours. The real story is the emerging-market coverage gap that traditional ESG data vendors miss — and what it means for any company with a global supply chain.
FAQ
01
What does it really mean to “redefine profit”?
02
What makes Council Fire different?
03
Who does Council Fire work with?
04
What does working with Council Fire actually look like?
05
How does Council Fire help organizations turn big goals into action?
06
How does Council Fire define and measure success?
07
How does technology fit into Council Fire’s work?
Aug 26, 2026
Climate Risk Compliance: 7 Assessment Steps
ESG Strategy
In This Article
Seven-step annual process to assess and disclose climate risks: scope, materiality, mapping, scenarios, metrics, controls, and audit-ready filings.
Climate Risk Compliance: 7 Assessment Steps
If I want climate risk work to hold up in reporting, audit, and board review, I need a process I can run every year - not a one-time exercise. This article boils that process down to 7 steps: define scope, pick material topics, map exposure, test scenarios, choose metrics, check controls, and draft disclosures.
Here’s the short version:
I start by deciding what parts of the business the review covers.
I sort climate issues into physical risk, transition risk, and opportunity.
I link those issues to sites, suppliers, and logistics points.
I test hot spots against 2030, 2040, and 2050 scenarios.
I choose metrics tied to cost, downtime, emissions, and supplier exposure.
I confirm board oversight, executive ownership, and review controls.
I keep source data, logs, approvals, and disclosure files in one place.
A few facts stand out. The article notes $162 billion in global natural-catastrophe losses in the first half of 2025 alone. It also centers U.S. reporting needs tied to IFRS S2, TCFD, and SEC climate disclosure expectations.
What I take from it is simple: good climate compliance is less about one report and more about a repeatable yearly workflow tied to Q1–Q4 planning, finance, risk, and board review.
7-Step Climate Risk Compliance Assessment Process
Steps 1-2: Set scope and confirm material climate topics
Step 1: Define the assessment scope
Before you gather data or score risk, set the boundaries. If the scope is fuzzy, teams can spend weeks studying the wrong assets or miss the exposures that matter most.
A solid scope answers six basic questions. Which legal entities and business units are included? Which operating locations matter most? How far should value chain coverage go - upstream to suppliers, downstream to customers? What time horizons apply? What will the results be used for? And what level of evidence will audit or assurance expect?
For time horizons, short-term usually means 0–3 years, medium-term covers 3–10 years, and long-term stretches beyond 10 years toward policy markers such as 2030 and 2050. These ranges should line up with capital planning cycles and reporting timelines.
One choice that often slips through the cracks is governance ownership. Put a named senior leader in charge - CFO, CRO, or CSO - and confirm which board committee oversees the work. That keeps the process tied to SEC governance disclosure expectations and broader board risk oversight.
Use this table to weigh narrow and broad scope options.
Narrow Scope | Broad Scope | |
|---|---|---|
Organizational coverage | SEC registrant and core U.S. operations | Registrant plus global subsidiaries and joint ventures |
Value chain coverage | Owned/leased facilities only | Key upstream suppliers and downstream customer segments |
Time horizons | Short- to medium-term | Short-, medium-, and long-term aligned with 2050 decarbonization pathways |
Risk types analyzed | Major physical risks for critical assets | Physical risks, transition risks, and opportunities |
Data requirements | Lower; relies on internal asset and operations data | Higher; requires external climate data providers and supplier input |
Pros | Faster to execute, lower cost, easier to document | Richer strategic insight, stronger alignment with TCFD/ISSB and investor expectations |
Cons | Potential blind spots in value chain; weaker long-term strategy alignment | More resource-intensive; higher coordination demands across functions |
Best for | Smaller registrants, early-stage programs, or single-business-unit pilots | Mature ESG programs, climate-exposed sectors, and organizations preparing for assurance |
Scope choices shape everything that follows: what gets mapped, what gets modeled, and what ends up in disclosure. Once those lines are set, the job becomes much simpler: sort the issues that matter from the background noise.
Step 2: Identify material climate topics
Use the scope as your filter. Place each issue into one of three buckets: physical risk, transition risk, or opportunity. Then narrow the list to topics that could affect strategy, operations, cash flow, access to capital, or disclosure.
Physical Risks | Transition Risks | Opportunities | |
|---|---|---|---|
Definition | Acute events (floods, hurricanes, wildfires) and chronic shifts (sea-level rise, temperature increase, drought) | Policy/legal changes, technology disruption, market demand shifts, and reputational pressure | Efficiency gains, new low-carbon products/services, access to green finance, resilient infrastructure |
ERM category | Operational, financial | Legal/regulatory, reputational, financial | Strategic, financial |
Example U.S. business impacts | Gulf Coast facility flooding, wildfire-driven supply chain disruption, higher insurance premiums | State clean energy mandates affecting utility revenue, carbon pricing increasing input costs, stranded fossil-fuel assets | Revenue from energy-efficient building materials, lower operating costs from electrification, improved credit terms from green lenders |
Common metrics | Expected annual loss (EAL), number of high-risk assets, days of production downtime | Carbon intensity, regulatory compliance costs, % revenue from high-emissions products | Low-carbon revenue share, emissions avoided, payback period on resilience investments |
After that mapping step, score each risk and opportunity by likelihood and severity using your current ERM method. Focus first on topics that could affect financial statements, strategy, or compliance duties under U.S. securities law and IFRS S1/S2.
Not every topic will make the cut, and that’s fine. Items that do not meet the threshold can still be logged as reviewed but not prioritized. That record helps support a defensible audit trail.
Once the material topics are ranked, map them to the assets and suppliers they affect.
Steps 3-5: Map exposures, run scenarios, and choose metrics
Step 3: Map assets and supply chains to climate exposure
Once you've ranked the material topics, the next move is to connect each one to the sites and suppliers it touches. Start with a clear inventory of owned sites, leased sites, key suppliers, logistics nodes, and any single-source dependencies. From there, map each site or supplier to both physical and transition risks.
On the physical side, flag exposure to flooding, extreme heat, wildfire, drought, hurricanes, and storm surge. On the transition side, look at carbon pricing, tighter policy, technology substitution, and shifts in market demand. A coastal distribution center, for example, may be dealing with storm surge risk at the same time that transport costs climb because of fuel prices or stricter emissions rules.
Not every exposure deserves the same level of attention. Push the most critical and most vulnerable items to the top of the review list. That usually includes revenue-generating facilities, assets that are hard to replace, and single-source suppliers located in high-hazard zones.
Local input matters here. A map can show exposure, but local teams often know what the map misses. Levees, backup power, or supplier diversification can change the risk picture in a material way. It also helps to document your data sources, location precision, and any proxies used when exact coordinates aren't available. That paper trail will matter later.
Use a heatmap to bring the full picture together. Combine hazard severity, likelihood, criticality, and time horizon in one view, then use that heatmap as the baseline for scenario testing.
Step 4: Apply climate scenarios
With the Step 3 hot spots flagged, test them against more than one future. Scenario analysis helps you see how sites and suppliers might hold up under a range of plausible conditions. Keep the time frames tied to planning cycles and asset life: near term (2030), mid-term (2040), and long term (2050).
Scenario Type | Core Assumptions | Likely Use Case | Type of Impact Assessed |
|---|---|---|---|
Orderly (e.g., Net Zero 2050) | Early, coordinated policy action; warming around 1.5°C to 1.7°C | Long-term investment strategy, decarbonization planning | Lower transition risk; lower physical risk |
Disorderly (e.g., Delayed Transition) | Delayed policy action, then abrupt tightening; warming around 1.5°C to 1.8°C | Stress-testing carbon cost exposure and stranded assets | High transition risk; moderate physical risk |
Higher-Warming (Current Policies) | Limited mitigation; warming above 3°C | Physical resilience of operations, supply chains, and infrastructure | Severe physical risk; lower transition risk |
For each scenario, document the effect on operations, supply chains, revenue, capital spending, insurance, and adaptation priorities. Be plain about the limits of the analysis. If supplier geolocation is incomplete or hazard projections carry uncertainty, say so. Leaders need to know which estimates are solid and which are more directional.
That distinction is important because the scenario output feeds directly into Step 5. If the scenario work shows that carbon cost exposure is the big pressure point, your metrics should reflect that. If physical disruption is the bigger issue, the metric set should lean that way instead.
Step 5: Select climate risk metrics and targets
Pick metrics that help people make decisions, not metrics that just fill out a disclosure table. Each metric should answer a usable question. Which site needs adaptation first? What happens to financial exposure if carbon prices go up?
Use current-state metrics to show today's exposure, and pair them with forward-looking indicators that show scenario impact. The goal is simple: measure the risks you identified in Steps 3 and 4 in a way that management can act on.
Key Risk | Financial / Operational Impact | Selected Metric | Target or Threshold | Data Source | Reporting Owner |
|---|---|---|---|---|---|
Coastal flooding at warehouse network | Service disruption, higher logistics costs | % of warehousing capacity in high-flood zones | Reduce high-risk exposure over time | Geospatial hazard data, asset register | Operations |
Supplier transition risk | Higher input costs, supply interruption | Share of spend with high-emitting suppliers | Increase supplier emissions coverage and set supplier targets | Supplier surveys, procurement records | Procurement |
Carbon pricing exposure | Rising input and compliance costs | Scope 1, 2, and 3 emissions (tCO₂e) | Interim and long-term emissions reduction milestones | Utility bills, ERP systems | Finance / Sustainability |
Extreme heat at manufacturing sites | Labor productivity loss, operational disruption | % of manufacturing capacity in high-heat zones | Track adaptation progress and reduce exposure | Climate projections, facility data | Operations |
Each metric should trace back to a material risk, a disclosure requirement, or a management target. Record the source for each one so reporting stays audit-ready. That source tracking also makes year-over-year comparisons easier to defend. From there, the next step is to confirm that the metrics have clear ownership, proper controls, and disclosure readiness.
Steps 6-7: Review controls and draft disclosures
Step 6: Review governance, processes, and controls
Once the metrics are in place, test the controls around them. Before you lock in findings, check who oversees the work at the board level, who owns it at the executive level, and how issues move up the chain. In sectors with high exposure, climate risk often goes to review every quarter.
A named C-suite leader - CFO, CRO, CSO, or COO - should have climate risk management written into performance goals and tied to incentive plans. Under that, a risk committee or ESG steering group should link climate risk to the broader enterprise risk management (ERM) framework. It belongs inside ERM, not off to the side.
Escalation thresholds also need to be spelled out. If scenario analysis points to a financial hit or supply chain exposure that goes past risk appetite, there should be a documented route to management or board review. Climate-risk sign-off should also be required for material capital projects and material supplier contracts.
For this step, the document package should include:
A methodology memo
Model assumption logs
Version control records
Internal review sign-offs from risk, finance, legal/compliance, and sustainability teams
The World Bank recommends that internal audit periodically review climate-related data collection, risk registers, policies, procedures, and controls, and report results to the audit committee. [4]
With the controls checked, the next move is simple: use that same evidence in the disclosure draft.
Step 7: Draft disclosures and maintain audit-ready files
Build disclosures around governance, strategy, risk management, and metrics and targets. IFRS S2 requires disclosure of the governance processes, controls, and procedures used to monitor, manage, and oversee climate-related risks and opportunities. [2] [6] The SEC's climate-related disclosure expectations follow a similar pattern, with one added point: disclosure controls must make sure required information is recorded, processed, summarized, and reported on time. [3]
Use one central repository so each disclosed metric can be traced back to source data, transformations, models, and checks. That helps keep old spreadsheet data from slipping into the narrative. KPMG advises boards and audit committees to have management reassess internal controls and disclosure controls and procedures for climate disclosures in both SEC filings and voluntary sustainability reports, which lowers the risk of mixed messages across channels. [5]
Use this checklist to sign off on controls and disclosures.
Assessment Step | Required Documentation | Governance Approver | Disclosure Reference |
|---|---|---|---|
6. Review controls | Internal control coverage report, escalation procedures, internal audit review | Internal Audit / Board | Governance, Risk Management |
7. Draft disclosures | Final disclosure narrative, traceability log, board/legal approval | Board of Directors / Legal | All four pillars |
Retain source data, calculation logs, board minutes, policy approvals, and change histories.
ESG quick play: Mastering climate risk: Your path to global compliance
Conclusion: Make the 7-step checklist part of your annual ESG reporting cycle
Run the seven-step process every year so your scope, scenarios, metrics, controls, and disclosures stay up to date. The key is simple: tie each step to the same operating calendar each year.
Map the work to your annual reporting cycle. Scope and materiality reviews fit well in Q1 strategy and risk sessions. Asset mapping and scenario updates line up with Q2 capital planning. Metric and target reviews make sense in Q3 alongside financial planning. Control testing and disclosure drafting belong in Q4, ahead of SEC filings and annual ESG reports. For U.S. teams, it also helps to line this up with 10-K prep, risk committee review, and internal audit.
That rhythm matters because climate losses are already material. Global economic losses from natural catastrophes reached $162 billion in the first half of 2025 alone. [7] That kind of number is hard to brush aside. It points to the kind of impairments, disruptions, and earnings pressure that can hit a business when risk reviews lag behind reality.
The next move is turning assessment results into decisions. Use each annual cycle to translate findings into capital allocation, supplier choices, and resilience planning. For organizations ready to move from assessment results into concrete action, Council Fire helps turn climate-risk findings into measurable action. [1]
FAQs
How do I decide the right scope?
Start by getting clear on why you're doing the assessment. That one step shapes everything that follows. If the goal is disclosure, you may need a broader view and tighter documentation. If it's for strategic planning, the focus may shift to where risk and opportunity could affect operations, growth, or capital allocation. If you're using it for investment analysis, the scope should line up with the factors that matter most to financial performance and portfolio decisions.
From there, define the boundaries of the assessment in plain terms:
Organizational boundaries: Decide which business units, subsidiaries, joint ventures, or assets are included.
Geographic scope: Set the locations, regions, or markets the assessment will cover.
Value chain dependencies: Map the upstream and downstream relationships that could affect exposure, from suppliers to customers and logistics partners.
Time horizons: Use short-term (1–3 years), medium-term (3–10 years), and long-term (10–30+ years) views so today's decisions aren't cut off from what may hit later.
A tight scope keeps the work useful. Too narrow, and you miss material issues. Too broad, and the assessment turns into a catch-all that doesn't help anyone make decisions.
Which climate risks are usually material first?
It depends on the framework a company uses.
Under financial materiality standards like the ISSB, a risk is material if it could reasonably affect enterprise value or influence investor decisions. The focus is narrow and finance-led: does this issue matter to the business and the people putting money into it?
Under double materiality frameworks like the CSRD, the lens is broader. Companies look at both sides of the equation: the financial effects on the business and the company’s impacts on people and the planet.
In day-to-day practice, most companies put physical and transition risks at the top of the list when those risks show medium or high financial magnitude and show a moderate likelihood of happening within a five-year time horizon.
What evidence should I keep for audit readiness?
Keep a clear evidence trail that backs up your process, methodology, and data integrity.
That means holding onto the records that show how decisions were made, what data was used, and how reported numbers were checked. If someone reviews your work later - whether it’s leadership, auditors, investors, or regulators - the file should tell a clear story from start to finish.
Include support such as:
Governance records, including board and management meeting minutes
Materiality assessment records, including stakeholders, criteria, thresholds, and rationale
Climate risk methodology, assumptions, scenario inputs, and limitations
Support for reported metrics, internal controls, and links to financial reporting
Think of this as your paper trail. If a figure appears in a report, you should be able to trace it back to its source. If a climate risk judgment was made, the assumptions behind it should be easy to find. That kind of discipline doesn’t just help with review - it makes the whole reporting process easier to defend and easier to repeat.
Related Blog Posts
Latest Articles
©2026
Narrative Change and Power Building: The Missing Half of Advocacy
Narrative change is the process of disrupting dominant narratives that normalize inequity and advancing new narratives from historically marginalized communities.
Funding Resilience Without Federal Grants
BRIC is unreliable and FEMA is shrinking. Here's how cities fund climate resilience with dedicated revenue, blended finance, and a coordinating authority.
The ESG Blind Spot: How AI Is Finding Risks in Companies Nobody Else Is Watching
Norway's sovereign wealth fund uses AI to screen 7,200 portfolio companies for forced labor and corruption within 24 hours. The real story is the emerging-market coverage gap that traditional ESG data vendors miss — and what it means for any company with a global supply chain.
FAQ
What does it really mean to “redefine profit”?
What makes Council Fire different?
Who does Council Fire work with?
What does working with Council Fire actually look like?
How does Council Fire help organizations turn big goals into action?
How does Council Fire define and measure success?
How does technology fit into Council Fire’s work?