
Aug 3, 2026
5 Capital Allocation Models For Net-Zero Goals
Sustainability Strategy
In This Article
Five capital-allocation models to fund net-zero: phased retrofits, portfolio rebalancing, carbon pricing, reserves, and blended finance.
5 Capital Allocation Models For Net-Zero Goals
Net-zero planning is a capital allocation problem first. If I need to fund emissions cuts without blowing up budgets, the article points to five main models: phased retrofit funding, portfolio rebalancing, internal carbon pricing, transition reserve funds, and blended capital stacks.
Here’s the short version in plain English:
Phased retrofit funding works when I need to spread building upgrades across normal replacement cycles.
Portfolio rebalancing fits when the main lever is shifting money away from higher-emissions assets over time.
Internal carbon pricing helps when project approval is the choke point and I want carbon costs inside NPV and IRR models.
Transition reserve funds make sense when decarbonization needs a dedicated multi-year pool of cash.
Blended capital stacks help close gaps when a project cannot stand on commercial financing alone.
A few numbers show the range of outcomes. In one city retrofit program, 271 buildings saw 23% lower electricity use and 46% lower natural gas use. In portfolio work, a 10% yearly drop in carbon intensity over 16 years could cut intensity by about 81%. In internal carbon pricing, one company used its fee system to support more than 10 billion kWh of green power and cut 7.5 million metric tons CO₂e.
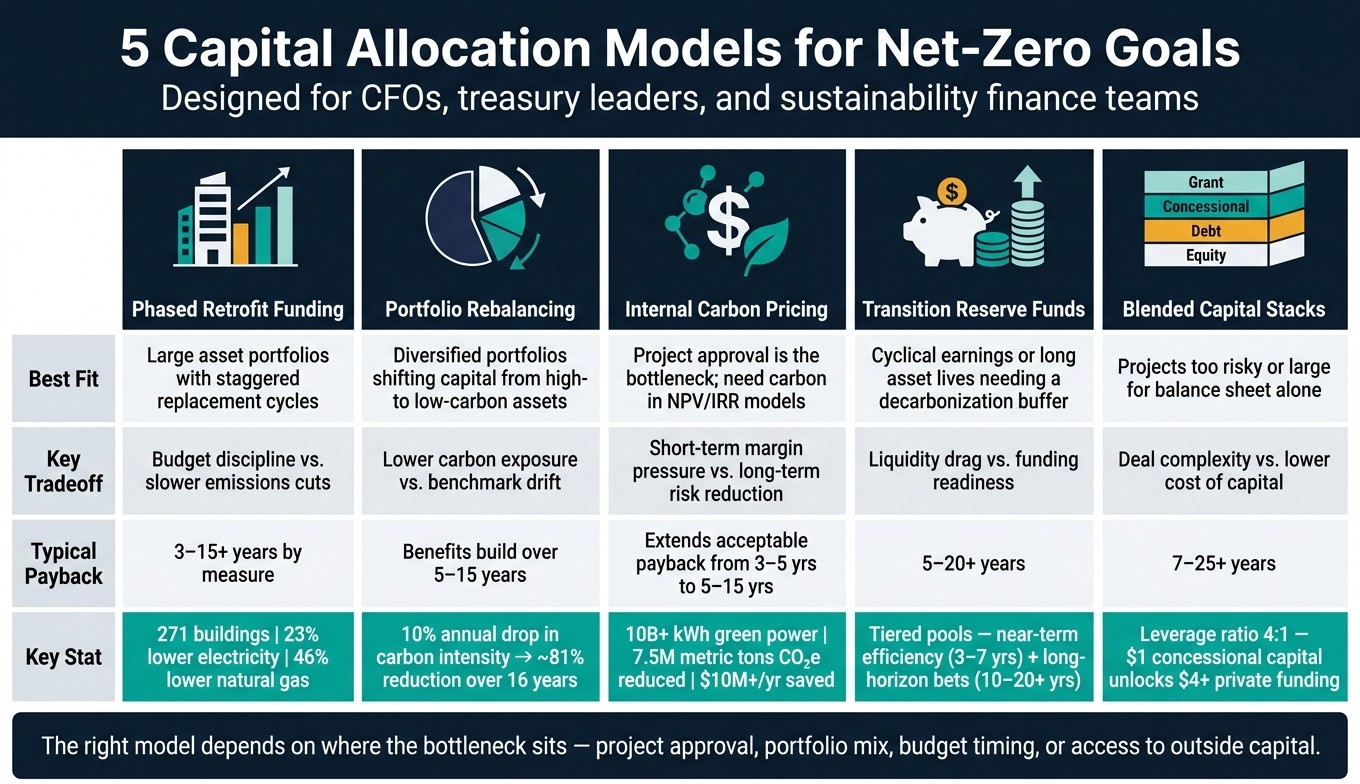
5 Capital Allocation Models for Net-Zero Goals: Side-by-Side Comparison
Phenix Virtual InvestorConnect- Aligning Portfolios with Net-Zero: Implications for Asset Allocation

Quick Comparison
Model | Best when I need to... | Main tradeoff | Time horizon |
|---|---|---|---|
Phased Retrofit Funding | Stage upgrades over budget cycles | Lower annual spend vs. slower emissions cuts | Often 3–15+ years by measure |
Portfolio Rebalancing | Shift capital at the portfolio level | Lower carbon exposure vs. benchmark drift | Review-cycle based; impact builds over 5–15 years |
Internal Carbon Pricing | Change project selection rules | Near-term margin pressure vs. lower transition risk | Often helps with projects in the 3–15 year range |
Transition Reserve Funds | Set aside money for future decarbonization | Liquidity drag vs. funding readiness | Often 5–20+ years |
Blended Capital Stacks | Finance projects that need outside support | Lower cost of capital vs. deal complexity | Often 7–25+ years |
If I strip the article down to one point, it’s this: the right model depends on where the bottleneck sits - project approval, portfolio mix, budget timing, or access to outside capital.
1. Phased Retrofit Funding
Phased retrofit funding lines up retrofits with normal replacement cycles. Instead of paying for a full building overhaul all at once, you split the work into smaller investment tranches tied to natural replacement points - when a boiler reaches end of life, a roof needs replacing, or a lease turns over. Money that would have gone to maintenance or replacement anyway gets redirected into retrofit work and moves the building closer to net zero.
Best Fit
This model fits large portfolios with varied building ages, tight annual budgets, and assets where disruption needs careful handling. That often means university campuses, corporate real estate portfolios, hospitals, or municipal building inventories. The City of Houston used phased retrofits across 271 buildings totaling 11 million square feet, cutting electricity use by 23%, natural gas use by 46%, and producing a 14.6-year simple payback.[3]
Key Tradeoff
The main tradeoff is budget flexibility versus faster emissions cuts. Phasing spreads risk across time, gives teams a chance to learn from early phases, and keeps annual budgets from spiking. The downside is plain enough: high-emitting equipment stays in service longer, so emissions and fuel costs keep running until later phases are done.
There’s also timing risk. Later phases may face shifts in energy prices, incentives, or rules. Scenario analysis can help finance leaders compare a phased path with a front-loaded plan and put numbers around that gap before they commit.
Typical Payback Timing
Payback varies a lot by measure:
Controls optimization and retro-commissioning often pay back in a little over a year.
LED lighting and basic controls usually land in the 2–5 year range.
HVAC optimization and advanced controls often run 3–7 years.
Heat pump conversions and major mechanical replacements can stretch to 7–15+ years, though U.S. incentives and utility rebates can shorten that window.
Envelope work - insulation, windows, and roof improvements - often lands in the 10–20+ year range and is more often backed by comfort, resilience, and long-term energy savings than by near-term returns alone.
Primary Finance-Team Use Case
For CFOs and treasurers, phased retrofit funding is mainly a way to smooth the CapEx hump of a net-zero shift without stalling progress. It lets teams match retrofit spending to cash flows, refinancing events, and macro conditions.
A phased plan supported by green bonds or sustainability-linked financing also gives investors a clear path for emissions cuts and may lower financing costs.
When a retrofit program spans more than one asset class, the next lever is portfolio rebalancing.
2. Portfolio Rebalancing
Portfolio rebalancing moves capital out of higher-emitting assets and into lower-carbon or climate-solution assets on a set schedule. The goal is simple: keep portfolio emissions moving along a science-based pathway. This works well when emissions cuts depend more on where money goes than on upgrading one asset at a time.
Best Fit
This model fits organizations that manage diversified portfolios across many asset classes or business units, such as pension funds, endowments, insurers, and companies with several business lines. It’s most useful when the main decarbonization lever is capital allocation itself.
Unlike phased retrofit funding, portfolio rebalancing happens at the governance level. It works through rebalancing cycles and capital drift rules, not project-by-project upgrades. If your team already rebalances on a routine schedule and has asset-level emissions data, climate constraints can slot into that process without changing the whole system.
Key Tradeoff
The main tension is clear: cutting portfolio carbon intensity while still staying close to benchmark returns. Tilting away from high-emitting sectors can increase tracking error, shift style exposures, and affect short-term performance.[4][1][8][9]
Research on benchmark portfolios with declining carbon footprints shows that excluding the top 1%–10% of emitters and reallocating to lower-emitting peers can cut carbon intensity by a large margin with only limited change to overall risk exposure.[10][11] A strategy aimed at a 10% annual drop in portfolio carbon intensity over 16 years could reduce intensity by about 81%, with the first round of rebalancing affecting as little as 11% of the benchmark’s market value.[2][10]
That’s the heart of the tradeoff: gradual, pathway-based tilts tend to cause less disruption than hard exclusions all at once.
Typical Payback Timing
The payoff here is not a neat project payback period. It shows up as lower transition risk and stronger capital resilience over time. Less exposure to stranded assets, carbon pricing, and policy shifts can build value across a 5–15 year horizon as transition risks hit the market.[5][6]
In practice, rebalancing usually lines up with annual or quarterly portfolio review cycles. Progress is tracked against interim milestones - often 2030 targets - rather than one finish line on one date.[1][5][7] Scenario analysis from Allianz Global Investors suggests that climate-aware approaches can move annual returns by about –1.5% to +0.4%, depending on the asset class and scenario.[12]
Primary Finance-Team Use Case
For CIOs, treasurers, and corporate finance teams, portfolio rebalancing is mainly a strategic asset allocation tool. It can be written into investment policy statements as clear carbon-reduction pathways, exclusion thresholds, or tilt rules, alongside usual rebalancing triggers such as drift limits or liquidity needs.
On the corporate side, this can mean moving internal capital budgets toward energy efficiency, electrification, renewables, or other lower-carbon growth areas while shrinking exposure to high-carbon legacy operations. Emissions data and carbon budget metrics then flow into climate risk reporting and help show whether capital allocation is matching net-zero commitments.
When project approval - not portfolio tilt - becomes the main lever, internal carbon pricing comes next.
3. Internal Carbon Pricing
When portfolio rebalancing shifts the asset mix, internal carbon pricing changes something more immediate: which projects make it past the hurdle rate. ICP puts a dollar figure on greenhouse gas emissions - usually $/metric ton of CO₂e - and folds that figure into capital planning, budgeting, and procurement. In practice, it works as a project-level capital allocation tool, not just a pricing label.
Best Fit
ICP tends to work best for medium to large organizations with material Scope 1, 2, and 3 emissions. That usually means groups like manufacturers, logistics operators, data center owners, and commercial real estate portfolios, where long-lived projects are competing for a limited pool of capital.
It also fits best when leadership wants net-zero goals to show up in day-to-day financial choices, not sit off to the side in a separate sustainability plan. The same goes for teams that need to pressure-test capital plans against likely future carbon rules.
Key Tradeoff
The main tension is simple: short-term margin pressure versus long-term risk reduction. If the internal carbon price is set at a meaningful level, emissions-heavy projects can look less attractive in the near term. That can create friction with business units that are measured on near-term cost control or profit targets.
This is where governance matters. About two-thirds of companies that use ICP rely on shadow prices, which makes adoption easier but gives finance less direct control over cash flows. Explicit fees add real budget discipline.[21][22]
Typical Payback Timing
ICP can stretch acceptable payback periods from 3–5 years to 5–15 years by improving carbon-adjusted NPV.[13][14] Once a carbon cost - or an avoided-carbon-cost stream - is added to project cash flows, lower-carbon options can move above the internal hurdle rate.
Microsoft offers a clear example of what this can look like at scale. Its internal carbon fee has enabled the purchase of more than 10 billion kilowatt-hours of green power, reduced emissions by 7.5 million metric tons CO₂e, and saved more than $10 million per year.[18][19][20] The company has also increased its Scope 3 business travel fee to $100 per metric ton CO₂e and plans to keep increasing it each year through FY2030 to reflect rising abatement costs.[17]
Primary Finance-Team Use Case
For finance teams, the core use case is straightforward: add a carbon cost line to project models - metric tons CO₂e × the internal price - and then compare carbon-inclusive NPV and IRR against standard financial metrics.[13][14][15][16] That turns carbon into a routine input for capital approval instead of a separate sustainability screen.
There’s also a funding angle. When business units pay explicit internal charges, those funds can be collected into a central decarbonization pool. Finance can then direct that pool toward priority decarbonization projects, which sets up the logic for transition reserve funds.
4. Transition Reserve Funds
A transition reserve fund is a restricted reserve set aside for decarbonization projects over multiple years. If internal carbon pricing builds a funding pool, this fund gives that money a place to sit until projects are ready to move. It can absorb internal charges, retained cash, or earmarked capital held for later use.[25]
Best Fit
This model fits best in capital-intensive sectors with long asset lives and uncertain transition timelines, often stretching across 5–15 years.[23][29][30] It also works well for companies with uneven cash flows that can’t count on making large one-time decarbonization commitments in a single planning cycle.
That matters in practice. Instead of forcing one big budget hit, finance teams can line up funding with asset replacement cycles and invest as equipment ages out.
Key Tradeoff
The main tradeoff is flexibility versus speed. A reserve keeps options open, but capital that sits idle can slow emissions cuts and may earn less than it would in other uses. On the other hand, this approach can lower stranded-asset risk and improve climate resilience. You’re less likely to sink money into a technology too early, only to find out later that it no longer makes sense.
Typical Payback Timing
Payback varies by project type. Efficiency retrofits often pay back in 3–7 years. Renewable power projects usually land in the 7–15 year range. Deep decarbonization bets can stretch to 10–20+ years.
A tiered reserve can help here:
One pool for near-term efficiency projects
Another pool for longer-horizon strategic bets[24]
Primary Finance-Team Use Case
For finance, the goal is to turn the reserve into a structured, predictable funding mechanism, not just an ad hoc reserve. FP&A sets annual contributions. Treasury manages liquidity and covenants. Sustainability screens which projects qualify. Then a capital committee approves drawdowns against pre-set hurdle rates.[26][27][28]
For projects that need outside capital, the next model is blended capital stacks.
5. Blended Capital Stacks
When internal reserves and carbon charges still leave a funding gap, outside capital often becomes the missing piece.
A blended capital stack brings grants, concessional loans, guarantees, debt, and equity into one financing structure. The idea is simple: use lower-cost or more risk-tolerant capital from governments, foundations, or development finance institutions to make a project investable for private capital.
Each layer plays a different part. Public or philanthropic money often sits in the first-loss layer, taking early losses so commercial lenders face less downside. Development finance institutions may provide subordinated or concessional capital in the middle. Commercial banks and private investors usually take the senior position. If the stack is put together well, leverage ratios of 4:1 or higher are possible. In plain terms, each $1 of concessional capital can help bring in $4 or more in private funding.[31][32]
Best Fit
This model works best for projects that are technically sound but fall short of standard hurdle rates because of risk, timing, or both. Think large-scale building retrofit programs with 10–20 year paybacks, first-of-a-kind clean energy deployments, and resilience assets like flood defenses or grid hardening. Those projects may create major avoided-loss value, even when they do not produce direct revenue in the usual way.
In the U.S., these stacks often combine tax credits, DOE loan guarantees, state green bank capital, grants, program-related investments, and commercial debt or equity. It’s a bit like building a bridge from public-purpose funding to private markets.
Key Tradeoff
The upside is cheaper capital. The cost is complexity.
Blended stacks can reduce WACC and stretch repayment timelines so they line up better with long-lived assets. But that comes with more moving parts. Teams have to line up funders with different mandates, legal terms, and reporting needs. That takes time, deal skill, and steady governance after closing.
There’s another layer to this. Finance teams need solid impact measurement systems. Concessional funders often want verified results, not rough estimates, so teams must track emissions cuts, energy savings, resilience outcomes, and other co-benefits with care.
Typical Payback Timing
Payback usually falls in the 7 to 25 year range, depending on the asset and the way the stack is built.[32] Campus-wide retrofit programs often land in the 8–15 year range when tax credits and concessional financing are part of the mix. Resilience infrastructure is different. It often pays back through avoided losses and lower insurance costs, which means scenario modeling matters more than a standard revenue forecast.
Primary Finance-Team Use Case
For projects that are too large or too risky for the balance sheet alone, finance teams can model the full stack in U.S. dollars, show how each tranche changes IRR and NPV, and compare the blended structure with a fully commercial option.
The work usually splits across functions:
Finance teams model the stack and test deal economics
Sustainability teams track emissions and resilience metrics required by concessional funders
Treasury or project finance teams manage lender relationships and covenant compliance
These deals only work well when treasury, tax, sustainability, and project finance stay tightly aligned.
Side-by-Side Comparison Table
This table helps finance teams line up each model with the problem it solves best. It covers all five capital allocation models so CFOs, treasury leaders, FP&A teams, sustainability finance leads, and investment committees can spot the right fit fast. It also makes it easier to tell project-level tools apart from portfolio-level and financing-structure tools.
Model | Best Fit | Key Tradeoff | Typical Payback Timing | Primary Finance-Team Use Case |
|---|---|---|---|---|
Phased Retrofit Funding | Asset-heavy organizations with predictable CapEx and staggered replacement cycles. | Speed vs. budget discipline. | ~3–10 years. | CapEx sequencing and financing alignment. |
Portfolio Rebalancing | Diversified portfolios or business units that can shift capital from high- to low-carbon activities. | Emissions reduction vs. tracking error and opportunity cost: lower carbon exposure can limit sectors and add short-term tracking error. | At each rebalance cycle; benefits build over 5–15 years. | Portfolio decarbonization and investment-policy updates. |
Internal Carbon Pricing | Organizations with strong FP&A and project approval processes that can absorb carbon costs into investment decisions. | Analytical rigor vs. simplicity and acceptance: stronger decision discipline, but more modeling overhead and potential internal pushback. | Depends on planning cycle; most useful for projects with 3–7 year paybacks. | Project screening using carbon-adjusted NPV and IRR. |
Transition Reserve Funds | Firms with cyclical earnings or transition risk that need a dedicated decarbonization buffer. | Liquidity and earnings vs. preparedness and resilience: capital is unavailable for growth, M&A, or buybacks. | Typically 5–20+ years. | Reserve governance and drawdown discipline. |
Blended Capital Stacks | Projects that are strategic but marginal under conventional financing. | Structuring complexity vs. project viability and scale: more parties and longer closes, but lower cost of capital and broader project viability. | 7–25+ years, with concessional capital and tax credit equity often improving the economics. | Deal structuring and capital-stack coordination. |
Conclusion
No single model works for every situation. The right choice depends on the bottleneck in front of you: the asset type, the pace of decarbonization needed, and how much room you have to move capital.
Use internal carbon pricing when the main issue is project selection. It puts a dollar figure on emissions and makes capital ranking sharper and more disciplined. Net-zero progress comes from moving capital, not just setting targets. When decisions need to happen at the portfolio level, the focus has to shift from project timing to allocation rules.
Reserve funds work best for known future costs. Blended stacks help close funding gaps. Portfolio rebalancing fits diversified holdings. In practice, the strongest net-zero plans use these tools together instead of leaning on just one.
Council Fire helps finance teams turn net-zero commitments into capital plans that hold up under budget and stakeholder scrutiny.
FAQs
How do I choose the right net-zero capital model?
Choose the right net-zero capital model by matching it to your organization’s emissions profile, financial position, and business goals. Start with a climate risk assessment and a marginal abatement cost curve to spot the investments that can cut the most emissions.
Next, use scenario analysis to test different carbon pricing and policy paths. Focus first on no-regrets actions, stage larger investments over time, and put clear governance and milestones in place.
Can these five models be used together?
Yes. These models can - and often should - work side by side as part of a complementary decarbonization strategy, not as an either-or call.
For instance, a finance team might use internal carbon pricing to stress-test projects, blended capital stacks to fund and de-risk large infrastructure, and portfolio rebalancing to move resources toward higher-impact abatement opportunities.
What data do finance teams need to use these models?
Finance teams need a mix of operational, climate, and financial data to make sound calls and keep the work tied to business results. That means starting with a baseline greenhouse gas inventory across all scopes, then layering in marginal abatement cost curves, capital expenditure needs, asset retirement schedules, projected efficiency revenues, and climate risk registers.
They also need scenario analysis for variables like carbon pricing ($50–$100/tCO2e) and policy shifts. On top of that, teams need clear KPIs, baseline performance metrics, and pre-set cash-flow rules so they can track progress and support transparency.
Related Blog Posts
Latest Articles
©2025

Narrative Change and Power Building: The Missing Half of Advocacy
Narrative change is the process of disrupting dominant narratives that normalize inequity and advancing new narratives from historically marginalized communities.

Funding Resilience Without Federal Grants
BRIC is unreliable and FEMA is shrinking. Here's how cities fund climate resilience with dedicated revenue, blended finance, and a coordinating authority.

The ESG Blind Spot: How AI Is Finding Risks in Companies Nobody Else Is Watching
Norway's sovereign wealth fund uses AI to screen 7,200 portfolio companies for forced labor and corruption within 24 hours. The real story is the emerging-market coverage gap that traditional ESG data vendors miss — and what it means for any company with a global supply chain.
Narrative Change and Power Building: The Missing Half of Advocacy
Narrative change is the process of disrupting dominant narratives that normalize inequity and advancing new narratives from historically marginalized communities.
Funding Resilience Without Federal Grants
BRIC is unreliable and FEMA is shrinking. Here's how cities fund climate resilience with dedicated revenue, blended finance, and a coordinating authority.
The ESG Blind Spot: How AI Is Finding Risks in Companies Nobody Else Is Watching
Norway's sovereign wealth fund uses AI to screen 7,200 portfolio companies for forced labor and corruption within 24 hours. The real story is the emerging-market coverage gap that traditional ESG data vendors miss — and what it means for any company with a global supply chain.
FAQ
01
What does it really mean to “redefine profit”?
02
What makes Council Fire different?
03
Who does Council Fire work with?
04
What does working with Council Fire actually look like?
05
How does Council Fire help organizations turn big goals into action?
06
How does Council Fire define and measure success?
Aug 3, 2026
5 Capital Allocation Models For Net-Zero Goals
Sustainability Strategy
In This Article
Five capital-allocation models to fund net-zero: phased retrofits, portfolio rebalancing, carbon pricing, reserves, and blended finance.
5 Capital Allocation Models For Net-Zero Goals
Net-zero planning is a capital allocation problem first. If I need to fund emissions cuts without blowing up budgets, the article points to five main models: phased retrofit funding, portfolio rebalancing, internal carbon pricing, transition reserve funds, and blended capital stacks.
Here’s the short version in plain English:
Phased retrofit funding works when I need to spread building upgrades across normal replacement cycles.
Portfolio rebalancing fits when the main lever is shifting money away from higher-emissions assets over time.
Internal carbon pricing helps when project approval is the choke point and I want carbon costs inside NPV and IRR models.
Transition reserve funds make sense when decarbonization needs a dedicated multi-year pool of cash.
Blended capital stacks help close gaps when a project cannot stand on commercial financing alone.
A few numbers show the range of outcomes. In one city retrofit program, 271 buildings saw 23% lower electricity use and 46% lower natural gas use. In portfolio work, a 10% yearly drop in carbon intensity over 16 years could cut intensity by about 81%. In internal carbon pricing, one company used its fee system to support more than 10 billion kWh of green power and cut 7.5 million metric tons CO₂e.
5 Capital Allocation Models for Net-Zero Goals: Side-by-Side Comparison
Phenix Virtual InvestorConnect- Aligning Portfolios with Net-Zero: Implications for Asset Allocation
Quick Comparison
Model | Best when I need to... | Main tradeoff | Time horizon |
|---|---|---|---|
Phased Retrofit Funding | Stage upgrades over budget cycles | Lower annual spend vs. slower emissions cuts | Often 3–15+ years by measure |
Portfolio Rebalancing | Shift capital at the portfolio level | Lower carbon exposure vs. benchmark drift | Review-cycle based; impact builds over 5–15 years |
Internal Carbon Pricing | Change project selection rules | Near-term margin pressure vs. lower transition risk | Often helps with projects in the 3–15 year range |
Transition Reserve Funds | Set aside money for future decarbonization | Liquidity drag vs. funding readiness | Often 5–20+ years |
Blended Capital Stacks | Finance projects that need outside support | Lower cost of capital vs. deal complexity | Often 7–25+ years |
If I strip the article down to one point, it’s this: the right model depends on where the bottleneck sits - project approval, portfolio mix, budget timing, or access to outside capital.
1. Phased Retrofit Funding
Phased retrofit funding lines up retrofits with normal replacement cycles. Instead of paying for a full building overhaul all at once, you split the work into smaller investment tranches tied to natural replacement points - when a boiler reaches end of life, a roof needs replacing, or a lease turns over. Money that would have gone to maintenance or replacement anyway gets redirected into retrofit work and moves the building closer to net zero.
Best Fit
This model fits large portfolios with varied building ages, tight annual budgets, and assets where disruption needs careful handling. That often means university campuses, corporate real estate portfolios, hospitals, or municipal building inventories. The City of Houston used phased retrofits across 271 buildings totaling 11 million square feet, cutting electricity use by 23%, natural gas use by 46%, and producing a 14.6-year simple payback.[3]
Key Tradeoff
The main tradeoff is budget flexibility versus faster emissions cuts. Phasing spreads risk across time, gives teams a chance to learn from early phases, and keeps annual budgets from spiking. The downside is plain enough: high-emitting equipment stays in service longer, so emissions and fuel costs keep running until later phases are done.
There’s also timing risk. Later phases may face shifts in energy prices, incentives, or rules. Scenario analysis can help finance leaders compare a phased path with a front-loaded plan and put numbers around that gap before they commit.
Typical Payback Timing
Payback varies a lot by measure:
Controls optimization and retro-commissioning often pay back in a little over a year.
LED lighting and basic controls usually land in the 2–5 year range.
HVAC optimization and advanced controls often run 3–7 years.
Heat pump conversions and major mechanical replacements can stretch to 7–15+ years, though U.S. incentives and utility rebates can shorten that window.
Envelope work - insulation, windows, and roof improvements - often lands in the 10–20+ year range and is more often backed by comfort, resilience, and long-term energy savings than by near-term returns alone.
Primary Finance-Team Use Case
For CFOs and treasurers, phased retrofit funding is mainly a way to smooth the CapEx hump of a net-zero shift without stalling progress. It lets teams match retrofit spending to cash flows, refinancing events, and macro conditions.
A phased plan supported by green bonds or sustainability-linked financing also gives investors a clear path for emissions cuts and may lower financing costs.
When a retrofit program spans more than one asset class, the next lever is portfolio rebalancing.
2. Portfolio Rebalancing
Portfolio rebalancing moves capital out of higher-emitting assets and into lower-carbon or climate-solution assets on a set schedule. The goal is simple: keep portfolio emissions moving along a science-based pathway. This works well when emissions cuts depend more on where money goes than on upgrading one asset at a time.
Best Fit
This model fits organizations that manage diversified portfolios across many asset classes or business units, such as pension funds, endowments, insurers, and companies with several business lines. It’s most useful when the main decarbonization lever is capital allocation itself.
Unlike phased retrofit funding, portfolio rebalancing happens at the governance level. It works through rebalancing cycles and capital drift rules, not project-by-project upgrades. If your team already rebalances on a routine schedule and has asset-level emissions data, climate constraints can slot into that process without changing the whole system.
Key Tradeoff
The main tension is clear: cutting portfolio carbon intensity while still staying close to benchmark returns. Tilting away from high-emitting sectors can increase tracking error, shift style exposures, and affect short-term performance.[4][1][8][9]
Research on benchmark portfolios with declining carbon footprints shows that excluding the top 1%–10% of emitters and reallocating to lower-emitting peers can cut carbon intensity by a large margin with only limited change to overall risk exposure.[10][11] A strategy aimed at a 10% annual drop in portfolio carbon intensity over 16 years could reduce intensity by about 81%, with the first round of rebalancing affecting as little as 11% of the benchmark’s market value.[2][10]
That’s the heart of the tradeoff: gradual, pathway-based tilts tend to cause less disruption than hard exclusions all at once.
Typical Payback Timing
The payoff here is not a neat project payback period. It shows up as lower transition risk and stronger capital resilience over time. Less exposure to stranded assets, carbon pricing, and policy shifts can build value across a 5–15 year horizon as transition risks hit the market.[5][6]
In practice, rebalancing usually lines up with annual or quarterly portfolio review cycles. Progress is tracked against interim milestones - often 2030 targets - rather than one finish line on one date.[1][5][7] Scenario analysis from Allianz Global Investors suggests that climate-aware approaches can move annual returns by about –1.5% to +0.4%, depending on the asset class and scenario.[12]
Primary Finance-Team Use Case
For CIOs, treasurers, and corporate finance teams, portfolio rebalancing is mainly a strategic asset allocation tool. It can be written into investment policy statements as clear carbon-reduction pathways, exclusion thresholds, or tilt rules, alongside usual rebalancing triggers such as drift limits or liquidity needs.
On the corporate side, this can mean moving internal capital budgets toward energy efficiency, electrification, renewables, or other lower-carbon growth areas while shrinking exposure to high-carbon legacy operations. Emissions data and carbon budget metrics then flow into climate risk reporting and help show whether capital allocation is matching net-zero commitments.
When project approval - not portfolio tilt - becomes the main lever, internal carbon pricing comes next.
3. Internal Carbon Pricing
When portfolio rebalancing shifts the asset mix, internal carbon pricing changes something more immediate: which projects make it past the hurdle rate. ICP puts a dollar figure on greenhouse gas emissions - usually $/metric ton of CO₂e - and folds that figure into capital planning, budgeting, and procurement. In practice, it works as a project-level capital allocation tool, not just a pricing label.
Best Fit
ICP tends to work best for medium to large organizations with material Scope 1, 2, and 3 emissions. That usually means groups like manufacturers, logistics operators, data center owners, and commercial real estate portfolios, where long-lived projects are competing for a limited pool of capital.
It also fits best when leadership wants net-zero goals to show up in day-to-day financial choices, not sit off to the side in a separate sustainability plan. The same goes for teams that need to pressure-test capital plans against likely future carbon rules.
Key Tradeoff
The main tension is simple: short-term margin pressure versus long-term risk reduction. If the internal carbon price is set at a meaningful level, emissions-heavy projects can look less attractive in the near term. That can create friction with business units that are measured on near-term cost control or profit targets.
This is where governance matters. About two-thirds of companies that use ICP rely on shadow prices, which makes adoption easier but gives finance less direct control over cash flows. Explicit fees add real budget discipline.[21][22]
Typical Payback Timing
ICP can stretch acceptable payback periods from 3–5 years to 5–15 years by improving carbon-adjusted NPV.[13][14] Once a carbon cost - or an avoided-carbon-cost stream - is added to project cash flows, lower-carbon options can move above the internal hurdle rate.
Microsoft offers a clear example of what this can look like at scale. Its internal carbon fee has enabled the purchase of more than 10 billion kilowatt-hours of green power, reduced emissions by 7.5 million metric tons CO₂e, and saved more than $10 million per year.[18][19][20] The company has also increased its Scope 3 business travel fee to $100 per metric ton CO₂e and plans to keep increasing it each year through FY2030 to reflect rising abatement costs.[17]
Primary Finance-Team Use Case
For finance teams, the core use case is straightforward: add a carbon cost line to project models - metric tons CO₂e × the internal price - and then compare carbon-inclusive NPV and IRR against standard financial metrics.[13][14][15][16] That turns carbon into a routine input for capital approval instead of a separate sustainability screen.
There’s also a funding angle. When business units pay explicit internal charges, those funds can be collected into a central decarbonization pool. Finance can then direct that pool toward priority decarbonization projects, which sets up the logic for transition reserve funds.
4. Transition Reserve Funds
A transition reserve fund is a restricted reserve set aside for decarbonization projects over multiple years. If internal carbon pricing builds a funding pool, this fund gives that money a place to sit until projects are ready to move. It can absorb internal charges, retained cash, or earmarked capital held for later use.[25]
Best Fit
This model fits best in capital-intensive sectors with long asset lives and uncertain transition timelines, often stretching across 5–15 years.[23][29][30] It also works well for companies with uneven cash flows that can’t count on making large one-time decarbonization commitments in a single planning cycle.
That matters in practice. Instead of forcing one big budget hit, finance teams can line up funding with asset replacement cycles and invest as equipment ages out.
Key Tradeoff
The main tradeoff is flexibility versus speed. A reserve keeps options open, but capital that sits idle can slow emissions cuts and may earn less than it would in other uses. On the other hand, this approach can lower stranded-asset risk and improve climate resilience. You’re less likely to sink money into a technology too early, only to find out later that it no longer makes sense.
Typical Payback Timing
Payback varies by project type. Efficiency retrofits often pay back in 3–7 years. Renewable power projects usually land in the 7–15 year range. Deep decarbonization bets can stretch to 10–20+ years.
A tiered reserve can help here:
One pool for near-term efficiency projects
Another pool for longer-horizon strategic bets[24]
Primary Finance-Team Use Case
For finance, the goal is to turn the reserve into a structured, predictable funding mechanism, not just an ad hoc reserve. FP&A sets annual contributions. Treasury manages liquidity and covenants. Sustainability screens which projects qualify. Then a capital committee approves drawdowns against pre-set hurdle rates.[26][27][28]
For projects that need outside capital, the next model is blended capital stacks.
5. Blended Capital Stacks
When internal reserves and carbon charges still leave a funding gap, outside capital often becomes the missing piece.
A blended capital stack brings grants, concessional loans, guarantees, debt, and equity into one financing structure. The idea is simple: use lower-cost or more risk-tolerant capital from governments, foundations, or development finance institutions to make a project investable for private capital.
Each layer plays a different part. Public or philanthropic money often sits in the first-loss layer, taking early losses so commercial lenders face less downside. Development finance institutions may provide subordinated or concessional capital in the middle. Commercial banks and private investors usually take the senior position. If the stack is put together well, leverage ratios of 4:1 or higher are possible. In plain terms, each $1 of concessional capital can help bring in $4 or more in private funding.[31][32]
Best Fit
This model works best for projects that are technically sound but fall short of standard hurdle rates because of risk, timing, or both. Think large-scale building retrofit programs with 10–20 year paybacks, first-of-a-kind clean energy deployments, and resilience assets like flood defenses or grid hardening. Those projects may create major avoided-loss value, even when they do not produce direct revenue in the usual way.
In the U.S., these stacks often combine tax credits, DOE loan guarantees, state green bank capital, grants, program-related investments, and commercial debt or equity. It’s a bit like building a bridge from public-purpose funding to private markets.
Key Tradeoff
The upside is cheaper capital. The cost is complexity.
Blended stacks can reduce WACC and stretch repayment timelines so they line up better with long-lived assets. But that comes with more moving parts. Teams have to line up funders with different mandates, legal terms, and reporting needs. That takes time, deal skill, and steady governance after closing.
There’s another layer to this. Finance teams need solid impact measurement systems. Concessional funders often want verified results, not rough estimates, so teams must track emissions cuts, energy savings, resilience outcomes, and other co-benefits with care.
Typical Payback Timing
Payback usually falls in the 7 to 25 year range, depending on the asset and the way the stack is built.[32] Campus-wide retrofit programs often land in the 8–15 year range when tax credits and concessional financing are part of the mix. Resilience infrastructure is different. It often pays back through avoided losses and lower insurance costs, which means scenario modeling matters more than a standard revenue forecast.
Primary Finance-Team Use Case
For projects that are too large or too risky for the balance sheet alone, finance teams can model the full stack in U.S. dollars, show how each tranche changes IRR and NPV, and compare the blended structure with a fully commercial option.
The work usually splits across functions:
Finance teams model the stack and test deal economics
Sustainability teams track emissions and resilience metrics required by concessional funders
Treasury or project finance teams manage lender relationships and covenant compliance
These deals only work well when treasury, tax, sustainability, and project finance stay tightly aligned.
Side-by-Side Comparison Table
This table helps finance teams line up each model with the problem it solves best. It covers all five capital allocation models so CFOs, treasury leaders, FP&A teams, sustainability finance leads, and investment committees can spot the right fit fast. It also makes it easier to tell project-level tools apart from portfolio-level and financing-structure tools.
Model | Best Fit | Key Tradeoff | Typical Payback Timing | Primary Finance-Team Use Case |
|---|---|---|---|---|
Phased Retrofit Funding | Asset-heavy organizations with predictable CapEx and staggered replacement cycles. | Speed vs. budget discipline. | ~3–10 years. | CapEx sequencing and financing alignment. |
Portfolio Rebalancing | Diversified portfolios or business units that can shift capital from high- to low-carbon activities. | Emissions reduction vs. tracking error and opportunity cost: lower carbon exposure can limit sectors and add short-term tracking error. | At each rebalance cycle; benefits build over 5–15 years. | Portfolio decarbonization and investment-policy updates. |
Internal Carbon Pricing | Organizations with strong FP&A and project approval processes that can absorb carbon costs into investment decisions. | Analytical rigor vs. simplicity and acceptance: stronger decision discipline, but more modeling overhead and potential internal pushback. | Depends on planning cycle; most useful for projects with 3–7 year paybacks. | Project screening using carbon-adjusted NPV and IRR. |
Transition Reserve Funds | Firms with cyclical earnings or transition risk that need a dedicated decarbonization buffer. | Liquidity and earnings vs. preparedness and resilience: capital is unavailable for growth, M&A, or buybacks. | Typically 5–20+ years. | Reserve governance and drawdown discipline. |
Blended Capital Stacks | Projects that are strategic but marginal under conventional financing. | Structuring complexity vs. project viability and scale: more parties and longer closes, but lower cost of capital and broader project viability. | 7–25+ years, with concessional capital and tax credit equity often improving the economics. | Deal structuring and capital-stack coordination. |
Conclusion
No single model works for every situation. The right choice depends on the bottleneck in front of you: the asset type, the pace of decarbonization needed, and how much room you have to move capital.
Use internal carbon pricing when the main issue is project selection. It puts a dollar figure on emissions and makes capital ranking sharper and more disciplined. Net-zero progress comes from moving capital, not just setting targets. When decisions need to happen at the portfolio level, the focus has to shift from project timing to allocation rules.
Reserve funds work best for known future costs. Blended stacks help close funding gaps. Portfolio rebalancing fits diversified holdings. In practice, the strongest net-zero plans use these tools together instead of leaning on just one.
Council Fire helps finance teams turn net-zero commitments into capital plans that hold up under budget and stakeholder scrutiny.
FAQs
How do I choose the right net-zero capital model?
Choose the right net-zero capital model by matching it to your organization’s emissions profile, financial position, and business goals. Start with a climate risk assessment and a marginal abatement cost curve to spot the investments that can cut the most emissions.
Next, use scenario analysis to test different carbon pricing and policy paths. Focus first on no-regrets actions, stage larger investments over time, and put clear governance and milestones in place.
Can these five models be used together?
Yes. These models can - and often should - work side by side as part of a complementary decarbonization strategy, not as an either-or call.
For instance, a finance team might use internal carbon pricing to stress-test projects, blended capital stacks to fund and de-risk large infrastructure, and portfolio rebalancing to move resources toward higher-impact abatement opportunities.
What data do finance teams need to use these models?
Finance teams need a mix of operational, climate, and financial data to make sound calls and keep the work tied to business results. That means starting with a baseline greenhouse gas inventory across all scopes, then layering in marginal abatement cost curves, capital expenditure needs, asset retirement schedules, projected efficiency revenues, and climate risk registers.
They also need scenario analysis for variables like carbon pricing ($50–$100/tCO2e) and policy shifts. On top of that, teams need clear KPIs, baseline performance metrics, and pre-set cash-flow rules so they can track progress and support transparency.
Related Blog Posts
Latest Articles
©2025
Narrative Change and Power Building: The Missing Half of Advocacy
Narrative change is the process of disrupting dominant narratives that normalize inequity and advancing new narratives from historically marginalized communities.
Funding Resilience Without Federal Grants
BRIC is unreliable and FEMA is shrinking. Here's how cities fund climate resilience with dedicated revenue, blended finance, and a coordinating authority.
The ESG Blind Spot: How AI Is Finding Risks in Companies Nobody Else Is Watching
Norway's sovereign wealth fund uses AI to screen 7,200 portfolio companies for forced labor and corruption within 24 hours. The real story is the emerging-market coverage gap that traditional ESG data vendors miss — and what it means for any company with a global supply chain.
FAQ
01
What does it really mean to “redefine profit”?
02
What makes Council Fire different?
03
Who does Council Fire work with?
04
What does working with Council Fire actually look like?
05
How does Council Fire help organizations turn big goals into action?
06
How does Council Fire define and measure success?
Aug 3, 2026
5 Capital Allocation Models For Net-Zero Goals
Sustainability Strategy
In This Article
Five capital-allocation models to fund net-zero: phased retrofits, portfolio rebalancing, carbon pricing, reserves, and blended finance.
5 Capital Allocation Models For Net-Zero Goals
Net-zero planning is a capital allocation problem first. If I need to fund emissions cuts without blowing up budgets, the article points to five main models: phased retrofit funding, portfolio rebalancing, internal carbon pricing, transition reserve funds, and blended capital stacks.
Here’s the short version in plain English:
Phased retrofit funding works when I need to spread building upgrades across normal replacement cycles.
Portfolio rebalancing fits when the main lever is shifting money away from higher-emissions assets over time.
Internal carbon pricing helps when project approval is the choke point and I want carbon costs inside NPV and IRR models.
Transition reserve funds make sense when decarbonization needs a dedicated multi-year pool of cash.
Blended capital stacks help close gaps when a project cannot stand on commercial financing alone.
A few numbers show the range of outcomes. In one city retrofit program, 271 buildings saw 23% lower electricity use and 46% lower natural gas use. In portfolio work, a 10% yearly drop in carbon intensity over 16 years could cut intensity by about 81%. In internal carbon pricing, one company used its fee system to support more than 10 billion kWh of green power and cut 7.5 million metric tons CO₂e.
5 Capital Allocation Models for Net-Zero Goals: Side-by-Side Comparison
Phenix Virtual InvestorConnect- Aligning Portfolios with Net-Zero: Implications for Asset Allocation
Quick Comparison
Model | Best when I need to... | Main tradeoff | Time horizon |
|---|---|---|---|
Phased Retrofit Funding | Stage upgrades over budget cycles | Lower annual spend vs. slower emissions cuts | Often 3–15+ years by measure |
Portfolio Rebalancing | Shift capital at the portfolio level | Lower carbon exposure vs. benchmark drift | Review-cycle based; impact builds over 5–15 years |
Internal Carbon Pricing | Change project selection rules | Near-term margin pressure vs. lower transition risk | Often helps with projects in the 3–15 year range |
Transition Reserve Funds | Set aside money for future decarbonization | Liquidity drag vs. funding readiness | Often 5–20+ years |
Blended Capital Stacks | Finance projects that need outside support | Lower cost of capital vs. deal complexity | Often 7–25+ years |
If I strip the article down to one point, it’s this: the right model depends on where the bottleneck sits - project approval, portfolio mix, budget timing, or access to outside capital.
1. Phased Retrofit Funding
Phased retrofit funding lines up retrofits with normal replacement cycles. Instead of paying for a full building overhaul all at once, you split the work into smaller investment tranches tied to natural replacement points - when a boiler reaches end of life, a roof needs replacing, or a lease turns over. Money that would have gone to maintenance or replacement anyway gets redirected into retrofit work and moves the building closer to net zero.
Best Fit
This model fits large portfolios with varied building ages, tight annual budgets, and assets where disruption needs careful handling. That often means university campuses, corporate real estate portfolios, hospitals, or municipal building inventories. The City of Houston used phased retrofits across 271 buildings totaling 11 million square feet, cutting electricity use by 23%, natural gas use by 46%, and producing a 14.6-year simple payback.[3]
Key Tradeoff
The main tradeoff is budget flexibility versus faster emissions cuts. Phasing spreads risk across time, gives teams a chance to learn from early phases, and keeps annual budgets from spiking. The downside is plain enough: high-emitting equipment stays in service longer, so emissions and fuel costs keep running until later phases are done.
There’s also timing risk. Later phases may face shifts in energy prices, incentives, or rules. Scenario analysis can help finance leaders compare a phased path with a front-loaded plan and put numbers around that gap before they commit.
Typical Payback Timing
Payback varies a lot by measure:
Controls optimization and retro-commissioning often pay back in a little over a year.
LED lighting and basic controls usually land in the 2–5 year range.
HVAC optimization and advanced controls often run 3–7 years.
Heat pump conversions and major mechanical replacements can stretch to 7–15+ years, though U.S. incentives and utility rebates can shorten that window.
Envelope work - insulation, windows, and roof improvements - often lands in the 10–20+ year range and is more often backed by comfort, resilience, and long-term energy savings than by near-term returns alone.
Primary Finance-Team Use Case
For CFOs and treasurers, phased retrofit funding is mainly a way to smooth the CapEx hump of a net-zero shift without stalling progress. It lets teams match retrofit spending to cash flows, refinancing events, and macro conditions.
A phased plan supported by green bonds or sustainability-linked financing also gives investors a clear path for emissions cuts and may lower financing costs.
When a retrofit program spans more than one asset class, the next lever is portfolio rebalancing.
2. Portfolio Rebalancing
Portfolio rebalancing moves capital out of higher-emitting assets and into lower-carbon or climate-solution assets on a set schedule. The goal is simple: keep portfolio emissions moving along a science-based pathway. This works well when emissions cuts depend more on where money goes than on upgrading one asset at a time.
Best Fit
This model fits organizations that manage diversified portfolios across many asset classes or business units, such as pension funds, endowments, insurers, and companies with several business lines. It’s most useful when the main decarbonization lever is capital allocation itself.
Unlike phased retrofit funding, portfolio rebalancing happens at the governance level. It works through rebalancing cycles and capital drift rules, not project-by-project upgrades. If your team already rebalances on a routine schedule and has asset-level emissions data, climate constraints can slot into that process without changing the whole system.
Key Tradeoff
The main tension is clear: cutting portfolio carbon intensity while still staying close to benchmark returns. Tilting away from high-emitting sectors can increase tracking error, shift style exposures, and affect short-term performance.[4][1][8][9]
Research on benchmark portfolios with declining carbon footprints shows that excluding the top 1%–10% of emitters and reallocating to lower-emitting peers can cut carbon intensity by a large margin with only limited change to overall risk exposure.[10][11] A strategy aimed at a 10% annual drop in portfolio carbon intensity over 16 years could reduce intensity by about 81%, with the first round of rebalancing affecting as little as 11% of the benchmark’s market value.[2][10]
That’s the heart of the tradeoff: gradual, pathway-based tilts tend to cause less disruption than hard exclusions all at once.
Typical Payback Timing
The payoff here is not a neat project payback period. It shows up as lower transition risk and stronger capital resilience over time. Less exposure to stranded assets, carbon pricing, and policy shifts can build value across a 5–15 year horizon as transition risks hit the market.[5][6]
In practice, rebalancing usually lines up with annual or quarterly portfolio review cycles. Progress is tracked against interim milestones - often 2030 targets - rather than one finish line on one date.[1][5][7] Scenario analysis from Allianz Global Investors suggests that climate-aware approaches can move annual returns by about –1.5% to +0.4%, depending on the asset class and scenario.[12]
Primary Finance-Team Use Case
For CIOs, treasurers, and corporate finance teams, portfolio rebalancing is mainly a strategic asset allocation tool. It can be written into investment policy statements as clear carbon-reduction pathways, exclusion thresholds, or tilt rules, alongside usual rebalancing triggers such as drift limits or liquidity needs.
On the corporate side, this can mean moving internal capital budgets toward energy efficiency, electrification, renewables, or other lower-carbon growth areas while shrinking exposure to high-carbon legacy operations. Emissions data and carbon budget metrics then flow into climate risk reporting and help show whether capital allocation is matching net-zero commitments.
When project approval - not portfolio tilt - becomes the main lever, internal carbon pricing comes next.
3. Internal Carbon Pricing
When portfolio rebalancing shifts the asset mix, internal carbon pricing changes something more immediate: which projects make it past the hurdle rate. ICP puts a dollar figure on greenhouse gas emissions - usually $/metric ton of CO₂e - and folds that figure into capital planning, budgeting, and procurement. In practice, it works as a project-level capital allocation tool, not just a pricing label.
Best Fit
ICP tends to work best for medium to large organizations with material Scope 1, 2, and 3 emissions. That usually means groups like manufacturers, logistics operators, data center owners, and commercial real estate portfolios, where long-lived projects are competing for a limited pool of capital.
It also fits best when leadership wants net-zero goals to show up in day-to-day financial choices, not sit off to the side in a separate sustainability plan. The same goes for teams that need to pressure-test capital plans against likely future carbon rules.
Key Tradeoff
The main tension is simple: short-term margin pressure versus long-term risk reduction. If the internal carbon price is set at a meaningful level, emissions-heavy projects can look less attractive in the near term. That can create friction with business units that are measured on near-term cost control or profit targets.
This is where governance matters. About two-thirds of companies that use ICP rely on shadow prices, which makes adoption easier but gives finance less direct control over cash flows. Explicit fees add real budget discipline.[21][22]
Typical Payback Timing
ICP can stretch acceptable payback periods from 3–5 years to 5–15 years by improving carbon-adjusted NPV.[13][14] Once a carbon cost - or an avoided-carbon-cost stream - is added to project cash flows, lower-carbon options can move above the internal hurdle rate.
Microsoft offers a clear example of what this can look like at scale. Its internal carbon fee has enabled the purchase of more than 10 billion kilowatt-hours of green power, reduced emissions by 7.5 million metric tons CO₂e, and saved more than $10 million per year.[18][19][20] The company has also increased its Scope 3 business travel fee to $100 per metric ton CO₂e and plans to keep increasing it each year through FY2030 to reflect rising abatement costs.[17]
Primary Finance-Team Use Case
For finance teams, the core use case is straightforward: add a carbon cost line to project models - metric tons CO₂e × the internal price - and then compare carbon-inclusive NPV and IRR against standard financial metrics.[13][14][15][16] That turns carbon into a routine input for capital approval instead of a separate sustainability screen.
There’s also a funding angle. When business units pay explicit internal charges, those funds can be collected into a central decarbonization pool. Finance can then direct that pool toward priority decarbonization projects, which sets up the logic for transition reserve funds.
4. Transition Reserve Funds
A transition reserve fund is a restricted reserve set aside for decarbonization projects over multiple years. If internal carbon pricing builds a funding pool, this fund gives that money a place to sit until projects are ready to move. It can absorb internal charges, retained cash, or earmarked capital held for later use.[25]
Best Fit
This model fits best in capital-intensive sectors with long asset lives and uncertain transition timelines, often stretching across 5–15 years.[23][29][30] It also works well for companies with uneven cash flows that can’t count on making large one-time decarbonization commitments in a single planning cycle.
That matters in practice. Instead of forcing one big budget hit, finance teams can line up funding with asset replacement cycles and invest as equipment ages out.
Key Tradeoff
The main tradeoff is flexibility versus speed. A reserve keeps options open, but capital that sits idle can slow emissions cuts and may earn less than it would in other uses. On the other hand, this approach can lower stranded-asset risk and improve climate resilience. You’re less likely to sink money into a technology too early, only to find out later that it no longer makes sense.
Typical Payback Timing
Payback varies by project type. Efficiency retrofits often pay back in 3–7 years. Renewable power projects usually land in the 7–15 year range. Deep decarbonization bets can stretch to 10–20+ years.
A tiered reserve can help here:
One pool for near-term efficiency projects
Another pool for longer-horizon strategic bets[24]
Primary Finance-Team Use Case
For finance, the goal is to turn the reserve into a structured, predictable funding mechanism, not just an ad hoc reserve. FP&A sets annual contributions. Treasury manages liquidity and covenants. Sustainability screens which projects qualify. Then a capital committee approves drawdowns against pre-set hurdle rates.[26][27][28]
For projects that need outside capital, the next model is blended capital stacks.
5. Blended Capital Stacks
When internal reserves and carbon charges still leave a funding gap, outside capital often becomes the missing piece.
A blended capital stack brings grants, concessional loans, guarantees, debt, and equity into one financing structure. The idea is simple: use lower-cost or more risk-tolerant capital from governments, foundations, or development finance institutions to make a project investable for private capital.
Each layer plays a different part. Public or philanthropic money often sits in the first-loss layer, taking early losses so commercial lenders face less downside. Development finance institutions may provide subordinated or concessional capital in the middle. Commercial banks and private investors usually take the senior position. If the stack is put together well, leverage ratios of 4:1 or higher are possible. In plain terms, each $1 of concessional capital can help bring in $4 or more in private funding.[31][32]
Best Fit
This model works best for projects that are technically sound but fall short of standard hurdle rates because of risk, timing, or both. Think large-scale building retrofit programs with 10–20 year paybacks, first-of-a-kind clean energy deployments, and resilience assets like flood defenses or grid hardening. Those projects may create major avoided-loss value, even when they do not produce direct revenue in the usual way.
In the U.S., these stacks often combine tax credits, DOE loan guarantees, state green bank capital, grants, program-related investments, and commercial debt or equity. It’s a bit like building a bridge from public-purpose funding to private markets.
Key Tradeoff
The upside is cheaper capital. The cost is complexity.
Blended stacks can reduce WACC and stretch repayment timelines so they line up better with long-lived assets. But that comes with more moving parts. Teams have to line up funders with different mandates, legal terms, and reporting needs. That takes time, deal skill, and steady governance after closing.
There’s another layer to this. Finance teams need solid impact measurement systems. Concessional funders often want verified results, not rough estimates, so teams must track emissions cuts, energy savings, resilience outcomes, and other co-benefits with care.
Typical Payback Timing
Payback usually falls in the 7 to 25 year range, depending on the asset and the way the stack is built.[32] Campus-wide retrofit programs often land in the 8–15 year range when tax credits and concessional financing are part of the mix. Resilience infrastructure is different. It often pays back through avoided losses and lower insurance costs, which means scenario modeling matters more than a standard revenue forecast.
Primary Finance-Team Use Case
For projects that are too large or too risky for the balance sheet alone, finance teams can model the full stack in U.S. dollars, show how each tranche changes IRR and NPV, and compare the blended structure with a fully commercial option.
The work usually splits across functions:
Finance teams model the stack and test deal economics
Sustainability teams track emissions and resilience metrics required by concessional funders
Treasury or project finance teams manage lender relationships and covenant compliance
These deals only work well when treasury, tax, sustainability, and project finance stay tightly aligned.
Side-by-Side Comparison Table
This table helps finance teams line up each model with the problem it solves best. It covers all five capital allocation models so CFOs, treasury leaders, FP&A teams, sustainability finance leads, and investment committees can spot the right fit fast. It also makes it easier to tell project-level tools apart from portfolio-level and financing-structure tools.
Model | Best Fit | Key Tradeoff | Typical Payback Timing | Primary Finance-Team Use Case |
|---|---|---|---|---|
Phased Retrofit Funding | Asset-heavy organizations with predictable CapEx and staggered replacement cycles. | Speed vs. budget discipline. | ~3–10 years. | CapEx sequencing and financing alignment. |
Portfolio Rebalancing | Diversified portfolios or business units that can shift capital from high- to low-carbon activities. | Emissions reduction vs. tracking error and opportunity cost: lower carbon exposure can limit sectors and add short-term tracking error. | At each rebalance cycle; benefits build over 5–15 years. | Portfolio decarbonization and investment-policy updates. |
Internal Carbon Pricing | Organizations with strong FP&A and project approval processes that can absorb carbon costs into investment decisions. | Analytical rigor vs. simplicity and acceptance: stronger decision discipline, but more modeling overhead and potential internal pushback. | Depends on planning cycle; most useful for projects with 3–7 year paybacks. | Project screening using carbon-adjusted NPV and IRR. |
Transition Reserve Funds | Firms with cyclical earnings or transition risk that need a dedicated decarbonization buffer. | Liquidity and earnings vs. preparedness and resilience: capital is unavailable for growth, M&A, or buybacks. | Typically 5–20+ years. | Reserve governance and drawdown discipline. |
Blended Capital Stacks | Projects that are strategic but marginal under conventional financing. | Structuring complexity vs. project viability and scale: more parties and longer closes, but lower cost of capital and broader project viability. | 7–25+ years, with concessional capital and tax credit equity often improving the economics. | Deal structuring and capital-stack coordination. |
Conclusion
No single model works for every situation. The right choice depends on the bottleneck in front of you: the asset type, the pace of decarbonization needed, and how much room you have to move capital.
Use internal carbon pricing when the main issue is project selection. It puts a dollar figure on emissions and makes capital ranking sharper and more disciplined. Net-zero progress comes from moving capital, not just setting targets. When decisions need to happen at the portfolio level, the focus has to shift from project timing to allocation rules.
Reserve funds work best for known future costs. Blended stacks help close funding gaps. Portfolio rebalancing fits diversified holdings. In practice, the strongest net-zero plans use these tools together instead of leaning on just one.
Council Fire helps finance teams turn net-zero commitments into capital plans that hold up under budget and stakeholder scrutiny.
FAQs
How do I choose the right net-zero capital model?
Choose the right net-zero capital model by matching it to your organization’s emissions profile, financial position, and business goals. Start with a climate risk assessment and a marginal abatement cost curve to spot the investments that can cut the most emissions.
Next, use scenario analysis to test different carbon pricing and policy paths. Focus first on no-regrets actions, stage larger investments over time, and put clear governance and milestones in place.
Can these five models be used together?
Yes. These models can - and often should - work side by side as part of a complementary decarbonization strategy, not as an either-or call.
For instance, a finance team might use internal carbon pricing to stress-test projects, blended capital stacks to fund and de-risk large infrastructure, and portfolio rebalancing to move resources toward higher-impact abatement opportunities.
What data do finance teams need to use these models?
Finance teams need a mix of operational, climate, and financial data to make sound calls and keep the work tied to business results. That means starting with a baseline greenhouse gas inventory across all scopes, then layering in marginal abatement cost curves, capital expenditure needs, asset retirement schedules, projected efficiency revenues, and climate risk registers.
They also need scenario analysis for variables like carbon pricing ($50–$100/tCO2e) and policy shifts. On top of that, teams need clear KPIs, baseline performance metrics, and pre-set cash-flow rules so they can track progress and support transparency.
Related Blog Posts
Latest Articles
©2025
Narrative Change and Power Building: The Missing Half of Advocacy
Narrative change is the process of disrupting dominant narratives that normalize inequity and advancing new narratives from historically marginalized communities.
Funding Resilience Without Federal Grants
BRIC is unreliable and FEMA is shrinking. Here's how cities fund climate resilience with dedicated revenue, blended finance, and a coordinating authority.
The ESG Blind Spot: How AI Is Finding Risks in Companies Nobody Else Is Watching
Norway's sovereign wealth fund uses AI to screen 7,200 portfolio companies for forced labor and corruption within 24 hours. The real story is the emerging-market coverage gap that traditional ESG data vendors miss — and what it means for any company with a global supply chain.
FAQ
What does it really mean to “redefine profit”?
What makes Council Fire different?
Who does Council Fire work with?
What does working with Council Fire actually look like?
How does Council Fire help organizations turn big goals into action?
How does Council Fire define and measure success?