
Sep 12, 2026
Digital MRV for Industry: Key Tools and Uses
Sustainability Strategy
In This Article
Measure, report, and verify industrial emissions with CEMS, smart meters, leak sensors, satellite checks, and MRV software using traceable audit trails.
Digital MRV for Industry: Key Tools and Uses
If you want cleaner emissions data, start with three things: direct measurement, traceable records, and software that can show where every number came from. That is the core idea behind digital MRV in industry.
I see the article making one point very clearly: the best MRV setup is not the one with the most tools. It is the one that uses the right tool for each source, keeps a clear data trail, and turns plant data into reports a regulator, verifier, or finance team can check.
Here’s the short version:
Measurement means reading emissions, fuel, and energy data from the plant.
Reporting means turning that data into inventories, filings, and internal metrics.
Verification means checking that the data is correct, traceable, and ready for review.
Combustion and purchased energy are often the first places to start because they are easier to measure and often get the first review.
CEMS, utility meters, leak tools, and in-line analyzers form the main on-site tool set.
Satellite data, production logs, maintenance files, and audit trails help fill gaps and support checks.
MRV software ties everything together with calculation rules, exception handling, version history, and approvals.
A few facts stand out. The article notes that Sentinel-2 can detect methane plumes at roughly above 1–3 tons per hour, while one refinery review found an OGI camera flagged sources tied to 97% of total leak mass emissions across more than 27,000 components. Those examples show the same lesson: use direct plant data first, then use outside checks and records to support it.
If I had to boil the article down to one simple rule, it would be this: every reported number should link back to a raw reading, a calibration log, or a written calculation. That is what makes digital MRV usable across plant teams and ready for review.
Tool group | What it does best | Where it fits |
|---|---|---|
CEMS | Measures stack emissions in near real time | Combustion sources and air compliance |
Smart meters | Tracks electricity, gas, steam, and heat by asset or line | Scope 1 and Scope 2 energy tracking |
Process and leak sensors | Finds process gases, refrigerant leaks, and fugitive emissions | Kilns, reactors, refrigeration, LDAR |
Satellite data | Screens for large methane or CO2 hotspots | Site-wide checks and missing-data support |
Logs and audit trails | Documents changes, downtime, calibration, and estimates | Verification and report support |
MRV platforms | Converts raw data into filing-ready outputs | Reporting, approvals, and restatements |
So if you are building an industrial MRV system, the path is simple: measure big sources first, log every change, and use software that can explain the numbers without guesswork.
dMRV: How to Digital Measurement, Reporting and Verification Simplifies Sustainability Reporting
On-site tools: Sensors and meters for measuring plant emissions and energy use
On-site measurement is the starting point for digital MRV. Sensors and meters record emissions and energy where they happen, before the data moves into reporting systems. In most plants, the core tools are CEMS, utility meters, and process or leak sensors. Combustion sources usually come first, since they produce the most direct and continuous stream of data.
Continuous emissions monitoring systems for stacks, boilers, and heaters
CEMS are installed on flue gas stacks, boilers, and process heaters. They continuously sample gas concentrations - NOₓ, SO₂, CO₂, and CO - along with flow rate, then calculate emission rates in near real time. The EPA treats CEMS as the highest-confidence measurement method because the data are direct, continuous, and governed by strict QA/QC rules.[10] For large combustion units, that makes CEMS the strongest source of direct data, and for many major regulated sources, they are required.
That value goes beyond compliance. Hourly CEMS data helps operators spot fuel waste, catch equipment drift early, and build the kind of record decarbonization projects depend on.
Approach | Data Frequency | Verification Strength | Regulatory Fit | Best Use |
|---|---|---|---|---|
CEMS | Continuous (hourly or sub-hourly) | High - direct measurement with QA/QC | Required or strongly preferred for major units under Part 75 and some MACT standards | Compliance and optimization |
Periodic Stack Testing | Campaign-based (every 1–3 years) | Medium-high - accurate under test conditions | Used for initial performance tests and periodic compliance checks | Verification and calibration |
Fuel-Based Calculations | Monthly or annual | Medium-low - relies on emission factors and assumptions | Allowed under some rules when CEMS or stack tests aren't used | Screening and estimation |
Once combustion is measured, the next job is to track the energy inputs behind it.
Smart electricity, gas, steam, and heat meters for utilities and production lines
Interval submeters record electricity, gas, steam, and heat every 15 minutes to hourly. That makes it much easier to assign energy use and emissions to a specific asset or production line. Instead of relying only on plant-wide totals, teams can isolate a boiler, kiln, or line-level load.[3] Putting submeters at the right points - electrical panels, natural gas headers, and steam distribution junctions - gives plants the process-level data needed for both efficiency work and emissions tracking.[11]
Meter Type | Installation Point | Emissions Scope | Best Use |
|---|---|---|---|
Electricity interval meter | Utility service entrance, main switchgear, production line sub-panels | Scope 2 | Plant-wide electricity use, line-level energy intensity, efficiency project verification |
Gas flow meter | Main natural gas supply line, individual boilers, process heaters, kilns | Scope 1 | Fuel-based CO₂ calculations, boiler optimization, CEMS fuel flow validation |
Steam meter | Boiler steam outlet, main steam headers, branch lines to high-load processes | Scope 1 (on-site generation); Scope 2 (imported steam) | Steam intensity per unit of production, diagnosing steam losses |
Heat (thermal energy) meter | Hot water loops, heat recovery circuits, district energy interfaces | Scope 1 (on-site); Scope 2 (purchased heat) | Evaluating heat recovery projects, linking thermal loads to fuel use and emissions |
A sound MRV setup usually means metering all major sources at intervals of one hour or less. If anything remains unmetered, that residual should be estimated clearly and documented.[12] Meters cover energy use well, but they do not catch everything. Process emissions and leaks are the next layer.
Process and fugitive emissions sensors for kilns, reactors, refrigeration, and leak points
Not every Scope 1 emission comes from combustion. Process gas monitoring and leak detection often expose emissions that can be cut through maintenance or process changes.
Kilns and reactors release process CO₂ and other gases as part of chemical reactions. Refrigeration systems can lose high-global-warming-potential refrigerants through slow leaks. Valves, flanges, pumps, and compressors can leak methane and VOCs, and those losses add up fast if no one is watching.
For kilns and reactors, in-line gas analyzers - often infrared or FTIR-based - measure off-gas composition continuously. That supports both process control and emissions quantification through material balance.[6][7]
For refrigeration systems, the EPA GreenChill program points to two main sensor types:
Semiconductor detectors, which are cost-effective and tend to catch larger leaks above 50 ppm
Infrared analyzers, which are more sensitive and can detect leaks as low as 1–10 ppm[8]
For valves, flanges, pumps, and compressors, LDAR programs often rely on EPA Method 21 with portable analyzers or Optical Gas Imaging (OGI) infrared cameras. EPA has approved OGI as an Alternative Work Practice under 40 CFR 60.18(g)–(i). In one refinery evaluation, a portable OGI camera identified components responsible for 97% of total leak mass emissions while scanning more than 27,000 components, and it did so in far less time than a Method 21 program would require.[9]
Good practice here is simple: connect each leak alert to a work order, a repair, and a follow-up reading. That way, every event has a time stamp and a component ID. For refrigerants, tracking charges, top-offs, and retirements alongside sensor data supports a mass-based emissions estimate that is more accurate than default emission factors alone.[4][5]
Where plant sensors cannot reach, remote data and records fill the remaining gaps.
Remote and digital evidence: Satellite data, production logs, and audit trails
On-site sensors measure emissions at the source. But sensors don’t run in a perfect world. Equipment goes down, signals drop, and data streams break. That’s where satellite data, production logs, and audit trails step in. They fill missing pieces, check reported numbers against outside evidence, and help keep MRV defensible. If an instrument stops, remote data and records help keep the chain of evidence intact.
Satellite data for methane, CO2, and regional source screening
Satellite data works best when you need an outside view across a big footprint or a hard-to-reach site. For methane, instruments such as TROPOMI on Sentinel-5P and hyperspectral imagers like EMIT can spot large plumes from gas processing plants, compressor stations, LNG terminals, and major pipeline leaks. For CO2, tools like OCO-3 in SAM mode can screen refinery corridors, cement clusters, or steel hubs, then compare observed concentrations with plant-reported inventories.[13][16][17][18]
Recent facility-level validation work shows that satellite methane estimates can come close to ground truth.[15][18] Sentinel-2 uses SWIR bands to detect methane plumes at roughly more than 1–3 tons per hour, while smaller chronic leaks often need targeted instruments with higher spatial detail.[14] Performance drops as emissions fall, terrain becomes more complex, or cloud cover gets heavier.
Feature | Satellite Data | On-Site Sensors and Meters |
|---|---|---|
Gases detected | CO2, CH4 (regional to facility scale) | CO2, CO, NOx, SO2, CH4, VOCs (at source) |
Spatial resolution | Tens of meters to several kilometers | Essentially at the equipment or stack |
Temporal frequency | Daily to weekly revisits (weather-dependent) | Continuous or near-continuous |
Best MRV role | Hotspot screening, super-emitter detection, independent verification of aggregated emissions | Regulatory compliance, equipment-level performance tracking, operational control |
If the same location gets flagged again and again, that should prompt a ground check. It should not trigger an automatic reset of the inventory.
Production logs, maintenance records, and digital audit trails
When direct measurements are missing, activity data carries a lot of weight. Production logs support calculation-based estimates using approved emission factors - for example, tons of clinker per day, batch counts, or operating hours - and those estimates can be reconciled against CEMS outputs and meter readings.[24][25][27] Fuel receipts, utility bills, and inventory records add another line of evidence. If natural gas receipts don’t line up with metered consumption, that gap may point to unmetered losses that might otherwise stay hidden.[24][28] In practice, these records should be digitally captured, time-stamped, and tied to the right facility and emission source.
Maintenance and calibration records are just as important. They help show whether measured data can be trusted over time. Good logs let the MRV system identify valid and invalid data periods, then apply approved substitution methods where needed.[19][21]
A digital audit trail does something simple but powerful: it records every change to emissions data, who made it, when it happened, and why. With time stamps, user IDs, and version control, earlier data states can be rebuilt and each revision can be traced.[22][23][26] That matters for regulatory compliance, decarbonization project claims, and carbon accounting. In other words, the audit trail isn’t just back-office paperwork. It becomes part of the verification case.
EPA reporting systems run thousands of automated checks, and facilities must keep monitoring, test, and maintenance records for at least three years.[20][2][19][1][21] For carbon credit verification and project claims, keeping version-controlled records longer than the minimum is often a smart move.
These records feed the reporting layer that turns plant data into auditable outputs.
Reporting platforms: Turning raw plant data into auditable MRV outputs
Sensors, meters, and records don’t do much on their own. The value shows up when software turns all that plant data into filing-ready MRV outputs that teams can defend in an audit.
What a strong industrial MRV platform should do
A solid MRV platform should pull DCS historians, CEMS feeds, utility meters, ERP systems, and maintenance records into one shared data model. From there, it uses factors from the GHG Protocol, EPA Part 98, and ISO 14064-1 to convert activity data into tCO₂e through traceable calculations.
When data is missing or falls outside an expected range, the platform should catch it, flag it, apply the approved substitution method, and log the correction. Version control matters too. Teams need to reproduce filed reports later and restate them when methods change. Role-based approvals should also support the full review path: operator validation, EHS review, and corporate sign-off.
MRV Need | Platform Capability Required |
|---|---|
Regulatory compliance (EPA, state air agencies) | Structured emissions-factor libraries; regulatory report templates; calculation audit trail |
Operational performance tracking | Near-real-time dashboards; intensity metrics such as lbs CO₂e per ton of product |
ESG and investor disclosure | Multi-framework report generation; Scope 1, 2, and relevant Scope 3 rollups |
Audit readiness | Granular data lineage; exception logs; version-controlled methodology records |
Decarbonization planning | Target-tracking views; scenario analysis; progress against reduction trajectories |
How Council Fire can help build a digital MRV system
For facilities that already have some measurement and reporting tools in place, the next move is to connect them into one defensible workflow. In most plants, the data already exists in pieces. The hard part is bringing those pieces together into one MRV system that people can trust.
Council Fire helps facilities map existing meters, historians, ERP data, and reporting workflows into a clear MRV architecture. That work includes assigning data sources to emission categories, choosing calculation methods, and aligning outputs with compliance, finance, and decarbonization planning. The aim is straightforward: build a system that keeps working as processes, data sources, and reporting rules shift over time.
That same architecture also makes it easier to match the right tool to each emission source.
Best-fit tools by plant operation and a closing summary
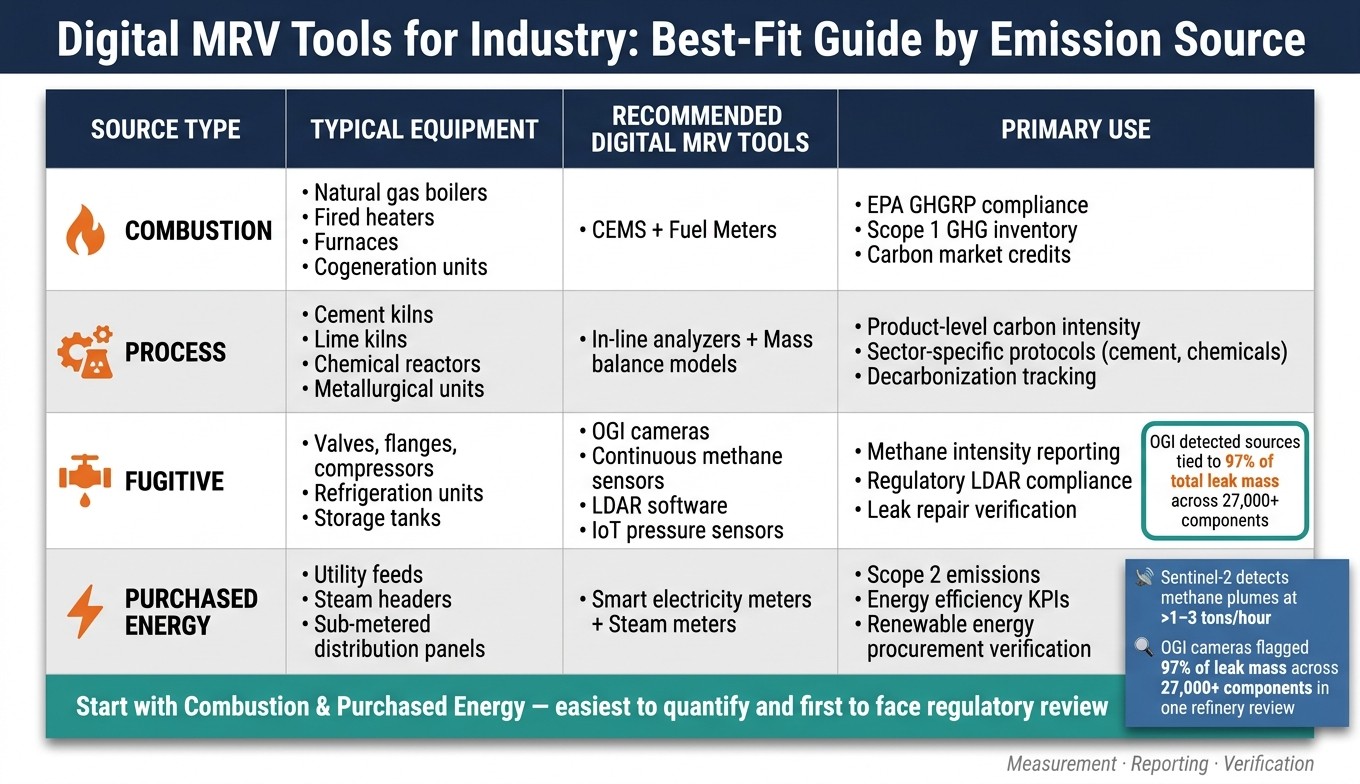
Digital MRV Tools for Industry: Best-Fit Guide by Emission Source
Best tool by emission source: combustion, process, fugitive, and purchased energy
Match the depth of measurement to the size of the source, the level of regulatory risk, and how tightly emissions move with production.
Once plant data, remote evidence, and audit logs are set up, the next step is simple: pick the right tool for each source. At that point, the job is less about adding more systems and more about choosing the simplest defensible option for each emission type.
Use the table below as an implementation map, not a scorecard for which tool is more advanced.
Source Type | Typical Equipment | Recommended Digital MRV Tools | Primary Use |
|---|---|---|---|
Combustion | Natural gas boilers, fired heaters, furnaces, cogeneration units | CEMS and fuel meters | EPA GHGRP compliance; Scope 1 GHG inventory; carbon market credits |
Process | Cement kilns, lime kilns, chemical reactors, metallurgical units | In-line analyzers and mass balance models | Product-level carbon intensity; sector-specific protocols (cement, chemicals); decarbonization tracking |
Fugitive | Valves, flanges, compressors, refrigeration units, storage tanks | OGI cameras, continuous methane sensors, LDAR software, IoT pressure sensors | Methane intensity reporting; regulatory LDAR compliance; leak repair verification |
Purchased Energy | Utility feeds, steam headers, sub-metered distribution panels | Smart electricity and steam meters | Scope 2 emissions; energy efficiency KPIs; renewable energy procurement verification |
A good starting point is combustion and purchased energy. Those sources are often the easiest to quantify and the first ones reviewers will check. Process and fugitive monitoring can come next as data systems improve and budget opens up.
Conclusion: What to keep in mind when building digital MRV in industry
Start with the biggest sources and the ones under the most scrutiny. For everything else, use methods you can defend and document well. In practice, traceability is what turns MRV data into audit-ready evidence. Every number in a filed report should point back to a raw measurement, a calibration record, or a written calculation. That chain is what third-party verifiers look for under ISO 14064-3, and it is what regulators expect when they review EPA GHGRP submissions.
Satellite checks and digital audit trails fit best in the verification layer, especially when direct measurement is limited or temporarily down. They do not replace plant data, but they can help confirm it, flag gaps, and support review.
Build the system so it can take change without forcing a full rebuild. Emission factors change. Regulations move. New production lines get added. A modular MRV setup - one where new sources and tools can slot in without reworking the whole structure - will last longer than a system built around one reporting deadline. It also makes retrofit, fuel-switching, and efficiency choices much easier to defend.
FAQs
What should an industrial MRV system include first?
Start by defining your operational and organizational boundaries. That step sets the rules of the game: what’s in scope, what’s out, and which parts of the business will feed the reporting process.
From there, map your reporting obligations - such as GHG Protocol, CSRD, or CDP - so your data collection work lines up with every framework you need to support. Done well, this saves a lot of cleanup later and keeps teams from chasing the same numbers in different formats.
Next, identify your emission sources and connect the key data points to the systems that already hold them, whether that’s utility invoices, ERP data, or IoT sensors. The goal is simple: know where each figure comes from and how it enters your reporting flow.
Set data governance, ownership, and roles at the start. If no one knows who owns the data, reviews it, or fixes issues, the process can go sideways fast.
When should a plant use CEMS instead of fuel-based estimates?
A plant should use CEMS when it needs the highest precision in emissions data. Fuel-based estimates rely on activity data and emission factors. CEMS, by contrast, measures actual emissions directly and in real time.
That matters most in complex operations where accuracy can't be left to averages. CEMS gives teams steady, verifiable data, cuts down on manual errors, and lowers the risk of overestimating emissions that can come with factor-based methods.
How do satellite data and audit trails support verification?
Satellite data helps teams check operational footprints across large areas, using outside evidence to back up emissions reports with more confidence.
Digital audit trails make every reported figure traceable to its source. They show who entered the data, when they entered it, and which calculations or approvals were used. Put together, these tools strengthen data integrity and leave reporting better prepared for audits.
Related Blog Posts
Latest Articles
©2025

Narrative Change and Power Building: The Missing Half of Advocacy
Narrative change is the process of disrupting dominant narratives that normalize inequity and advancing new narratives from historically marginalized communities.

Funding Resilience Without Federal Grants
BRIC is unreliable and FEMA is shrinking. Here's how cities fund climate resilience with dedicated revenue, blended finance, and a coordinating authority.

The ESG Blind Spot: How AI Is Finding Risks in Companies Nobody Else Is Watching
Norway's sovereign wealth fund uses AI to screen 7,200 portfolio companies for forced labor and corruption within 24 hours. The real story is the emerging-market coverage gap that traditional ESG data vendors miss — and what it means for any company with a global supply chain.
Narrative Change and Power Building: The Missing Half of Advocacy
Narrative change is the process of disrupting dominant narratives that normalize inequity and advancing new narratives from historically marginalized communities.
Funding Resilience Without Federal Grants
BRIC is unreliable and FEMA is shrinking. Here's how cities fund climate resilience with dedicated revenue, blended finance, and a coordinating authority.
The ESG Blind Spot: How AI Is Finding Risks in Companies Nobody Else Is Watching
Norway's sovereign wealth fund uses AI to screen 7,200 portfolio companies for forced labor and corruption within 24 hours. The real story is the emerging-market coverage gap that traditional ESG data vendors miss — and what it means for any company with a global supply chain.
FAQ
01
What does it really mean to “redefine profit”?
02
What makes Council Fire different?
03
Who does Council Fire work with?
04
What does working with Council Fire actually look like?
05
How does Council Fire help organizations turn big goals into action?
06
How does Council Fire define and measure success?
Sep 12, 2026
Digital MRV for Industry: Key Tools and Uses
Sustainability Strategy
In This Article
Measure, report, and verify industrial emissions with CEMS, smart meters, leak sensors, satellite checks, and MRV software using traceable audit trails.
Digital MRV for Industry: Key Tools and Uses
If you want cleaner emissions data, start with three things: direct measurement, traceable records, and software that can show where every number came from. That is the core idea behind digital MRV in industry.
I see the article making one point very clearly: the best MRV setup is not the one with the most tools. It is the one that uses the right tool for each source, keeps a clear data trail, and turns plant data into reports a regulator, verifier, or finance team can check.
Here’s the short version:
Measurement means reading emissions, fuel, and energy data from the plant.
Reporting means turning that data into inventories, filings, and internal metrics.
Verification means checking that the data is correct, traceable, and ready for review.
Combustion and purchased energy are often the first places to start because they are easier to measure and often get the first review.
CEMS, utility meters, leak tools, and in-line analyzers form the main on-site tool set.
Satellite data, production logs, maintenance files, and audit trails help fill gaps and support checks.
MRV software ties everything together with calculation rules, exception handling, version history, and approvals.
A few facts stand out. The article notes that Sentinel-2 can detect methane plumes at roughly above 1–3 tons per hour, while one refinery review found an OGI camera flagged sources tied to 97% of total leak mass emissions across more than 27,000 components. Those examples show the same lesson: use direct plant data first, then use outside checks and records to support it.
If I had to boil the article down to one simple rule, it would be this: every reported number should link back to a raw reading, a calibration log, or a written calculation. That is what makes digital MRV usable across plant teams and ready for review.
Tool group | What it does best | Where it fits |
|---|---|---|
CEMS | Measures stack emissions in near real time | Combustion sources and air compliance |
Smart meters | Tracks electricity, gas, steam, and heat by asset or line | Scope 1 and Scope 2 energy tracking |
Process and leak sensors | Finds process gases, refrigerant leaks, and fugitive emissions | Kilns, reactors, refrigeration, LDAR |
Satellite data | Screens for large methane or CO2 hotspots | Site-wide checks and missing-data support |
Logs and audit trails | Documents changes, downtime, calibration, and estimates | Verification and report support |
MRV platforms | Converts raw data into filing-ready outputs | Reporting, approvals, and restatements |
So if you are building an industrial MRV system, the path is simple: measure big sources first, log every change, and use software that can explain the numbers without guesswork.
dMRV: How to Digital Measurement, Reporting and Verification Simplifies Sustainability Reporting
On-site tools: Sensors and meters for measuring plant emissions and energy use
On-site measurement is the starting point for digital MRV. Sensors and meters record emissions and energy where they happen, before the data moves into reporting systems. In most plants, the core tools are CEMS, utility meters, and process or leak sensors. Combustion sources usually come first, since they produce the most direct and continuous stream of data.
Continuous emissions monitoring systems for stacks, boilers, and heaters
CEMS are installed on flue gas stacks, boilers, and process heaters. They continuously sample gas concentrations - NOₓ, SO₂, CO₂, and CO - along with flow rate, then calculate emission rates in near real time. The EPA treats CEMS as the highest-confidence measurement method because the data are direct, continuous, and governed by strict QA/QC rules.[10] For large combustion units, that makes CEMS the strongest source of direct data, and for many major regulated sources, they are required.
That value goes beyond compliance. Hourly CEMS data helps operators spot fuel waste, catch equipment drift early, and build the kind of record decarbonization projects depend on.
Approach | Data Frequency | Verification Strength | Regulatory Fit | Best Use |
|---|---|---|---|---|
CEMS | Continuous (hourly or sub-hourly) | High - direct measurement with QA/QC | Required or strongly preferred for major units under Part 75 and some MACT standards | Compliance and optimization |
Periodic Stack Testing | Campaign-based (every 1–3 years) | Medium-high - accurate under test conditions | Used for initial performance tests and periodic compliance checks | Verification and calibration |
Fuel-Based Calculations | Monthly or annual | Medium-low - relies on emission factors and assumptions | Allowed under some rules when CEMS or stack tests aren't used | Screening and estimation |
Once combustion is measured, the next job is to track the energy inputs behind it.
Smart electricity, gas, steam, and heat meters for utilities and production lines
Interval submeters record electricity, gas, steam, and heat every 15 minutes to hourly. That makes it much easier to assign energy use and emissions to a specific asset or production line. Instead of relying only on plant-wide totals, teams can isolate a boiler, kiln, or line-level load.[3] Putting submeters at the right points - electrical panels, natural gas headers, and steam distribution junctions - gives plants the process-level data needed for both efficiency work and emissions tracking.[11]
Meter Type | Installation Point | Emissions Scope | Best Use |
|---|---|---|---|
Electricity interval meter | Utility service entrance, main switchgear, production line sub-panels | Scope 2 | Plant-wide electricity use, line-level energy intensity, efficiency project verification |
Gas flow meter | Main natural gas supply line, individual boilers, process heaters, kilns | Scope 1 | Fuel-based CO₂ calculations, boiler optimization, CEMS fuel flow validation |
Steam meter | Boiler steam outlet, main steam headers, branch lines to high-load processes | Scope 1 (on-site generation); Scope 2 (imported steam) | Steam intensity per unit of production, diagnosing steam losses |
Heat (thermal energy) meter | Hot water loops, heat recovery circuits, district energy interfaces | Scope 1 (on-site); Scope 2 (purchased heat) | Evaluating heat recovery projects, linking thermal loads to fuel use and emissions |
A sound MRV setup usually means metering all major sources at intervals of one hour or less. If anything remains unmetered, that residual should be estimated clearly and documented.[12] Meters cover energy use well, but they do not catch everything. Process emissions and leaks are the next layer.
Process and fugitive emissions sensors for kilns, reactors, refrigeration, and leak points
Not every Scope 1 emission comes from combustion. Process gas monitoring and leak detection often expose emissions that can be cut through maintenance or process changes.
Kilns and reactors release process CO₂ and other gases as part of chemical reactions. Refrigeration systems can lose high-global-warming-potential refrigerants through slow leaks. Valves, flanges, pumps, and compressors can leak methane and VOCs, and those losses add up fast if no one is watching.
For kilns and reactors, in-line gas analyzers - often infrared or FTIR-based - measure off-gas composition continuously. That supports both process control and emissions quantification through material balance.[6][7]
For refrigeration systems, the EPA GreenChill program points to two main sensor types:
Semiconductor detectors, which are cost-effective and tend to catch larger leaks above 50 ppm
Infrared analyzers, which are more sensitive and can detect leaks as low as 1–10 ppm[8]
For valves, flanges, pumps, and compressors, LDAR programs often rely on EPA Method 21 with portable analyzers or Optical Gas Imaging (OGI) infrared cameras. EPA has approved OGI as an Alternative Work Practice under 40 CFR 60.18(g)–(i). In one refinery evaluation, a portable OGI camera identified components responsible for 97% of total leak mass emissions while scanning more than 27,000 components, and it did so in far less time than a Method 21 program would require.[9]
Good practice here is simple: connect each leak alert to a work order, a repair, and a follow-up reading. That way, every event has a time stamp and a component ID. For refrigerants, tracking charges, top-offs, and retirements alongside sensor data supports a mass-based emissions estimate that is more accurate than default emission factors alone.[4][5]
Where plant sensors cannot reach, remote data and records fill the remaining gaps.
Remote and digital evidence: Satellite data, production logs, and audit trails
On-site sensors measure emissions at the source. But sensors don’t run in a perfect world. Equipment goes down, signals drop, and data streams break. That’s where satellite data, production logs, and audit trails step in. They fill missing pieces, check reported numbers against outside evidence, and help keep MRV defensible. If an instrument stops, remote data and records help keep the chain of evidence intact.
Satellite data for methane, CO2, and regional source screening
Satellite data works best when you need an outside view across a big footprint or a hard-to-reach site. For methane, instruments such as TROPOMI on Sentinel-5P and hyperspectral imagers like EMIT can spot large plumes from gas processing plants, compressor stations, LNG terminals, and major pipeline leaks. For CO2, tools like OCO-3 in SAM mode can screen refinery corridors, cement clusters, or steel hubs, then compare observed concentrations with plant-reported inventories.[13][16][17][18]
Recent facility-level validation work shows that satellite methane estimates can come close to ground truth.[15][18] Sentinel-2 uses SWIR bands to detect methane plumes at roughly more than 1–3 tons per hour, while smaller chronic leaks often need targeted instruments with higher spatial detail.[14] Performance drops as emissions fall, terrain becomes more complex, or cloud cover gets heavier.
Feature | Satellite Data | On-Site Sensors and Meters |
|---|---|---|
Gases detected | CO2, CH4 (regional to facility scale) | CO2, CO, NOx, SO2, CH4, VOCs (at source) |
Spatial resolution | Tens of meters to several kilometers | Essentially at the equipment or stack |
Temporal frequency | Daily to weekly revisits (weather-dependent) | Continuous or near-continuous |
Best MRV role | Hotspot screening, super-emitter detection, independent verification of aggregated emissions | Regulatory compliance, equipment-level performance tracking, operational control |
If the same location gets flagged again and again, that should prompt a ground check. It should not trigger an automatic reset of the inventory.
Production logs, maintenance records, and digital audit trails
When direct measurements are missing, activity data carries a lot of weight. Production logs support calculation-based estimates using approved emission factors - for example, tons of clinker per day, batch counts, or operating hours - and those estimates can be reconciled against CEMS outputs and meter readings.[24][25][27] Fuel receipts, utility bills, and inventory records add another line of evidence. If natural gas receipts don’t line up with metered consumption, that gap may point to unmetered losses that might otherwise stay hidden.[24][28] In practice, these records should be digitally captured, time-stamped, and tied to the right facility and emission source.
Maintenance and calibration records are just as important. They help show whether measured data can be trusted over time. Good logs let the MRV system identify valid and invalid data periods, then apply approved substitution methods where needed.[19][21]
A digital audit trail does something simple but powerful: it records every change to emissions data, who made it, when it happened, and why. With time stamps, user IDs, and version control, earlier data states can be rebuilt and each revision can be traced.[22][23][26] That matters for regulatory compliance, decarbonization project claims, and carbon accounting. In other words, the audit trail isn’t just back-office paperwork. It becomes part of the verification case.
EPA reporting systems run thousands of automated checks, and facilities must keep monitoring, test, and maintenance records for at least three years.[20][2][19][1][21] For carbon credit verification and project claims, keeping version-controlled records longer than the minimum is often a smart move.
These records feed the reporting layer that turns plant data into auditable outputs.
Reporting platforms: Turning raw plant data into auditable MRV outputs
Sensors, meters, and records don’t do much on their own. The value shows up when software turns all that plant data into filing-ready MRV outputs that teams can defend in an audit.
What a strong industrial MRV platform should do
A solid MRV platform should pull DCS historians, CEMS feeds, utility meters, ERP systems, and maintenance records into one shared data model. From there, it uses factors from the GHG Protocol, EPA Part 98, and ISO 14064-1 to convert activity data into tCO₂e through traceable calculations.
When data is missing or falls outside an expected range, the platform should catch it, flag it, apply the approved substitution method, and log the correction. Version control matters too. Teams need to reproduce filed reports later and restate them when methods change. Role-based approvals should also support the full review path: operator validation, EHS review, and corporate sign-off.
MRV Need | Platform Capability Required |
|---|---|
Regulatory compliance (EPA, state air agencies) | Structured emissions-factor libraries; regulatory report templates; calculation audit trail |
Operational performance tracking | Near-real-time dashboards; intensity metrics such as lbs CO₂e per ton of product |
ESG and investor disclosure | Multi-framework report generation; Scope 1, 2, and relevant Scope 3 rollups |
Audit readiness | Granular data lineage; exception logs; version-controlled methodology records |
Decarbonization planning | Target-tracking views; scenario analysis; progress against reduction trajectories |
How Council Fire can help build a digital MRV system
For facilities that already have some measurement and reporting tools in place, the next move is to connect them into one defensible workflow. In most plants, the data already exists in pieces. The hard part is bringing those pieces together into one MRV system that people can trust.
Council Fire helps facilities map existing meters, historians, ERP data, and reporting workflows into a clear MRV architecture. That work includes assigning data sources to emission categories, choosing calculation methods, and aligning outputs with compliance, finance, and decarbonization planning. The aim is straightforward: build a system that keeps working as processes, data sources, and reporting rules shift over time.
That same architecture also makes it easier to match the right tool to each emission source.
Best-fit tools by plant operation and a closing summary
Digital MRV Tools for Industry: Best-Fit Guide by Emission Source
Best tool by emission source: combustion, process, fugitive, and purchased energy
Match the depth of measurement to the size of the source, the level of regulatory risk, and how tightly emissions move with production.
Once plant data, remote evidence, and audit logs are set up, the next step is simple: pick the right tool for each source. At that point, the job is less about adding more systems and more about choosing the simplest defensible option for each emission type.
Use the table below as an implementation map, not a scorecard for which tool is more advanced.
Source Type | Typical Equipment | Recommended Digital MRV Tools | Primary Use |
|---|---|---|---|
Combustion | Natural gas boilers, fired heaters, furnaces, cogeneration units | CEMS and fuel meters | EPA GHGRP compliance; Scope 1 GHG inventory; carbon market credits |
Process | Cement kilns, lime kilns, chemical reactors, metallurgical units | In-line analyzers and mass balance models | Product-level carbon intensity; sector-specific protocols (cement, chemicals); decarbonization tracking |
Fugitive | Valves, flanges, compressors, refrigeration units, storage tanks | OGI cameras, continuous methane sensors, LDAR software, IoT pressure sensors | Methane intensity reporting; regulatory LDAR compliance; leak repair verification |
Purchased Energy | Utility feeds, steam headers, sub-metered distribution panels | Smart electricity and steam meters | Scope 2 emissions; energy efficiency KPIs; renewable energy procurement verification |
A good starting point is combustion and purchased energy. Those sources are often the easiest to quantify and the first ones reviewers will check. Process and fugitive monitoring can come next as data systems improve and budget opens up.
Conclusion: What to keep in mind when building digital MRV in industry
Start with the biggest sources and the ones under the most scrutiny. For everything else, use methods you can defend and document well. In practice, traceability is what turns MRV data into audit-ready evidence. Every number in a filed report should point back to a raw measurement, a calibration record, or a written calculation. That chain is what third-party verifiers look for under ISO 14064-3, and it is what regulators expect when they review EPA GHGRP submissions.
Satellite checks and digital audit trails fit best in the verification layer, especially when direct measurement is limited or temporarily down. They do not replace plant data, but they can help confirm it, flag gaps, and support review.
Build the system so it can take change without forcing a full rebuild. Emission factors change. Regulations move. New production lines get added. A modular MRV setup - one where new sources and tools can slot in without reworking the whole structure - will last longer than a system built around one reporting deadline. It also makes retrofit, fuel-switching, and efficiency choices much easier to defend.
FAQs
What should an industrial MRV system include first?
Start by defining your operational and organizational boundaries. That step sets the rules of the game: what’s in scope, what’s out, and which parts of the business will feed the reporting process.
From there, map your reporting obligations - such as GHG Protocol, CSRD, or CDP - so your data collection work lines up with every framework you need to support. Done well, this saves a lot of cleanup later and keeps teams from chasing the same numbers in different formats.
Next, identify your emission sources and connect the key data points to the systems that already hold them, whether that’s utility invoices, ERP data, or IoT sensors. The goal is simple: know where each figure comes from and how it enters your reporting flow.
Set data governance, ownership, and roles at the start. If no one knows who owns the data, reviews it, or fixes issues, the process can go sideways fast.
When should a plant use CEMS instead of fuel-based estimates?
A plant should use CEMS when it needs the highest precision in emissions data. Fuel-based estimates rely on activity data and emission factors. CEMS, by contrast, measures actual emissions directly and in real time.
That matters most in complex operations where accuracy can't be left to averages. CEMS gives teams steady, verifiable data, cuts down on manual errors, and lowers the risk of overestimating emissions that can come with factor-based methods.
How do satellite data and audit trails support verification?
Satellite data helps teams check operational footprints across large areas, using outside evidence to back up emissions reports with more confidence.
Digital audit trails make every reported figure traceable to its source. They show who entered the data, when they entered it, and which calculations or approvals were used. Put together, these tools strengthen data integrity and leave reporting better prepared for audits.
Related Blog Posts
Latest Articles
©2025
Narrative Change and Power Building: The Missing Half of Advocacy
Narrative change is the process of disrupting dominant narratives that normalize inequity and advancing new narratives from historically marginalized communities.
Funding Resilience Without Federal Grants
BRIC is unreliable and FEMA is shrinking. Here's how cities fund climate resilience with dedicated revenue, blended finance, and a coordinating authority.
The ESG Blind Spot: How AI Is Finding Risks in Companies Nobody Else Is Watching
Norway's sovereign wealth fund uses AI to screen 7,200 portfolio companies for forced labor and corruption within 24 hours. The real story is the emerging-market coverage gap that traditional ESG data vendors miss — and what it means for any company with a global supply chain.
FAQ
01
What does it really mean to “redefine profit”?
02
What makes Council Fire different?
03
Who does Council Fire work with?
04
What does working with Council Fire actually look like?
05
How does Council Fire help organizations turn big goals into action?
06
How does Council Fire define and measure success?
Sep 12, 2026
Digital MRV for Industry: Key Tools and Uses
Sustainability Strategy
In This Article
Measure, report, and verify industrial emissions with CEMS, smart meters, leak sensors, satellite checks, and MRV software using traceable audit trails.
Digital MRV for Industry: Key Tools and Uses
If you want cleaner emissions data, start with three things: direct measurement, traceable records, and software that can show where every number came from. That is the core idea behind digital MRV in industry.
I see the article making one point very clearly: the best MRV setup is not the one with the most tools. It is the one that uses the right tool for each source, keeps a clear data trail, and turns plant data into reports a regulator, verifier, or finance team can check.
Here’s the short version:
Measurement means reading emissions, fuel, and energy data from the plant.
Reporting means turning that data into inventories, filings, and internal metrics.
Verification means checking that the data is correct, traceable, and ready for review.
Combustion and purchased energy are often the first places to start because they are easier to measure and often get the first review.
CEMS, utility meters, leak tools, and in-line analyzers form the main on-site tool set.
Satellite data, production logs, maintenance files, and audit trails help fill gaps and support checks.
MRV software ties everything together with calculation rules, exception handling, version history, and approvals.
A few facts stand out. The article notes that Sentinel-2 can detect methane plumes at roughly above 1–3 tons per hour, while one refinery review found an OGI camera flagged sources tied to 97% of total leak mass emissions across more than 27,000 components. Those examples show the same lesson: use direct plant data first, then use outside checks and records to support it.
If I had to boil the article down to one simple rule, it would be this: every reported number should link back to a raw reading, a calibration log, or a written calculation. That is what makes digital MRV usable across plant teams and ready for review.
Tool group | What it does best | Where it fits |
|---|---|---|
CEMS | Measures stack emissions in near real time | Combustion sources and air compliance |
Smart meters | Tracks electricity, gas, steam, and heat by asset or line | Scope 1 and Scope 2 energy tracking |
Process and leak sensors | Finds process gases, refrigerant leaks, and fugitive emissions | Kilns, reactors, refrigeration, LDAR |
Satellite data | Screens for large methane or CO2 hotspots | Site-wide checks and missing-data support |
Logs and audit trails | Documents changes, downtime, calibration, and estimates | Verification and report support |
MRV platforms | Converts raw data into filing-ready outputs | Reporting, approvals, and restatements |
So if you are building an industrial MRV system, the path is simple: measure big sources first, log every change, and use software that can explain the numbers without guesswork.
dMRV: How to Digital Measurement, Reporting and Verification Simplifies Sustainability Reporting
On-site tools: Sensors and meters for measuring plant emissions and energy use
On-site measurement is the starting point for digital MRV. Sensors and meters record emissions and energy where they happen, before the data moves into reporting systems. In most plants, the core tools are CEMS, utility meters, and process or leak sensors. Combustion sources usually come first, since they produce the most direct and continuous stream of data.
Continuous emissions monitoring systems for stacks, boilers, and heaters
CEMS are installed on flue gas stacks, boilers, and process heaters. They continuously sample gas concentrations - NOₓ, SO₂, CO₂, and CO - along with flow rate, then calculate emission rates in near real time. The EPA treats CEMS as the highest-confidence measurement method because the data are direct, continuous, and governed by strict QA/QC rules.[10] For large combustion units, that makes CEMS the strongest source of direct data, and for many major regulated sources, they are required.
That value goes beyond compliance. Hourly CEMS data helps operators spot fuel waste, catch equipment drift early, and build the kind of record decarbonization projects depend on.
Approach | Data Frequency | Verification Strength | Regulatory Fit | Best Use |
|---|---|---|---|---|
CEMS | Continuous (hourly or sub-hourly) | High - direct measurement with QA/QC | Required or strongly preferred for major units under Part 75 and some MACT standards | Compliance and optimization |
Periodic Stack Testing | Campaign-based (every 1–3 years) | Medium-high - accurate under test conditions | Used for initial performance tests and periodic compliance checks | Verification and calibration |
Fuel-Based Calculations | Monthly or annual | Medium-low - relies on emission factors and assumptions | Allowed under some rules when CEMS or stack tests aren't used | Screening and estimation |
Once combustion is measured, the next job is to track the energy inputs behind it.
Smart electricity, gas, steam, and heat meters for utilities and production lines
Interval submeters record electricity, gas, steam, and heat every 15 minutes to hourly. That makes it much easier to assign energy use and emissions to a specific asset or production line. Instead of relying only on plant-wide totals, teams can isolate a boiler, kiln, or line-level load.[3] Putting submeters at the right points - electrical panels, natural gas headers, and steam distribution junctions - gives plants the process-level data needed for both efficiency work and emissions tracking.[11]
Meter Type | Installation Point | Emissions Scope | Best Use |
|---|---|---|---|
Electricity interval meter | Utility service entrance, main switchgear, production line sub-panels | Scope 2 | Plant-wide electricity use, line-level energy intensity, efficiency project verification |
Gas flow meter | Main natural gas supply line, individual boilers, process heaters, kilns | Scope 1 | Fuel-based CO₂ calculations, boiler optimization, CEMS fuel flow validation |
Steam meter | Boiler steam outlet, main steam headers, branch lines to high-load processes | Scope 1 (on-site generation); Scope 2 (imported steam) | Steam intensity per unit of production, diagnosing steam losses |
Heat (thermal energy) meter | Hot water loops, heat recovery circuits, district energy interfaces | Scope 1 (on-site); Scope 2 (purchased heat) | Evaluating heat recovery projects, linking thermal loads to fuel use and emissions |
A sound MRV setup usually means metering all major sources at intervals of one hour or less. If anything remains unmetered, that residual should be estimated clearly and documented.[12] Meters cover energy use well, but they do not catch everything. Process emissions and leaks are the next layer.
Process and fugitive emissions sensors for kilns, reactors, refrigeration, and leak points
Not every Scope 1 emission comes from combustion. Process gas monitoring and leak detection often expose emissions that can be cut through maintenance or process changes.
Kilns and reactors release process CO₂ and other gases as part of chemical reactions. Refrigeration systems can lose high-global-warming-potential refrigerants through slow leaks. Valves, flanges, pumps, and compressors can leak methane and VOCs, and those losses add up fast if no one is watching.
For kilns and reactors, in-line gas analyzers - often infrared or FTIR-based - measure off-gas composition continuously. That supports both process control and emissions quantification through material balance.[6][7]
For refrigeration systems, the EPA GreenChill program points to two main sensor types:
Semiconductor detectors, which are cost-effective and tend to catch larger leaks above 50 ppm
Infrared analyzers, which are more sensitive and can detect leaks as low as 1–10 ppm[8]
For valves, flanges, pumps, and compressors, LDAR programs often rely on EPA Method 21 with portable analyzers or Optical Gas Imaging (OGI) infrared cameras. EPA has approved OGI as an Alternative Work Practice under 40 CFR 60.18(g)–(i). In one refinery evaluation, a portable OGI camera identified components responsible for 97% of total leak mass emissions while scanning more than 27,000 components, and it did so in far less time than a Method 21 program would require.[9]
Good practice here is simple: connect each leak alert to a work order, a repair, and a follow-up reading. That way, every event has a time stamp and a component ID. For refrigerants, tracking charges, top-offs, and retirements alongside sensor data supports a mass-based emissions estimate that is more accurate than default emission factors alone.[4][5]
Where plant sensors cannot reach, remote data and records fill the remaining gaps.
Remote and digital evidence: Satellite data, production logs, and audit trails
On-site sensors measure emissions at the source. But sensors don’t run in a perfect world. Equipment goes down, signals drop, and data streams break. That’s where satellite data, production logs, and audit trails step in. They fill missing pieces, check reported numbers against outside evidence, and help keep MRV defensible. If an instrument stops, remote data and records help keep the chain of evidence intact.
Satellite data for methane, CO2, and regional source screening
Satellite data works best when you need an outside view across a big footprint or a hard-to-reach site. For methane, instruments such as TROPOMI on Sentinel-5P and hyperspectral imagers like EMIT can spot large plumes from gas processing plants, compressor stations, LNG terminals, and major pipeline leaks. For CO2, tools like OCO-3 in SAM mode can screen refinery corridors, cement clusters, or steel hubs, then compare observed concentrations with plant-reported inventories.[13][16][17][18]
Recent facility-level validation work shows that satellite methane estimates can come close to ground truth.[15][18] Sentinel-2 uses SWIR bands to detect methane plumes at roughly more than 1–3 tons per hour, while smaller chronic leaks often need targeted instruments with higher spatial detail.[14] Performance drops as emissions fall, terrain becomes more complex, or cloud cover gets heavier.
Feature | Satellite Data | On-Site Sensors and Meters |
|---|---|---|
Gases detected | CO2, CH4 (regional to facility scale) | CO2, CO, NOx, SO2, CH4, VOCs (at source) |
Spatial resolution | Tens of meters to several kilometers | Essentially at the equipment or stack |
Temporal frequency | Daily to weekly revisits (weather-dependent) | Continuous or near-continuous |
Best MRV role | Hotspot screening, super-emitter detection, independent verification of aggregated emissions | Regulatory compliance, equipment-level performance tracking, operational control |
If the same location gets flagged again and again, that should prompt a ground check. It should not trigger an automatic reset of the inventory.
Production logs, maintenance records, and digital audit trails
When direct measurements are missing, activity data carries a lot of weight. Production logs support calculation-based estimates using approved emission factors - for example, tons of clinker per day, batch counts, or operating hours - and those estimates can be reconciled against CEMS outputs and meter readings.[24][25][27] Fuel receipts, utility bills, and inventory records add another line of evidence. If natural gas receipts don’t line up with metered consumption, that gap may point to unmetered losses that might otherwise stay hidden.[24][28] In practice, these records should be digitally captured, time-stamped, and tied to the right facility and emission source.
Maintenance and calibration records are just as important. They help show whether measured data can be trusted over time. Good logs let the MRV system identify valid and invalid data periods, then apply approved substitution methods where needed.[19][21]
A digital audit trail does something simple but powerful: it records every change to emissions data, who made it, when it happened, and why. With time stamps, user IDs, and version control, earlier data states can be rebuilt and each revision can be traced.[22][23][26] That matters for regulatory compliance, decarbonization project claims, and carbon accounting. In other words, the audit trail isn’t just back-office paperwork. It becomes part of the verification case.
EPA reporting systems run thousands of automated checks, and facilities must keep monitoring, test, and maintenance records for at least three years.[20][2][19][1][21] For carbon credit verification and project claims, keeping version-controlled records longer than the minimum is often a smart move.
These records feed the reporting layer that turns plant data into auditable outputs.
Reporting platforms: Turning raw plant data into auditable MRV outputs
Sensors, meters, and records don’t do much on their own. The value shows up when software turns all that plant data into filing-ready MRV outputs that teams can defend in an audit.
What a strong industrial MRV platform should do
A solid MRV platform should pull DCS historians, CEMS feeds, utility meters, ERP systems, and maintenance records into one shared data model. From there, it uses factors from the GHG Protocol, EPA Part 98, and ISO 14064-1 to convert activity data into tCO₂e through traceable calculations.
When data is missing or falls outside an expected range, the platform should catch it, flag it, apply the approved substitution method, and log the correction. Version control matters too. Teams need to reproduce filed reports later and restate them when methods change. Role-based approvals should also support the full review path: operator validation, EHS review, and corporate sign-off.
MRV Need | Platform Capability Required |
|---|---|
Regulatory compliance (EPA, state air agencies) | Structured emissions-factor libraries; regulatory report templates; calculation audit trail |
Operational performance tracking | Near-real-time dashboards; intensity metrics such as lbs CO₂e per ton of product |
ESG and investor disclosure | Multi-framework report generation; Scope 1, 2, and relevant Scope 3 rollups |
Audit readiness | Granular data lineage; exception logs; version-controlled methodology records |
Decarbonization planning | Target-tracking views; scenario analysis; progress against reduction trajectories |
How Council Fire can help build a digital MRV system
For facilities that already have some measurement and reporting tools in place, the next move is to connect them into one defensible workflow. In most plants, the data already exists in pieces. The hard part is bringing those pieces together into one MRV system that people can trust.
Council Fire helps facilities map existing meters, historians, ERP data, and reporting workflows into a clear MRV architecture. That work includes assigning data sources to emission categories, choosing calculation methods, and aligning outputs with compliance, finance, and decarbonization planning. The aim is straightforward: build a system that keeps working as processes, data sources, and reporting rules shift over time.
That same architecture also makes it easier to match the right tool to each emission source.
Best-fit tools by plant operation and a closing summary
Digital MRV Tools for Industry: Best-Fit Guide by Emission Source
Best tool by emission source: combustion, process, fugitive, and purchased energy
Match the depth of measurement to the size of the source, the level of regulatory risk, and how tightly emissions move with production.
Once plant data, remote evidence, and audit logs are set up, the next step is simple: pick the right tool for each source. At that point, the job is less about adding more systems and more about choosing the simplest defensible option for each emission type.
Use the table below as an implementation map, not a scorecard for which tool is more advanced.
Source Type | Typical Equipment | Recommended Digital MRV Tools | Primary Use |
|---|---|---|---|
Combustion | Natural gas boilers, fired heaters, furnaces, cogeneration units | CEMS and fuel meters | EPA GHGRP compliance; Scope 1 GHG inventory; carbon market credits |
Process | Cement kilns, lime kilns, chemical reactors, metallurgical units | In-line analyzers and mass balance models | Product-level carbon intensity; sector-specific protocols (cement, chemicals); decarbonization tracking |
Fugitive | Valves, flanges, compressors, refrigeration units, storage tanks | OGI cameras, continuous methane sensors, LDAR software, IoT pressure sensors | Methane intensity reporting; regulatory LDAR compliance; leak repair verification |
Purchased Energy | Utility feeds, steam headers, sub-metered distribution panels | Smart electricity and steam meters | Scope 2 emissions; energy efficiency KPIs; renewable energy procurement verification |
A good starting point is combustion and purchased energy. Those sources are often the easiest to quantify and the first ones reviewers will check. Process and fugitive monitoring can come next as data systems improve and budget opens up.
Conclusion: What to keep in mind when building digital MRV in industry
Start with the biggest sources and the ones under the most scrutiny. For everything else, use methods you can defend and document well. In practice, traceability is what turns MRV data into audit-ready evidence. Every number in a filed report should point back to a raw measurement, a calibration record, or a written calculation. That chain is what third-party verifiers look for under ISO 14064-3, and it is what regulators expect when they review EPA GHGRP submissions.
Satellite checks and digital audit trails fit best in the verification layer, especially when direct measurement is limited or temporarily down. They do not replace plant data, but they can help confirm it, flag gaps, and support review.
Build the system so it can take change without forcing a full rebuild. Emission factors change. Regulations move. New production lines get added. A modular MRV setup - one where new sources and tools can slot in without reworking the whole structure - will last longer than a system built around one reporting deadline. It also makes retrofit, fuel-switching, and efficiency choices much easier to defend.
FAQs
What should an industrial MRV system include first?
Start by defining your operational and organizational boundaries. That step sets the rules of the game: what’s in scope, what’s out, and which parts of the business will feed the reporting process.
From there, map your reporting obligations - such as GHG Protocol, CSRD, or CDP - so your data collection work lines up with every framework you need to support. Done well, this saves a lot of cleanup later and keeps teams from chasing the same numbers in different formats.
Next, identify your emission sources and connect the key data points to the systems that already hold them, whether that’s utility invoices, ERP data, or IoT sensors. The goal is simple: know where each figure comes from and how it enters your reporting flow.
Set data governance, ownership, and roles at the start. If no one knows who owns the data, reviews it, or fixes issues, the process can go sideways fast.
When should a plant use CEMS instead of fuel-based estimates?
A plant should use CEMS when it needs the highest precision in emissions data. Fuel-based estimates rely on activity data and emission factors. CEMS, by contrast, measures actual emissions directly and in real time.
That matters most in complex operations where accuracy can't be left to averages. CEMS gives teams steady, verifiable data, cuts down on manual errors, and lowers the risk of overestimating emissions that can come with factor-based methods.
How do satellite data and audit trails support verification?
Satellite data helps teams check operational footprints across large areas, using outside evidence to back up emissions reports with more confidence.
Digital audit trails make every reported figure traceable to its source. They show who entered the data, when they entered it, and which calculations or approvals were used. Put together, these tools strengthen data integrity and leave reporting better prepared for audits.
Related Blog Posts
Latest Articles
©2025
Narrative Change and Power Building: The Missing Half of Advocacy
Narrative change is the process of disrupting dominant narratives that normalize inequity and advancing new narratives from historically marginalized communities.
Funding Resilience Without Federal Grants
BRIC is unreliable and FEMA is shrinking. Here's how cities fund climate resilience with dedicated revenue, blended finance, and a coordinating authority.
The ESG Blind Spot: How AI Is Finding Risks in Companies Nobody Else Is Watching
Norway's sovereign wealth fund uses AI to screen 7,200 portfolio companies for forced labor and corruption within 24 hours. The real story is the emerging-market coverage gap that traditional ESG data vendors miss — and what it means for any company with a global supply chain.
FAQ
What does it really mean to “redefine profit”?
What makes Council Fire different?
Who does Council Fire work with?
What does working with Council Fire actually look like?
How does Council Fire help organizations turn big goals into action?
How does Council Fire define and measure success?