
Sep 17, 2026
Water and Waste Metrics in Manufacturing
Sustainability Strategy
In This Article
Defines 10–15 core water and waste KPIs, plus boundaries, units, metering, and targets for plant-level control.
Water and Waste Metrics in Manufacturing
If you do not track water and waste with clear rules, you cannot control cost, permits, or plant risk. In U.S. manufacturing, direct water withdrawal is about 18.2 billion gallons per day, so even small errors in metering, scope, or units can distort plant decisions and year-over-year results.
I’d boil this article down to a few points:
Track the core water numbers: withdrawal, use, consumption, discharge, effluent quality, and reuse
Track the core waste numbers: total generated, hazardous vs. non-hazardous, diversion, and disposal route
Set rules first: plant boundary, source categories, units, metering, estimation rules, and rounding method
Use both total and intensity targets: for example, gallons per unit produced and total tons to landfill
Show the data clearly: short KPI summaries, plant tables, trend charts, and brief notes on what changed and why
I’d also keep the scorecard tight. In most plants, 10–15 indicators are enough to guide action without burying teams in extra data. The article’s main message is simple: pick a short set of numbers, define them the same way every year, and link each one to cost, compliance, and plant decisions.
Wastewater KPIs: Setting Metrics for Compliance and Cost Reduction
How to Choose the Right Water and Waste Metrics for Each Plant
Once the reporting framework is in place, the next step is to trim the scorecard down to the few metrics that push action at each plant. Not every number you track needs a spot on the main dashboard. The goal is a short, steady set of metrics that shows impact, points to operating trouble spots, helps with day-to-day choices, and holds up in year-over-year comparisons.
Core Water Metrics: Withdrawal, Use, Consumption, Discharge, and Reuse
Start with total water withdrawal by source. That usually means municipal supply, groundwater, surface water, and, when it applies, rainwater or reclaimed water. Then break that withdrawal into use types such as cooling towers, boilers, cleaning and sanitation, and product formulation. That second layer is where the data starts to help plant teams make decisions instead of just filling a report.
Water consumption is the share of withdrawn water that does not return through discharge. That includes evaporation, water built into product, and other losses. This metric matters even more in water-stressed areas, where every gallon counts.
Discharge should be tracked by destination, whether that is municipal sewer, surface water, or off-site treatment. Pair that with the main effluent quality measures so the plant can see both volume and condition.
For reuse and recycling, track two things:
The total volume of water recycled inside the plant
The reuse rate as a percentage of total water demand
A plant with closed-loop cooling or reused rinse water can cut withdrawal in a direct, measurable way.
Intensity metrics help connect water data to output. Use gallons per unit produced on plant dashboards because production managers can read and use that fast. Then convert the same performance into cubic meters per metric ton of output for GRI and CDP reporting. When you benchmark intensity, stay within the same industry. Comparing across sectors can skew the picture and lead to bad reads.
Core Waste and Effluent Metrics: Generation, Diversion, Disposal, and Quality
The same basic rule applies to waste: track the streams that affect cost, compliance, and process change the most.
Total waste generated is the starting point, split into hazardous and non-hazardous fractions under RCRA classification. [4] Still, the total by itself does not tell you where the problem sits. That is why waste by stream matters so much. Break it out into production scrap, packaging waste, sludge from wastewater treatment, and process residues such as spent chemicals or catalysts. Once you can see waste at the stream level, it becomes much easier to spot where process changes or packaging redesign can make the biggest dent. [4][5]
For treatment and disposal routes, track recycling, composting, energy recovery, incineration, and landfill in both absolute short tons and percentages. The waste diversion rate, calculated as (recycled + composted + energy recovered) ÷ total waste × 100, works well as a summary metric for circular economy progress. [7]
On the effluent side, most scorecards should include BOD, COD, TSS, pH, and nutrients such as total nitrogen and total phosphorus. [1][4] Use permit limits as the benchmark for BOD, COD, TSS, pH, nutrients, metals, and temperature where they apply. Track effluent quality on the permit sampling schedule and compare results against permit thresholds so small changes show up early, before they turn into bigger issues.
How to Decide Which Metrics Belong in the Final Scorecard
A simple way to screen each metric is to use three filters: regulatory relevance, operating cost, and plant control. If a metric is tied to a permit or legal duty, it belongs on the scorecard. If it links straight to cost, production uptime, or water supply risk, it belongs there too. And if plant-level decisions can move the number within one to three years, it is worth tracking. [2][3]
Most manufacturers end up with a core scorecard of 10–15 indicators. That usually includes total withdrawal, withdrawal intensity, consumption, main effluent parameters, total waste generated, the hazardous versus non-hazardous split, diversion rate, and a small set of process-specific KPIs such as scrap rate. [4][5][6] Extra metrics can still be tracked inside the plant, but the main scorecard should stay tight and focused on the numbers managers actually use.
After choosing the scorecard, define boundaries and units before data collection starts.
Set Boundaries, Units, and Data Rules Before Reporting
Once the scorecard is in place, the next step is simple but easy to skip: lock the scope, units, and data rules before collection begins. If that groundwork is fuzzy, plant totals won’t line up across sites. They also won’t roll up cleanly at the corporate level or stand up well in an audit. And when that happens, even well-chosen metrics stop being useful.
Define Plant Boundaries and Reporting Scope
Start with reporting boundaries. Decide whether reporting will use an operational control approach - meaning 100% of impacts from sites the company controls - or an equity share approach, where impacts are reported based on ownership share. Then apply that same rule across wholly owned plants, leased sites you operate, joint ventures, and contract manufacturers you control. [10][11][12][16]
At the plant level, be just as clear about the site boundary itself. Does it cover only production areas, or does it also include warehouses, maintenance shops, and offices? From there, map the full-site water balance across inflows such as municipal water, groundwater, and surface water, along with internal use, reuse loops, treatment systems, and discharge points. The goal is to make inflows and outflows reconcile within a defined tolerance. [13][14][17][22]
Waste needs the same discipline. State whether the scope covers only production waste or also includes maintenance waste, construction and renovation debris, and results from off-site treatment facilities. If construction or project-related waste is left out, a year-over-year drop can look better on paper than it is in practice. [15][18]
A clean boundary is what lets one plant’s totals sit next to another’s without guesswork.
Pick Units That Work for U.S. Operations and External Reports
For day-to-day plant use, stick with gallons for water and pounds or short tons for waste. Those are the units most teams already see on utility bills, meter readings, and hauler scale tickets, which cuts down on conversion mistakes. For outside sustainability reports, convert water to cubic meters (m³) and waste to metric tons. [19][20][21]
Keep the standard conversion factors inside the reporting system so every plant uses the same values:
1 U.S. gallon = 0.003785 m³
1 million gallons = 3,785 m³
2,204.6 pounds = 1 metric ton
Just as important, sum plant-level data before rounding, not after. It sounds minor, but small rounding gaps can pile up across a big site network. [20][24]
Common units keep plant data from going sideways when it moves into company-level reporting.
Improve Data Quality with Metering, Mass Balance, and Verification
Meter the big flow points: incoming supply, cooling tower makeup, boiler feedwater, and discharge outlets. Then reconcile those readings against utility bills on a regular basis so drift, leaks, or bad readings show up early. For waste, lean on scale tickets and manifests instead of estimated bin volumes whenever possible. [8][9][13][14]
Estimates still have a place, but mostly for low-volume, low-risk streams like restroom water use or office recycling. When estimates are used, document the assumptions, method, and uncertainty range the same way each year. For high-impact streams - total withdrawal, hazardous waste, and effluent discharge - direct measurement is strongly preferred. Metered data gives teams a clearer view of leaks, losses, and noncompliant discharge before those issues grow into something harder to fix. ISO 14001 supports this through calibrated or verified instruments and internal audits. [23]
Set Targets and Turn Metrics into Decisions
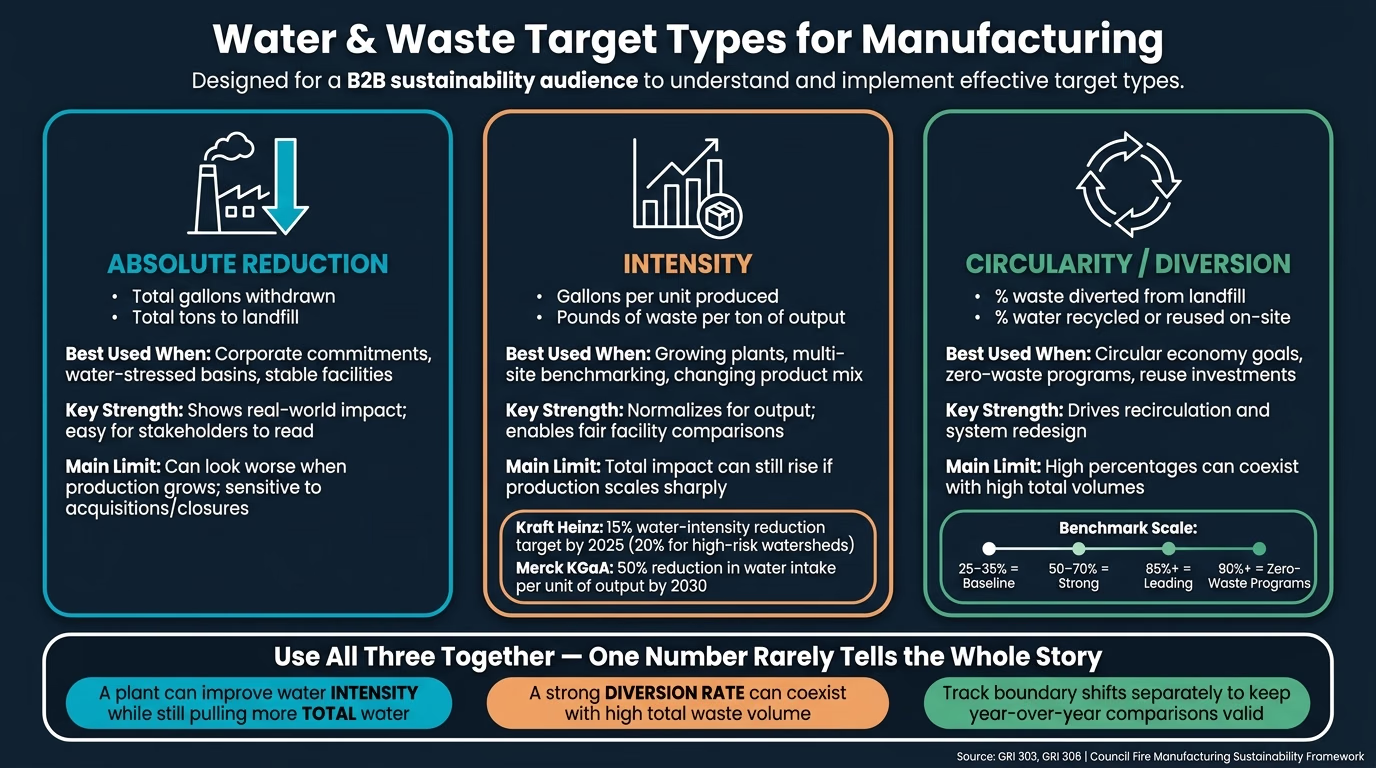
Water & Waste Metrics: 3 Target Types Every Manufacturer Needs
Once boundaries and data rules are in place, targets turn reporting into day-to-day management. A scorecard tells you what happened. Targets push teams to decide what to do next.
Choose Baselines and Target Types That Fit Manufacturing Reality
Start with a baseline year that reflects normal operations, not a year skewed by outages or shutdowns. If production swings a lot, a multi-year baseline usually gives a steadier view than a single year. After you set it, lock it in and record any exclusions and the reason behind them.
Use three target types:
Target Type | Best Used When | Key Strength | Main Limit |
|---|---|---|---|
Absolute reduction (e.g., total gallons withdrawn, total tons to landfill) | Corporate commitments, water-stressed basins, stable facilities | Shows real-world impact and is easy for stakeholders to read | Can look worse when production grows; sensitive to acquisitions and closures |
Intensity (e.g., gallons per unit produced, pounds of waste per ton of output) | Growing plants, multi-site benchmarking, changing product mix | Normalizes for output and helps compare facilities fairly | Total impact can still rise if production scales sharply |
Circularity / diversion (e.g., % waste diverted from landfill, % water recycled or reused on-site) | Circular economy goals, zero-waste programs, reuse investments | Drives recirculation and system redesign | High percentages can coexist with high total volumes |
In practice, these targets work best together. One number rarely tells the whole story. A plant can improve water intensity while still pulling more total water, or post a strong diversion rate while generating too much waste overall.
Examples make that plain. Kraft Heinz set a 15% water-intensity reduction by 2025 for all facilities and a 20% reduction for facilities in high-risk watersheds [26], while Merck KGaA reset its goal to a 50% reduction in water intake per unit of output by 2030 after exceeding an earlier target [25].
For waste diversion, use 25–35% as baseline, 50–70% as strong, and 85%+ as leading. [27] Many zero-waste programs aim for 90% or higher diversion. [28]
When boundary shifts or operating changes move the totals, track those effects on their own. Say total water withdrawal rises 15% after production moves from a closed plant, while water intensity improves 10%. That’s not a contradiction; it’s a sign that the business changed shape. If a major boundary change permanently resets the system, recalibrate the baseline so long-term comparisons still make sense.
Translate Corporate Goals into Plant-Level Action
A company-wide goal like "reduce total water withdrawal 30% by 2030" should not be copied and pasted onto every plant. Sites do not start from the same place, and they do not face the same limits. The smarter move is to assign goals based on each plant’s impact, stress level, and room for improvement.
That means looking at local water stress, waste infrastructure, permit conditions, and what each site can realistically change. For water, plants in high-stress basins should carry tighter goals. Johnson Controls committed to a 10% water reduction at water-stressed locations by 2025 versus a 2017 baseline and reported a 12% reduction in FY2022, ahead of schedule. [29][30]
Waste goals need the same kind of local lens. A facility with mature recycling and recovery infrastructure can take on higher diversion targets. A site with limited local capacity may need staged goals first, focused on waste minimization and segregation before moving further. A facility-specific target matrix helps tie local conditions back to the company goal without forcing every plant into the same mold.
Targets also need a clear action path at the plant level. If the metric does not connect to actual work on the floor, it turns into wall art. The link should be direct:
Process optimization
Technology upgrades
Reuse systems
Waste segregation and recycling
That connection is what ties the metric to capital planning and operating decisions.
Next, present the selected metrics in a clear report structure with tables and trend charts.
How to Present Water and Waste Metrics in Sustainability Reports
Structure the Water and Waste Sections for Clarity
Once metrics, boundaries, units, and targets are set, the last job is presentation. The format should let leaders scan the section fast and still give plant teams the detail they need.
A clear structure works best: start with a short company-wide summary of the water and waste KPIs that matter most, follow with plant-level tables, then add brief narrative that explains major year-over-year shifts, operating drivers, and management actions. Use GRI 303 and GRI 306 as the disclosure spine for both sections.
That split matters. Executives need the roll-up. Plant teams need site detail. Put water source and discharge data in one facility table, waste stream and disposal data in a second table, and close each section with a short target-versus-performance update. That way, readers can see results and next steps in the same place.
Use Tables and Trend Charts That Decision-Makers Can Read Quickly
Most disclosures fit into three tables. When the section layout is in place, tables make it much easier to compare sites and reporting years without making readers dig.
A facility-by-facility water table with columns for site name, water source, total withdrawal, reuse or recycled volume, discharge volume, and water-stress context where relevant
A waste table by stream and management route with columns for waste stream, hazardous or non-hazardous classification, total generated, recycled, reused, sent to energy recovery, landfilled, and other disposal
A target tracking table with baseline year, baseline value, current-year value, target value, percentage progress, and target type: absolute, intensity, or diversion rate
Stick with the same units used in the rest of the report. For plant tables, use gallons for water and pounds for waste. For ESG tables, use cubic meters for water and metric tons for waste. That consistency saves readers from doing mental math and cuts down on reporting mistakes.
Examples should stay limited. The point is to show movement over time, not just drop in a single-year snapshot. After the tables, use charts to show direction. Line charts work well for multi-year trends. Stacked bar charts are useful for disposal mix or water-source mix.
Narrative matters just as much as the numbers. Each table should have one short note that says what changed, why it changed, and what management plans to do next. If you need to explain meter coverage, mass-balance methods, or estimation logic, move that detail to an appendix so the main report stays easy to read.
Conclusion: Key Rules for Sound Manufacturing Metrics
Good water and waste reporting rests on a few non-negotiables. Choose metrics that are material and tied to action. Define plant boundaries before you count anything. Use the same units and data rules across every site and reporting period. Set targets tied to actual operating levers. Present results with enough context that a reader can see what changed and why.
A number without context is noise.
Organizations that need help linking plant-level data to system-level outcomes may want outside support. Council Fire helps manufacturers put water and waste reporting into practice, turning facility data into management decisions and measurable sustainability results.
FAQs
What is the difference between water withdrawal, use, and consumption?
Water withdrawal is the total volume of water a site takes from rivers, lakes, groundwater, or municipal systems to run its operations. Think of it as the water coming into the facility.
Water use is the water put to work inside the facility. That includes water applied in processes, moved through equipment, or recirculated during operations.
Water consumption is the share of withdrawn water that does not go back to the original source. That can happen through evaporation, water built into a product, or discharge to sewage systems.
Which 10–15 metrics should a manufacturing plant track first?
Start with 12 core metrics that cover environmental performance and day-to-day efficiency:
Water: total withdrawal, total consumption, and % recycled/reused
Waste: total generated by type, diversion rate, and disposal methods
Energy/emissions: total energy by source, Scope 1 and 2 GHG emissions, and energy intensity (kWh per square meter)
Operations/safety: water expenses, waste disposal costs, and health and safety incident rates
This gives you a practical baseline. It’s enough to show what’s happening across the site without drowning the team in data. From there, you can spot cost drivers, track shifts over time, and see where action is paying off.
How do I set fair water and waste targets across different plants?
Start with context, not a blanket cut across every site. A baseline assessment helps you see where the biggest hotspots are, so teams can focus effort where it matters most. For water, that means looking beyond total use and factoring in local conditions such as water stress. A plant in a high-stress area should not be judged the same way as one in a region with plenty of supply.
Use intensity metrics - such as water or waste per unit of production - to compare plants on a fair basis. That gives you a cleaner view of performance, especially when sites differ in size, output, or product mix. From there, set site-specific, time-bound goals that connect to corporate strategy, local conditions, and management accountability.
Related Blog Posts
Latest Articles
©2026

Narrative Change and Power Building: The Missing Half of Advocacy
Narrative change is the process of disrupting dominant narratives that normalize inequity and advancing new narratives from historically marginalized communities.

Funding Resilience Without Federal Grants
BRIC is unreliable and FEMA is shrinking. Here's how cities fund climate resilience with dedicated revenue, blended finance, and a coordinating authority.

The ESG Blind Spot: How AI Is Finding Risks in Companies Nobody Else Is Watching
Norway's sovereign wealth fund uses AI to screen 7,200 portfolio companies for forced labor and corruption within 24 hours. The real story is the emerging-market coverage gap that traditional ESG data vendors miss — and what it means for any company with a global supply chain.
Narrative Change and Power Building: The Missing Half of Advocacy
Narrative change is the process of disrupting dominant narratives that normalize inequity and advancing new narratives from historically marginalized communities.
Funding Resilience Without Federal Grants
BRIC is unreliable and FEMA is shrinking. Here's how cities fund climate resilience with dedicated revenue, blended finance, and a coordinating authority.
The ESG Blind Spot: How AI Is Finding Risks in Companies Nobody Else Is Watching
Norway's sovereign wealth fund uses AI to screen 7,200 portfolio companies for forced labor and corruption within 24 hours. The real story is the emerging-market coverage gap that traditional ESG data vendors miss — and what it means for any company with a global supply chain.
FAQ
01
What does it really mean to “redefine profit”?
02
What makes Council Fire different?
03
Who does Council Fire work with?
04
What does working with Council Fire actually look like?
05
How does Council Fire help organizations turn big goals into action?
06
How does Council Fire define and measure success?
07
How does technology fit into Council Fire’s work?
Sep 17, 2026
Water and Waste Metrics in Manufacturing
Sustainability Strategy
In This Article
Defines 10–15 core water and waste KPIs, plus boundaries, units, metering, and targets for plant-level control.
Water and Waste Metrics in Manufacturing
If you do not track water and waste with clear rules, you cannot control cost, permits, or plant risk. In U.S. manufacturing, direct water withdrawal is about 18.2 billion gallons per day, so even small errors in metering, scope, or units can distort plant decisions and year-over-year results.
I’d boil this article down to a few points:
Track the core water numbers: withdrawal, use, consumption, discharge, effluent quality, and reuse
Track the core waste numbers: total generated, hazardous vs. non-hazardous, diversion, and disposal route
Set rules first: plant boundary, source categories, units, metering, estimation rules, and rounding method
Use both total and intensity targets: for example, gallons per unit produced and total tons to landfill
Show the data clearly: short KPI summaries, plant tables, trend charts, and brief notes on what changed and why
I’d also keep the scorecard tight. In most plants, 10–15 indicators are enough to guide action without burying teams in extra data. The article’s main message is simple: pick a short set of numbers, define them the same way every year, and link each one to cost, compliance, and plant decisions.
Wastewater KPIs: Setting Metrics for Compliance and Cost Reduction
How to Choose the Right Water and Waste Metrics for Each Plant
Once the reporting framework is in place, the next step is to trim the scorecard down to the few metrics that push action at each plant. Not every number you track needs a spot on the main dashboard. The goal is a short, steady set of metrics that shows impact, points to operating trouble spots, helps with day-to-day choices, and holds up in year-over-year comparisons.
Core Water Metrics: Withdrawal, Use, Consumption, Discharge, and Reuse
Start with total water withdrawal by source. That usually means municipal supply, groundwater, surface water, and, when it applies, rainwater or reclaimed water. Then break that withdrawal into use types such as cooling towers, boilers, cleaning and sanitation, and product formulation. That second layer is where the data starts to help plant teams make decisions instead of just filling a report.
Water consumption is the share of withdrawn water that does not return through discharge. That includes evaporation, water built into product, and other losses. This metric matters even more in water-stressed areas, where every gallon counts.
Discharge should be tracked by destination, whether that is municipal sewer, surface water, or off-site treatment. Pair that with the main effluent quality measures so the plant can see both volume and condition.
For reuse and recycling, track two things:
The total volume of water recycled inside the plant
The reuse rate as a percentage of total water demand
A plant with closed-loop cooling or reused rinse water can cut withdrawal in a direct, measurable way.
Intensity metrics help connect water data to output. Use gallons per unit produced on plant dashboards because production managers can read and use that fast. Then convert the same performance into cubic meters per metric ton of output for GRI and CDP reporting. When you benchmark intensity, stay within the same industry. Comparing across sectors can skew the picture and lead to bad reads.
Core Waste and Effluent Metrics: Generation, Diversion, Disposal, and Quality
The same basic rule applies to waste: track the streams that affect cost, compliance, and process change the most.
Total waste generated is the starting point, split into hazardous and non-hazardous fractions under RCRA classification. [4] Still, the total by itself does not tell you where the problem sits. That is why waste by stream matters so much. Break it out into production scrap, packaging waste, sludge from wastewater treatment, and process residues such as spent chemicals or catalysts. Once you can see waste at the stream level, it becomes much easier to spot where process changes or packaging redesign can make the biggest dent. [4][5]
For treatment and disposal routes, track recycling, composting, energy recovery, incineration, and landfill in both absolute short tons and percentages. The waste diversion rate, calculated as (recycled + composted + energy recovered) ÷ total waste × 100, works well as a summary metric for circular economy progress. [7]
On the effluent side, most scorecards should include BOD, COD, TSS, pH, and nutrients such as total nitrogen and total phosphorus. [1][4] Use permit limits as the benchmark for BOD, COD, TSS, pH, nutrients, metals, and temperature where they apply. Track effluent quality on the permit sampling schedule and compare results against permit thresholds so small changes show up early, before they turn into bigger issues.
How to Decide Which Metrics Belong in the Final Scorecard
A simple way to screen each metric is to use three filters: regulatory relevance, operating cost, and plant control. If a metric is tied to a permit or legal duty, it belongs on the scorecard. If it links straight to cost, production uptime, or water supply risk, it belongs there too. And if plant-level decisions can move the number within one to three years, it is worth tracking. [2][3]
Most manufacturers end up with a core scorecard of 10–15 indicators. That usually includes total withdrawal, withdrawal intensity, consumption, main effluent parameters, total waste generated, the hazardous versus non-hazardous split, diversion rate, and a small set of process-specific KPIs such as scrap rate. [4][5][6] Extra metrics can still be tracked inside the plant, but the main scorecard should stay tight and focused on the numbers managers actually use.
After choosing the scorecard, define boundaries and units before data collection starts.
Set Boundaries, Units, and Data Rules Before Reporting
Once the scorecard is in place, the next step is simple but easy to skip: lock the scope, units, and data rules before collection begins. If that groundwork is fuzzy, plant totals won’t line up across sites. They also won’t roll up cleanly at the corporate level or stand up well in an audit. And when that happens, even well-chosen metrics stop being useful.
Define Plant Boundaries and Reporting Scope
Start with reporting boundaries. Decide whether reporting will use an operational control approach - meaning 100% of impacts from sites the company controls - or an equity share approach, where impacts are reported based on ownership share. Then apply that same rule across wholly owned plants, leased sites you operate, joint ventures, and contract manufacturers you control. [10][11][12][16]
At the plant level, be just as clear about the site boundary itself. Does it cover only production areas, or does it also include warehouses, maintenance shops, and offices? From there, map the full-site water balance across inflows such as municipal water, groundwater, and surface water, along with internal use, reuse loops, treatment systems, and discharge points. The goal is to make inflows and outflows reconcile within a defined tolerance. [13][14][17][22]
Waste needs the same discipline. State whether the scope covers only production waste or also includes maintenance waste, construction and renovation debris, and results from off-site treatment facilities. If construction or project-related waste is left out, a year-over-year drop can look better on paper than it is in practice. [15][18]
A clean boundary is what lets one plant’s totals sit next to another’s without guesswork.
Pick Units That Work for U.S. Operations and External Reports
For day-to-day plant use, stick with gallons for water and pounds or short tons for waste. Those are the units most teams already see on utility bills, meter readings, and hauler scale tickets, which cuts down on conversion mistakes. For outside sustainability reports, convert water to cubic meters (m³) and waste to metric tons. [19][20][21]
Keep the standard conversion factors inside the reporting system so every plant uses the same values:
1 U.S. gallon = 0.003785 m³
1 million gallons = 3,785 m³
2,204.6 pounds = 1 metric ton
Just as important, sum plant-level data before rounding, not after. It sounds minor, but small rounding gaps can pile up across a big site network. [20][24]
Common units keep plant data from going sideways when it moves into company-level reporting.
Improve Data Quality with Metering, Mass Balance, and Verification
Meter the big flow points: incoming supply, cooling tower makeup, boiler feedwater, and discharge outlets. Then reconcile those readings against utility bills on a regular basis so drift, leaks, or bad readings show up early. For waste, lean on scale tickets and manifests instead of estimated bin volumes whenever possible. [8][9][13][14]
Estimates still have a place, but mostly for low-volume, low-risk streams like restroom water use or office recycling. When estimates are used, document the assumptions, method, and uncertainty range the same way each year. For high-impact streams - total withdrawal, hazardous waste, and effluent discharge - direct measurement is strongly preferred. Metered data gives teams a clearer view of leaks, losses, and noncompliant discharge before those issues grow into something harder to fix. ISO 14001 supports this through calibrated or verified instruments and internal audits. [23]
Set Targets and Turn Metrics into Decisions
Water & Waste Metrics: 3 Target Types Every Manufacturer Needs
Once boundaries and data rules are in place, targets turn reporting into day-to-day management. A scorecard tells you what happened. Targets push teams to decide what to do next.
Choose Baselines and Target Types That Fit Manufacturing Reality
Start with a baseline year that reflects normal operations, not a year skewed by outages or shutdowns. If production swings a lot, a multi-year baseline usually gives a steadier view than a single year. After you set it, lock it in and record any exclusions and the reason behind them.
Use three target types:
Target Type | Best Used When | Key Strength | Main Limit |
|---|---|---|---|
Absolute reduction (e.g., total gallons withdrawn, total tons to landfill) | Corporate commitments, water-stressed basins, stable facilities | Shows real-world impact and is easy for stakeholders to read | Can look worse when production grows; sensitive to acquisitions and closures |
Intensity (e.g., gallons per unit produced, pounds of waste per ton of output) | Growing plants, multi-site benchmarking, changing product mix | Normalizes for output and helps compare facilities fairly | Total impact can still rise if production scales sharply |
Circularity / diversion (e.g., % waste diverted from landfill, % water recycled or reused on-site) | Circular economy goals, zero-waste programs, reuse investments | Drives recirculation and system redesign | High percentages can coexist with high total volumes |
In practice, these targets work best together. One number rarely tells the whole story. A plant can improve water intensity while still pulling more total water, or post a strong diversion rate while generating too much waste overall.
Examples make that plain. Kraft Heinz set a 15% water-intensity reduction by 2025 for all facilities and a 20% reduction for facilities in high-risk watersheds [26], while Merck KGaA reset its goal to a 50% reduction in water intake per unit of output by 2030 after exceeding an earlier target [25].
For waste diversion, use 25–35% as baseline, 50–70% as strong, and 85%+ as leading. [27] Many zero-waste programs aim for 90% or higher diversion. [28]
When boundary shifts or operating changes move the totals, track those effects on their own. Say total water withdrawal rises 15% after production moves from a closed plant, while water intensity improves 10%. That’s not a contradiction; it’s a sign that the business changed shape. If a major boundary change permanently resets the system, recalibrate the baseline so long-term comparisons still make sense.
Translate Corporate Goals into Plant-Level Action
A company-wide goal like "reduce total water withdrawal 30% by 2030" should not be copied and pasted onto every plant. Sites do not start from the same place, and they do not face the same limits. The smarter move is to assign goals based on each plant’s impact, stress level, and room for improvement.
That means looking at local water stress, waste infrastructure, permit conditions, and what each site can realistically change. For water, plants in high-stress basins should carry tighter goals. Johnson Controls committed to a 10% water reduction at water-stressed locations by 2025 versus a 2017 baseline and reported a 12% reduction in FY2022, ahead of schedule. [29][30]
Waste goals need the same kind of local lens. A facility with mature recycling and recovery infrastructure can take on higher diversion targets. A site with limited local capacity may need staged goals first, focused on waste minimization and segregation before moving further. A facility-specific target matrix helps tie local conditions back to the company goal without forcing every plant into the same mold.
Targets also need a clear action path at the plant level. If the metric does not connect to actual work on the floor, it turns into wall art. The link should be direct:
Process optimization
Technology upgrades
Reuse systems
Waste segregation and recycling
That connection is what ties the metric to capital planning and operating decisions.
Next, present the selected metrics in a clear report structure with tables and trend charts.
How to Present Water and Waste Metrics in Sustainability Reports
Structure the Water and Waste Sections for Clarity
Once metrics, boundaries, units, and targets are set, the last job is presentation. The format should let leaders scan the section fast and still give plant teams the detail they need.
A clear structure works best: start with a short company-wide summary of the water and waste KPIs that matter most, follow with plant-level tables, then add brief narrative that explains major year-over-year shifts, operating drivers, and management actions. Use GRI 303 and GRI 306 as the disclosure spine for both sections.
That split matters. Executives need the roll-up. Plant teams need site detail. Put water source and discharge data in one facility table, waste stream and disposal data in a second table, and close each section with a short target-versus-performance update. That way, readers can see results and next steps in the same place.
Use Tables and Trend Charts That Decision-Makers Can Read Quickly
Most disclosures fit into three tables. When the section layout is in place, tables make it much easier to compare sites and reporting years without making readers dig.
A facility-by-facility water table with columns for site name, water source, total withdrawal, reuse or recycled volume, discharge volume, and water-stress context where relevant
A waste table by stream and management route with columns for waste stream, hazardous or non-hazardous classification, total generated, recycled, reused, sent to energy recovery, landfilled, and other disposal
A target tracking table with baseline year, baseline value, current-year value, target value, percentage progress, and target type: absolute, intensity, or diversion rate
Stick with the same units used in the rest of the report. For plant tables, use gallons for water and pounds for waste. For ESG tables, use cubic meters for water and metric tons for waste. That consistency saves readers from doing mental math and cuts down on reporting mistakes.
Examples should stay limited. The point is to show movement over time, not just drop in a single-year snapshot. After the tables, use charts to show direction. Line charts work well for multi-year trends. Stacked bar charts are useful for disposal mix or water-source mix.
Narrative matters just as much as the numbers. Each table should have one short note that says what changed, why it changed, and what management plans to do next. If you need to explain meter coverage, mass-balance methods, or estimation logic, move that detail to an appendix so the main report stays easy to read.
Conclusion: Key Rules for Sound Manufacturing Metrics
Good water and waste reporting rests on a few non-negotiables. Choose metrics that are material and tied to action. Define plant boundaries before you count anything. Use the same units and data rules across every site and reporting period. Set targets tied to actual operating levers. Present results with enough context that a reader can see what changed and why.
A number without context is noise.
Organizations that need help linking plant-level data to system-level outcomes may want outside support. Council Fire helps manufacturers put water and waste reporting into practice, turning facility data into management decisions and measurable sustainability results.
FAQs
What is the difference between water withdrawal, use, and consumption?
Water withdrawal is the total volume of water a site takes from rivers, lakes, groundwater, or municipal systems to run its operations. Think of it as the water coming into the facility.
Water use is the water put to work inside the facility. That includes water applied in processes, moved through equipment, or recirculated during operations.
Water consumption is the share of withdrawn water that does not go back to the original source. That can happen through evaporation, water built into a product, or discharge to sewage systems.
Which 10–15 metrics should a manufacturing plant track first?
Start with 12 core metrics that cover environmental performance and day-to-day efficiency:
Water: total withdrawal, total consumption, and % recycled/reused
Waste: total generated by type, diversion rate, and disposal methods
Energy/emissions: total energy by source, Scope 1 and 2 GHG emissions, and energy intensity (kWh per square meter)
Operations/safety: water expenses, waste disposal costs, and health and safety incident rates
This gives you a practical baseline. It’s enough to show what’s happening across the site without drowning the team in data. From there, you can spot cost drivers, track shifts over time, and see where action is paying off.
How do I set fair water and waste targets across different plants?
Start with context, not a blanket cut across every site. A baseline assessment helps you see where the biggest hotspots are, so teams can focus effort where it matters most. For water, that means looking beyond total use and factoring in local conditions such as water stress. A plant in a high-stress area should not be judged the same way as one in a region with plenty of supply.
Use intensity metrics - such as water or waste per unit of production - to compare plants on a fair basis. That gives you a cleaner view of performance, especially when sites differ in size, output, or product mix. From there, set site-specific, time-bound goals that connect to corporate strategy, local conditions, and management accountability.
Related Blog Posts
Latest Articles
©2026
Narrative Change and Power Building: The Missing Half of Advocacy
Narrative change is the process of disrupting dominant narratives that normalize inequity and advancing new narratives from historically marginalized communities.
Funding Resilience Without Federal Grants
BRIC is unreliable and FEMA is shrinking. Here's how cities fund climate resilience with dedicated revenue, blended finance, and a coordinating authority.
The ESG Blind Spot: How AI Is Finding Risks in Companies Nobody Else Is Watching
Norway's sovereign wealth fund uses AI to screen 7,200 portfolio companies for forced labor and corruption within 24 hours. The real story is the emerging-market coverage gap that traditional ESG data vendors miss — and what it means for any company with a global supply chain.
FAQ
What does it really mean to “redefine profit”?
What makes Council Fire different?
Who does Council Fire work with?
What does working with Council Fire actually look like?
How does Council Fire help organizations turn big goals into action?
How does Council Fire define and measure success?
How does technology fit into Council Fire’s work?