
Aug 28, 2026
Triple Bottom Line Metrics vs ESG Metrics
ESG Strategy
In This Article
Compare TBL and ESG metrics: TBL guides internal trade-offs across people, planet, profit; ESG focuses on investor-facing risk and disclosure.
Triple Bottom Line Metrics vs ESG Metrics
If you need one plain answer, here it is: Triple Bottom Line (TBL) metrics help me run the business across people, planet, and economic results. ESG metrics help me report risk and performance to investors, lenders, regulators, and boards.
For me, the split comes down to use:
TBL = internal choices, trade-offs, mission, and long-range planning
ESG = external reporting, benchmark data, and finance-focused oversight
TBL asks: Are people, planet, and economic results improving together?
ESG asks: Which non-financial issues could affect enterprise value?
A few facts from the article make the difference clear:
SASB standards average 6 topics and 13 metrics per industry
74% of those metrics are quantitative
Both approaches may use the same core data: emissions, water, labor, safety, turnover, and governance data
What I take from this is simple: TBL sets direction; ESG supports disclosure and oversight. One is built for managing trade-offs inside the organization. The other is built for showing outside parties how risk, controls, and issue exposure are being tracked.
Quick Comparison
Criteria | TBL Metrics | ESG Metrics |
|---|---|---|
Main focus | People, planet, and economic results together | Risk, opportunity, and governance tied to enterprise value |
Main use | Internal planning and decision-making | External reporting and board/investor review |
Main audience | Leaders, staff, communities, funders, agencies | Investors, lenders, regulators, boards |
Metric style | Chosen by mission and context | More standardized across frameworks |
Best for | Trade-offs, capital planning, resilience, mission execution | Disclosure, peer comparison, due diligence, oversight |
If I were choosing between them, I would not treat them as substitutes. I would use TBL to decide where to go and ESG to show how the organization is performing on the issues the market cares about most.
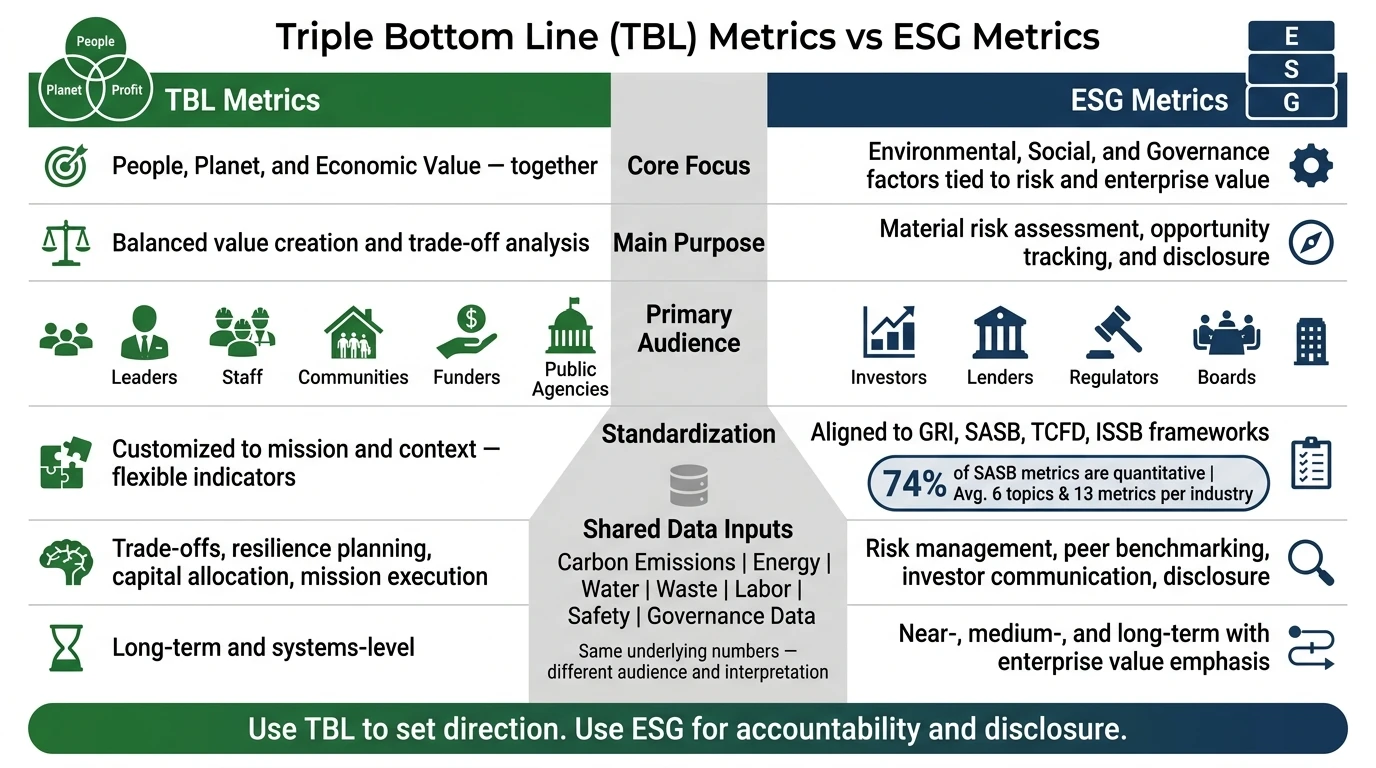
TBL Metrics vs ESG Metrics: Key Differences at a Glance
Prof. Rajdeep Sharma on Impact and Externalities of the TBL Sustainability Framework | TaSIC 2026
Triple Bottom Line Metrics: Purpose, Audience, and Management Use
TBL metrics help leaders make better internal decisions and shape stakeholder strategy. ESG is built for external disclosure. TBL is built for day-to-day decision-making inside the organization. At its center is a plain question: Are social, environmental, and economic results getting better together?
Primary Purpose: Measure Whole-System Value
TBL exists to make trade-offs plain. A cost-cutting move can look strong on a finance dashboard while quietly wearing down worker well-being or community stability. On the flip side, a new product line might cut emissions and support stronger margins over time. TBL puts those effects in one view, so leaders aren’t judging one outcome in isolation.
Organizations set their own indicators based on mission and context. That can include living-wage coverage, community benefit spend, greenhouse gas emissions, energy intensity, water use, local supplier spend, operating margin, and cash flow. There isn’t one fixed metric set, and no single pillar should dominate the decision. The point is to compare trade-offs before money is committed.
That same logic matters in scenario analysis. When teams test climate scenarios or shifts in demographics, TBL metrics show whether mission-critical outcomes can still be met across all three dimensions, not just on the financial side. This broader view is also why the metrics matter in budgeting and capital allocation.
Primary Audience: Internal Leaders and Broad Stakeholders
ESG reports are aimed at capital markets. TBL metrics are for the people running the organization and the communities affected by its choices. TBL dashboards support executives, boards, employees, communities, funders, and public agencies that need outcome-based evidence in plain terms.
Management Value: Strategy, Trade-Offs, and Resilience
In capital planning, TBL metrics show how a single investment can affect emissions, costs, jobs, resilience, and operating risk at the same time. That matters when an organization is upgrading stormwater systems, hardening energy infrastructure, or relocating critical facilities. With TBL metrics, it can track reduced downtime during extreme weather, lower long-term maintenance and repair costs, better insurability, and clear gains for vulnerable communities - all looked at together instead of in separate silos.
Organizations that build these metrics into capital planning, including through partners such as Council Fire, often create custom TBL dashboards that pull together operational data, community indicators, and climate and resilience metrics.[1]
That management focus sets up the ESG distinction: standardized metrics for external accountability.
ESG Metrics: Purpose, Audience, and Reporting Use
If TBL looks at how the full system is doing, ESG looks at a tighter question: which sustainability issues matter most to enterprise value? The lens shifts from broad trade-offs across people, planet, and profit to the ESG topics most likely to affect financial risk, upside, and disclosure.
Primary Purpose: Assess Material Risk and Opportunity
ESG metrics help companies track environmental, social, and governance issues that can shape financial value, cost of capital, business continuity, and reputation. Common examples include greenhouse gas emissions, labor practices, board independence, and ethics controls.
The guiding idea is financial materiality. In plain terms, that means focusing on how ESG issues affect the company. Some frameworks also use double materiality, which adds a second view: how the organization affects the world around it, not just how outside forces affect the business. Investor-facing frameworks such as SASB, ISSB, and TCFD focus mainly on financial materiality.[5][6][7]
Primary Audience: Investors, Lenders, Regulators, and Boards
ESG metrics are built first for investors, lenders, regulators, and boards.
Investors use them to judge risk exposure and inform portfolio decisions.
Lenders use them in credit analysis and due diligence.
Regulators use them to support disclosure rules.
Boards use them for oversight and to link sustainability performance with executive compensation.
That audience shapes the way ESG metrics are reported, benchmarked, and reviewed.
Management Value: Disclosure, Benchmarking, and Accountability
Inside the company, ESG metrics support disclosures, investor materials, lender due diligence, and board dashboards. Since ESG frameworks use standard measures, they also make peer comparison more straightforward. For example, SASB standards average 6 topics and 13 metrics per industry, and 74% of those metrics are quantitative.[7]
That narrower reporting role is what sets ESG apart from TBL in day-to-day use.
Triple Bottom Line Metrics vs ESG Metrics: Key Differences and Overlap
TBL and ESG often pull from the same data, but they guide different choices. The simplest way to separate them is to look at who needs the information and what they plan to do with it.
Dimension | Triple Bottom Line Metrics | ESG Metrics |
|---|---|---|
Core focus | People, planet, and economic value together | Environmental, social, and governance factors tied to risk and performance |
Main purpose | Balanced value creation | Material risk, opportunity, and disclosure |
Primary audience | Leadership and broad stakeholders | Investors, lenders, regulators, and boards |
Time horizon | Long-term and systems-level | Near-, medium-, and long-term with emphasis on enterprise value |
Standardization | Often customized to mission and context | Aligned to frameworks such as GRI, SASB, TCFD, and ISSB |
Reporting use | Internal strategy and stakeholder communication | External reporting and investor communication |
Decision use | Trade-off analysis, resilience planning, and mission execution | Risk management, disclosure, and capital market communication |
Where They Differ: Economic Value vs Governance, Flexibility vs Standardization
TBL weighs economic value alongside social and environmental outcomes. ESG, by contrast, puts governance at the center and looks at sustainability issues through the lens of financial materiality - what can affect enterprise value.
That difference matters in day-to-day use. TBL treats economic value as one of three pillars, so leaders can weigh profit, people, and planet side by side. ESG makes governance a direct part of the model. That includes board structure, executive compensation, audit quality, and shareholder rights. It also screens environmental and social issues based on their effect on the business.
The sharpest split is standardization. TBL metrics are often shaped by mission and context, which means two companies may both use TBL and still track very different indicators. ESG metrics line up with reporting frameworks like GRI, SASB, TCFD, and ISSB, which makes comparison across companies much easier for outside readers.
Where They Overlap: Shared Environmental and Social Indicators
There’s a lot of shared ground. Carbon, energy, water, waste, labor, and safety data can support both an internal TBL dashboard and ESG disclosure. In other words, one pool of numbers can do double duty.
The audience and interpretation differ; the underlying numbers often do not.[8][10][4]
A leadership team may use the data to weigh trade-offs or test resilience. An investor may read the same data to judge risk, performance, or reporting quality.
Which Framework Fits Which Decision
The better fit depends on the decision in front of you. If the goal is internal strategy, mission execution, or weighing trade-offs, use TBL. If the goal is disclosure, accountability, or communication with capital markets, use ESG.[9][3][2]
Conclusion: Use TBL for Direction and ESG for Accountability
The takeaway is straightforward: TBL defines the kind of value an organization wants to create. ESG tracks the material issues it needs to report and stand behind. Used together, TBL sets the direction, and ESG adds accountability.
The link between them is practical. Start by defining TBL goals. Then map those goals to material ESG topics and line up internal metrics with reporting needs. With clear governance, strong data quality checks, and steady feedback loops, reporting stays tied to business strategy instead of turning into a separate compliance task.
For U.S. organizations, this connection matters more now because pressure around ESG disclosure is growing, while TBL helps support a long-term strategy built around stakeholders.
Council Fire helps organizations turn sustainability goals into integrated metrics, reporting, and implementation plans.
FAQs
Can TBL and ESG use the same data?
Yes. TBL and ESG can draw from the same core data set. TBL looks at People, Planet, and Profit. ESG uses much of that same information, but adds governance and puts more weight on what matters to investors from a financial-risk point of view.
In day-to-day use, that means an organization can collect the data once - emissions, energy, water, workforce, and governance data - and use it in both frameworks. When ESG reporting calls for more detail, the team can layer on materiality assessments or financial-risk analysis without rebuilding the whole data process from scratch.
When should I use TBL instead of ESG?
Use TBL when you need a broader, strategic way to balance social, environmental, and economic performance in core operations and long-term decisions, especially when the goal goes beyond investor demands.
Use ESG when you need standardized metrics for regulatory requirements, investor expectations, or peer benchmarking. In most cases, it’s the more practical choice for formal disclosure.
How do I choose the right ESG framework?
Choose the framework that matches your main audience, your industry risks, and the rules you need to follow.
If your top priority is investor-facing or financial disclosure, SASB is often the better choice. If you need broader stakeholder transparency or you operate in the EU, GRI is usually the stronger fit. Many mature organizations use both: SASB for investors and GRI for broader stakeholder communication.
Related Blog Posts
Latest Articles
©2026

Narrative Change and Power Building: The Missing Half of Advocacy
Narrative change is the process of disrupting dominant narratives that normalize inequity and advancing new narratives from historically marginalized communities.

Funding Resilience Without Federal Grants
BRIC is unreliable and FEMA is shrinking. Here's how cities fund climate resilience with dedicated revenue, blended finance, and a coordinating authority.

The ESG Blind Spot: How AI Is Finding Risks in Companies Nobody Else Is Watching
Norway's sovereign wealth fund uses AI to screen 7,200 portfolio companies for forced labor and corruption within 24 hours. The real story is the emerging-market coverage gap that traditional ESG data vendors miss — and what it means for any company with a global supply chain.
Narrative Change and Power Building: The Missing Half of Advocacy
Narrative change is the process of disrupting dominant narratives that normalize inequity and advancing new narratives from historically marginalized communities.
Funding Resilience Without Federal Grants
BRIC is unreliable and FEMA is shrinking. Here's how cities fund climate resilience with dedicated revenue, blended finance, and a coordinating authority.
The ESG Blind Spot: How AI Is Finding Risks in Companies Nobody Else Is Watching
Norway's sovereign wealth fund uses AI to screen 7,200 portfolio companies for forced labor and corruption within 24 hours. The real story is the emerging-market coverage gap that traditional ESG data vendors miss — and what it means for any company with a global supply chain.
FAQ
01
What does it really mean to “redefine profit”?
02
What makes Council Fire different?
03
Who does Council Fire work with?
04
What does working with Council Fire actually look like?
05
How does Council Fire help organizations turn big goals into action?
06
How does Council Fire define and measure success?
07
How does technology fit into Council Fire’s work?
Aug 28, 2026
Triple Bottom Line Metrics vs ESG Metrics
ESG Strategy
In This Article
Compare TBL and ESG metrics: TBL guides internal trade-offs across people, planet, profit; ESG focuses on investor-facing risk and disclosure.
Triple Bottom Line Metrics vs ESG Metrics
If you need one plain answer, here it is: Triple Bottom Line (TBL) metrics help me run the business across people, planet, and economic results. ESG metrics help me report risk and performance to investors, lenders, regulators, and boards.
For me, the split comes down to use:
TBL = internal choices, trade-offs, mission, and long-range planning
ESG = external reporting, benchmark data, and finance-focused oversight
TBL asks: Are people, planet, and economic results improving together?
ESG asks: Which non-financial issues could affect enterprise value?
A few facts from the article make the difference clear:
SASB standards average 6 topics and 13 metrics per industry
74% of those metrics are quantitative
Both approaches may use the same core data: emissions, water, labor, safety, turnover, and governance data
What I take from this is simple: TBL sets direction; ESG supports disclosure and oversight. One is built for managing trade-offs inside the organization. The other is built for showing outside parties how risk, controls, and issue exposure are being tracked.
Quick Comparison
Criteria | TBL Metrics | ESG Metrics |
|---|---|---|
Main focus | People, planet, and economic results together | Risk, opportunity, and governance tied to enterprise value |
Main use | Internal planning and decision-making | External reporting and board/investor review |
Main audience | Leaders, staff, communities, funders, agencies | Investors, lenders, regulators, boards |
Metric style | Chosen by mission and context | More standardized across frameworks |
Best for | Trade-offs, capital planning, resilience, mission execution | Disclosure, peer comparison, due diligence, oversight |
If I were choosing between them, I would not treat them as substitutes. I would use TBL to decide where to go and ESG to show how the organization is performing on the issues the market cares about most.
TBL Metrics vs ESG Metrics: Key Differences at a Glance
Prof. Rajdeep Sharma on Impact and Externalities of the TBL Sustainability Framework | TaSIC 2026
Triple Bottom Line Metrics: Purpose, Audience, and Management Use
TBL metrics help leaders make better internal decisions and shape stakeholder strategy. ESG is built for external disclosure. TBL is built for day-to-day decision-making inside the organization. At its center is a plain question: Are social, environmental, and economic results getting better together?
Primary Purpose: Measure Whole-System Value
TBL exists to make trade-offs plain. A cost-cutting move can look strong on a finance dashboard while quietly wearing down worker well-being or community stability. On the flip side, a new product line might cut emissions and support stronger margins over time. TBL puts those effects in one view, so leaders aren’t judging one outcome in isolation.
Organizations set their own indicators based on mission and context. That can include living-wage coverage, community benefit spend, greenhouse gas emissions, energy intensity, water use, local supplier spend, operating margin, and cash flow. There isn’t one fixed metric set, and no single pillar should dominate the decision. The point is to compare trade-offs before money is committed.
That same logic matters in scenario analysis. When teams test climate scenarios or shifts in demographics, TBL metrics show whether mission-critical outcomes can still be met across all three dimensions, not just on the financial side. This broader view is also why the metrics matter in budgeting and capital allocation.
Primary Audience: Internal Leaders and Broad Stakeholders
ESG reports are aimed at capital markets. TBL metrics are for the people running the organization and the communities affected by its choices. TBL dashboards support executives, boards, employees, communities, funders, and public agencies that need outcome-based evidence in plain terms.
Management Value: Strategy, Trade-Offs, and Resilience
In capital planning, TBL metrics show how a single investment can affect emissions, costs, jobs, resilience, and operating risk at the same time. That matters when an organization is upgrading stormwater systems, hardening energy infrastructure, or relocating critical facilities. With TBL metrics, it can track reduced downtime during extreme weather, lower long-term maintenance and repair costs, better insurability, and clear gains for vulnerable communities - all looked at together instead of in separate silos.
Organizations that build these metrics into capital planning, including through partners such as Council Fire, often create custom TBL dashboards that pull together operational data, community indicators, and climate and resilience metrics.[1]
That management focus sets up the ESG distinction: standardized metrics for external accountability.
ESG Metrics: Purpose, Audience, and Reporting Use
If TBL looks at how the full system is doing, ESG looks at a tighter question: which sustainability issues matter most to enterprise value? The lens shifts from broad trade-offs across people, planet, and profit to the ESG topics most likely to affect financial risk, upside, and disclosure.
Primary Purpose: Assess Material Risk and Opportunity
ESG metrics help companies track environmental, social, and governance issues that can shape financial value, cost of capital, business continuity, and reputation. Common examples include greenhouse gas emissions, labor practices, board independence, and ethics controls.
The guiding idea is financial materiality. In plain terms, that means focusing on how ESG issues affect the company. Some frameworks also use double materiality, which adds a second view: how the organization affects the world around it, not just how outside forces affect the business. Investor-facing frameworks such as SASB, ISSB, and TCFD focus mainly on financial materiality.[5][6][7]
Primary Audience: Investors, Lenders, Regulators, and Boards
ESG metrics are built first for investors, lenders, regulators, and boards.
Investors use them to judge risk exposure and inform portfolio decisions.
Lenders use them in credit analysis and due diligence.
Regulators use them to support disclosure rules.
Boards use them for oversight and to link sustainability performance with executive compensation.
That audience shapes the way ESG metrics are reported, benchmarked, and reviewed.
Management Value: Disclosure, Benchmarking, and Accountability
Inside the company, ESG metrics support disclosures, investor materials, lender due diligence, and board dashboards. Since ESG frameworks use standard measures, they also make peer comparison more straightforward. For example, SASB standards average 6 topics and 13 metrics per industry, and 74% of those metrics are quantitative.[7]
That narrower reporting role is what sets ESG apart from TBL in day-to-day use.
Triple Bottom Line Metrics vs ESG Metrics: Key Differences and Overlap
TBL and ESG often pull from the same data, but they guide different choices. The simplest way to separate them is to look at who needs the information and what they plan to do with it.
Dimension | Triple Bottom Line Metrics | ESG Metrics |
|---|---|---|
Core focus | People, planet, and economic value together | Environmental, social, and governance factors tied to risk and performance |
Main purpose | Balanced value creation | Material risk, opportunity, and disclosure |
Primary audience | Leadership and broad stakeholders | Investors, lenders, regulators, and boards |
Time horizon | Long-term and systems-level | Near-, medium-, and long-term with emphasis on enterprise value |
Standardization | Often customized to mission and context | Aligned to frameworks such as GRI, SASB, TCFD, and ISSB |
Reporting use | Internal strategy and stakeholder communication | External reporting and investor communication |
Decision use | Trade-off analysis, resilience planning, and mission execution | Risk management, disclosure, and capital market communication |
Where They Differ: Economic Value vs Governance, Flexibility vs Standardization
TBL weighs economic value alongside social and environmental outcomes. ESG, by contrast, puts governance at the center and looks at sustainability issues through the lens of financial materiality - what can affect enterprise value.
That difference matters in day-to-day use. TBL treats economic value as one of three pillars, so leaders can weigh profit, people, and planet side by side. ESG makes governance a direct part of the model. That includes board structure, executive compensation, audit quality, and shareholder rights. It also screens environmental and social issues based on their effect on the business.
The sharpest split is standardization. TBL metrics are often shaped by mission and context, which means two companies may both use TBL and still track very different indicators. ESG metrics line up with reporting frameworks like GRI, SASB, TCFD, and ISSB, which makes comparison across companies much easier for outside readers.
Where They Overlap: Shared Environmental and Social Indicators
There’s a lot of shared ground. Carbon, energy, water, waste, labor, and safety data can support both an internal TBL dashboard and ESG disclosure. In other words, one pool of numbers can do double duty.
The audience and interpretation differ; the underlying numbers often do not.[8][10][4]
A leadership team may use the data to weigh trade-offs or test resilience. An investor may read the same data to judge risk, performance, or reporting quality.
Which Framework Fits Which Decision
The better fit depends on the decision in front of you. If the goal is internal strategy, mission execution, or weighing trade-offs, use TBL. If the goal is disclosure, accountability, or communication with capital markets, use ESG.[9][3][2]
Conclusion: Use TBL for Direction and ESG for Accountability
The takeaway is straightforward: TBL defines the kind of value an organization wants to create. ESG tracks the material issues it needs to report and stand behind. Used together, TBL sets the direction, and ESG adds accountability.
The link between them is practical. Start by defining TBL goals. Then map those goals to material ESG topics and line up internal metrics with reporting needs. With clear governance, strong data quality checks, and steady feedback loops, reporting stays tied to business strategy instead of turning into a separate compliance task.
For U.S. organizations, this connection matters more now because pressure around ESG disclosure is growing, while TBL helps support a long-term strategy built around stakeholders.
Council Fire helps organizations turn sustainability goals into integrated metrics, reporting, and implementation plans.
FAQs
Can TBL and ESG use the same data?
Yes. TBL and ESG can draw from the same core data set. TBL looks at People, Planet, and Profit. ESG uses much of that same information, but adds governance and puts more weight on what matters to investors from a financial-risk point of view.
In day-to-day use, that means an organization can collect the data once - emissions, energy, water, workforce, and governance data - and use it in both frameworks. When ESG reporting calls for more detail, the team can layer on materiality assessments or financial-risk analysis without rebuilding the whole data process from scratch.
When should I use TBL instead of ESG?
Use TBL when you need a broader, strategic way to balance social, environmental, and economic performance in core operations and long-term decisions, especially when the goal goes beyond investor demands.
Use ESG when you need standardized metrics for regulatory requirements, investor expectations, or peer benchmarking. In most cases, it’s the more practical choice for formal disclosure.
How do I choose the right ESG framework?
Choose the framework that matches your main audience, your industry risks, and the rules you need to follow.
If your top priority is investor-facing or financial disclosure, SASB is often the better choice. If you need broader stakeholder transparency or you operate in the EU, GRI is usually the stronger fit. Many mature organizations use both: SASB for investors and GRI for broader stakeholder communication.
Related Blog Posts
Latest Articles
©2026
Narrative Change and Power Building: The Missing Half of Advocacy
Narrative change is the process of disrupting dominant narratives that normalize inequity and advancing new narratives from historically marginalized communities.
Funding Resilience Without Federal Grants
BRIC is unreliable and FEMA is shrinking. Here's how cities fund climate resilience with dedicated revenue, blended finance, and a coordinating authority.
The ESG Blind Spot: How AI Is Finding Risks in Companies Nobody Else Is Watching
Norway's sovereign wealth fund uses AI to screen 7,200 portfolio companies for forced labor and corruption within 24 hours. The real story is the emerging-market coverage gap that traditional ESG data vendors miss — and what it means for any company with a global supply chain.
FAQ
01
What does it really mean to “redefine profit”?
02
What makes Council Fire different?
03
Who does Council Fire work with?
04
What does working with Council Fire actually look like?
05
How does Council Fire help organizations turn big goals into action?
06
How does Council Fire define and measure success?
07
How does technology fit into Council Fire’s work?
Aug 28, 2026
Triple Bottom Line Metrics vs ESG Metrics
ESG Strategy
In This Article
Compare TBL and ESG metrics: TBL guides internal trade-offs across people, planet, profit; ESG focuses on investor-facing risk and disclosure.
Triple Bottom Line Metrics vs ESG Metrics
If you need one plain answer, here it is: Triple Bottom Line (TBL) metrics help me run the business across people, planet, and economic results. ESG metrics help me report risk and performance to investors, lenders, regulators, and boards.
For me, the split comes down to use:
TBL = internal choices, trade-offs, mission, and long-range planning
ESG = external reporting, benchmark data, and finance-focused oversight
TBL asks: Are people, planet, and economic results improving together?
ESG asks: Which non-financial issues could affect enterprise value?
A few facts from the article make the difference clear:
SASB standards average 6 topics and 13 metrics per industry
74% of those metrics are quantitative
Both approaches may use the same core data: emissions, water, labor, safety, turnover, and governance data
What I take from this is simple: TBL sets direction; ESG supports disclosure and oversight. One is built for managing trade-offs inside the organization. The other is built for showing outside parties how risk, controls, and issue exposure are being tracked.
Quick Comparison
Criteria | TBL Metrics | ESG Metrics |
|---|---|---|
Main focus | People, planet, and economic results together | Risk, opportunity, and governance tied to enterprise value |
Main use | Internal planning and decision-making | External reporting and board/investor review |
Main audience | Leaders, staff, communities, funders, agencies | Investors, lenders, regulators, boards |
Metric style | Chosen by mission and context | More standardized across frameworks |
Best for | Trade-offs, capital planning, resilience, mission execution | Disclosure, peer comparison, due diligence, oversight |
If I were choosing between them, I would not treat them as substitutes. I would use TBL to decide where to go and ESG to show how the organization is performing on the issues the market cares about most.
TBL Metrics vs ESG Metrics: Key Differences at a Glance
Prof. Rajdeep Sharma on Impact and Externalities of the TBL Sustainability Framework | TaSIC 2026
Triple Bottom Line Metrics: Purpose, Audience, and Management Use
TBL metrics help leaders make better internal decisions and shape stakeholder strategy. ESG is built for external disclosure. TBL is built for day-to-day decision-making inside the organization. At its center is a plain question: Are social, environmental, and economic results getting better together?
Primary Purpose: Measure Whole-System Value
TBL exists to make trade-offs plain. A cost-cutting move can look strong on a finance dashboard while quietly wearing down worker well-being or community stability. On the flip side, a new product line might cut emissions and support stronger margins over time. TBL puts those effects in one view, so leaders aren’t judging one outcome in isolation.
Organizations set their own indicators based on mission and context. That can include living-wage coverage, community benefit spend, greenhouse gas emissions, energy intensity, water use, local supplier spend, operating margin, and cash flow. There isn’t one fixed metric set, and no single pillar should dominate the decision. The point is to compare trade-offs before money is committed.
That same logic matters in scenario analysis. When teams test climate scenarios or shifts in demographics, TBL metrics show whether mission-critical outcomes can still be met across all three dimensions, not just on the financial side. This broader view is also why the metrics matter in budgeting and capital allocation.
Primary Audience: Internal Leaders and Broad Stakeholders
ESG reports are aimed at capital markets. TBL metrics are for the people running the organization and the communities affected by its choices. TBL dashboards support executives, boards, employees, communities, funders, and public agencies that need outcome-based evidence in plain terms.
Management Value: Strategy, Trade-Offs, and Resilience
In capital planning, TBL metrics show how a single investment can affect emissions, costs, jobs, resilience, and operating risk at the same time. That matters when an organization is upgrading stormwater systems, hardening energy infrastructure, or relocating critical facilities. With TBL metrics, it can track reduced downtime during extreme weather, lower long-term maintenance and repair costs, better insurability, and clear gains for vulnerable communities - all looked at together instead of in separate silos.
Organizations that build these metrics into capital planning, including through partners such as Council Fire, often create custom TBL dashboards that pull together operational data, community indicators, and climate and resilience metrics.[1]
That management focus sets up the ESG distinction: standardized metrics for external accountability.
ESG Metrics: Purpose, Audience, and Reporting Use
If TBL looks at how the full system is doing, ESG looks at a tighter question: which sustainability issues matter most to enterprise value? The lens shifts from broad trade-offs across people, planet, and profit to the ESG topics most likely to affect financial risk, upside, and disclosure.
Primary Purpose: Assess Material Risk and Opportunity
ESG metrics help companies track environmental, social, and governance issues that can shape financial value, cost of capital, business continuity, and reputation. Common examples include greenhouse gas emissions, labor practices, board independence, and ethics controls.
The guiding idea is financial materiality. In plain terms, that means focusing on how ESG issues affect the company. Some frameworks also use double materiality, which adds a second view: how the organization affects the world around it, not just how outside forces affect the business. Investor-facing frameworks such as SASB, ISSB, and TCFD focus mainly on financial materiality.[5][6][7]
Primary Audience: Investors, Lenders, Regulators, and Boards
ESG metrics are built first for investors, lenders, regulators, and boards.
Investors use them to judge risk exposure and inform portfolio decisions.
Lenders use them in credit analysis and due diligence.
Regulators use them to support disclosure rules.
Boards use them for oversight and to link sustainability performance with executive compensation.
That audience shapes the way ESG metrics are reported, benchmarked, and reviewed.
Management Value: Disclosure, Benchmarking, and Accountability
Inside the company, ESG metrics support disclosures, investor materials, lender due diligence, and board dashboards. Since ESG frameworks use standard measures, they also make peer comparison more straightforward. For example, SASB standards average 6 topics and 13 metrics per industry, and 74% of those metrics are quantitative.[7]
That narrower reporting role is what sets ESG apart from TBL in day-to-day use.
Triple Bottom Line Metrics vs ESG Metrics: Key Differences and Overlap
TBL and ESG often pull from the same data, but they guide different choices. The simplest way to separate them is to look at who needs the information and what they plan to do with it.
Dimension | Triple Bottom Line Metrics | ESG Metrics |
|---|---|---|
Core focus | People, planet, and economic value together | Environmental, social, and governance factors tied to risk and performance |
Main purpose | Balanced value creation | Material risk, opportunity, and disclosure |
Primary audience | Leadership and broad stakeholders | Investors, lenders, regulators, and boards |
Time horizon | Long-term and systems-level | Near-, medium-, and long-term with emphasis on enterprise value |
Standardization | Often customized to mission and context | Aligned to frameworks such as GRI, SASB, TCFD, and ISSB |
Reporting use | Internal strategy and stakeholder communication | External reporting and investor communication |
Decision use | Trade-off analysis, resilience planning, and mission execution | Risk management, disclosure, and capital market communication |
Where They Differ: Economic Value vs Governance, Flexibility vs Standardization
TBL weighs economic value alongside social and environmental outcomes. ESG, by contrast, puts governance at the center and looks at sustainability issues through the lens of financial materiality - what can affect enterprise value.
That difference matters in day-to-day use. TBL treats economic value as one of three pillars, so leaders can weigh profit, people, and planet side by side. ESG makes governance a direct part of the model. That includes board structure, executive compensation, audit quality, and shareholder rights. It also screens environmental and social issues based on their effect on the business.
The sharpest split is standardization. TBL metrics are often shaped by mission and context, which means two companies may both use TBL and still track very different indicators. ESG metrics line up with reporting frameworks like GRI, SASB, TCFD, and ISSB, which makes comparison across companies much easier for outside readers.
Where They Overlap: Shared Environmental and Social Indicators
There’s a lot of shared ground. Carbon, energy, water, waste, labor, and safety data can support both an internal TBL dashboard and ESG disclosure. In other words, one pool of numbers can do double duty.
The audience and interpretation differ; the underlying numbers often do not.[8][10][4]
A leadership team may use the data to weigh trade-offs or test resilience. An investor may read the same data to judge risk, performance, or reporting quality.
Which Framework Fits Which Decision
The better fit depends on the decision in front of you. If the goal is internal strategy, mission execution, or weighing trade-offs, use TBL. If the goal is disclosure, accountability, or communication with capital markets, use ESG.[9][3][2]
Conclusion: Use TBL for Direction and ESG for Accountability
The takeaway is straightforward: TBL defines the kind of value an organization wants to create. ESG tracks the material issues it needs to report and stand behind. Used together, TBL sets the direction, and ESG adds accountability.
The link between them is practical. Start by defining TBL goals. Then map those goals to material ESG topics and line up internal metrics with reporting needs. With clear governance, strong data quality checks, and steady feedback loops, reporting stays tied to business strategy instead of turning into a separate compliance task.
For U.S. organizations, this connection matters more now because pressure around ESG disclosure is growing, while TBL helps support a long-term strategy built around stakeholders.
Council Fire helps organizations turn sustainability goals into integrated metrics, reporting, and implementation plans.
FAQs
Can TBL and ESG use the same data?
Yes. TBL and ESG can draw from the same core data set. TBL looks at People, Planet, and Profit. ESG uses much of that same information, but adds governance and puts more weight on what matters to investors from a financial-risk point of view.
In day-to-day use, that means an organization can collect the data once - emissions, energy, water, workforce, and governance data - and use it in both frameworks. When ESG reporting calls for more detail, the team can layer on materiality assessments or financial-risk analysis without rebuilding the whole data process from scratch.
When should I use TBL instead of ESG?
Use TBL when you need a broader, strategic way to balance social, environmental, and economic performance in core operations and long-term decisions, especially when the goal goes beyond investor demands.
Use ESG when you need standardized metrics for regulatory requirements, investor expectations, or peer benchmarking. In most cases, it’s the more practical choice for formal disclosure.
How do I choose the right ESG framework?
Choose the framework that matches your main audience, your industry risks, and the rules you need to follow.
If your top priority is investor-facing or financial disclosure, SASB is often the better choice. If you need broader stakeholder transparency or you operate in the EU, GRI is usually the stronger fit. Many mature organizations use both: SASB for investors and GRI for broader stakeholder communication.
Related Blog Posts
Latest Articles
©2026
Narrative Change and Power Building: The Missing Half of Advocacy
Narrative change is the process of disrupting dominant narratives that normalize inequity and advancing new narratives from historically marginalized communities.
Funding Resilience Without Federal Grants
BRIC is unreliable and FEMA is shrinking. Here's how cities fund climate resilience with dedicated revenue, blended finance, and a coordinating authority.
The ESG Blind Spot: How AI Is Finding Risks in Companies Nobody Else Is Watching
Norway's sovereign wealth fund uses AI to screen 7,200 portfolio companies for forced labor and corruption within 24 hours. The real story is the emerging-market coverage gap that traditional ESG data vendors miss — and what it means for any company with a global supply chain.
FAQ
What does it really mean to “redefine profit”?
What makes Council Fire different?
Who does Council Fire work with?
What does working with Council Fire actually look like?
How does Council Fire help organizations turn big goals into action?
How does Council Fire define and measure success?
How does technology fit into Council Fire’s work?