Sep 6, 2026
Textile Value Chains: LCA and Circularity
Sustainability Strategy
In This Article
Use LCA to test whether fiber choices, reuse, repair, and recycling actually reduce textiles' environmental impacts.
Textile Value Chains: LCA and Circularity
If I want lower impact from textiles, I can’t assume circular programs will do the job on their own. The article’s main point is simple: LCA helps me test whether fiber choices, reuse, repair, recycling, and take-back programs cut total harm or just shift it elsewhere.
Here’s the short version:
Textiles have a large footprint: about 1.2 billion metric tons of CO₂e per year and about 215 trillion liters of water.
The biggest pressure points are often fiber production, wet processing, consumer laundry, and end of life.
Use phase can change results fast, especially in the U.S., where dryer use is high.
Fiber comparisons only make sense when I use the same functional unit and the same study boundary.
Reuse and repair can lower impact a lot, but only if they extend use and replace new purchases.
Recycling is not a guaranteed win, because sorting losses, contamination, transport, and low-quality output can cut the gains.
Data quality and allocation choices matter, and weak assumptions can flip the result.
My takeaway: I should use LCA as a scenario tool, not as a simple ranking system. If a textile option still looks good under best-case, expected, and conservative assumptions, it is more likely to hold up in practice.
A quick way to read the article is this: it explains where impacts sit, what circular moves often work, where they fail, and which assumptions I need to check before making a sourcing or program decision.
Textile Value Chain Hotspots and Circularity Priorities
Where Impacts Usually Concentrate
Most of the damage in a textile product’s life cycle piles up in a few places: fiber production, wet processing, and consumer use.
For a typical apparel item, one apparel LCA assigns about 36% of climate impact to fiber production, 24% to yarn and fabric formation, 12% to dyeing and finishing, 12% to cut-and-sew assembly, and about 10% to the use phase.[3] That said, the use phase can swing a lot more than people expect. Care habits matter. In some everyday garments, washing and drying account for 46–74% of net life-cycle impacts across certain impact categories.[3]
In the U.S., laundry habits often push that share even higher than in other markets. Levi Strauss & Co. found that 82% of U.S. consumers use a dryer, compared with 32% in the U.K. and France and 12% in China. U.S. consumers also averaged nearly three times as many drying cycles per year for jeans as their European counterparts.[6] On fossil-heavy grids, warm-water washes and tumble-drying add much more carbon.[6][7][8]
Wet processing - dyeing, scouring, bleaching, and finishing - creates another major pressure point, no matter which fiber is used. This stage drives chemical toxicity and eutrophication impacts, uses large amounts of water and energy, and produces effluent that remains one of the industry’s hardest pollution problems.
End-of-life also carries weight. EPA data show that in 2018, textiles made up 7.7% of all U.S. municipal solid waste sent to landfill.[5] Once there, natural fibers can generate methane. On the other side, synthetic fibers sent to incineration can release hazardous air pollutants.
Why Circular Systems Fall Short Without Design Changes
Circularity tools - longevity, reuse, repair, recycling, and take-back - sound good on paper. But they don’t work if the product was never made to support them. That’s why product design comes first.
A lot of garments still block circular flows from the start. Blended fabrics are one of the clearest examples. A cotton-polyester blend or stretch jeans with elastane can clog shredders.[2] Mixed-fiber blends also tend to create shorter, weaker fibers during mechanical recycling, which often pushes the output into low-value nonwovens instead of fiber-to-fiber use.
Small contaminants can also do outsized damage.
PVC present at around 100 parts per million in a textile waste stream can release hydrochloric acid during re-extrusion, causing color defects and processing failures in recycled fiber output.[4]
Trims and added parts create the same kind of headache. Zippers, buttons, labels, coatings, and laminates often mean extra manual disassembly or poorer recyclate quality.
Collection systems make things harder. Most U.S. municipal programs do not include textiles in curbside pickup. Brand-led take-back programs often struggle because many people don’t know they exist, or the drop-off process is a hassle. Charity bins collect high volumes of items that are too worn or too contaminated for resale, which shifts sorting and disposal costs onto downstream partners.
That’s the core problem: product design shapes what happens later. It affects failure rates in collection, sorting, and recycling long before a garment reaches its end of use.
These hotspots lead straight into the next issue: how LCA shifts fiber comparisons and circular design decisions.
Enabling the shift to sustainability and circularity in the textile value chain
How LCA Frames Fiber Choice
Most textile impacts pile up in production, use, and end of life. That’s why fiber comparisons only mean something when they’re modeled on the same basis. The question has to be specific: one T-shirt worn 30 times or one pair of jeans worn 50 times. Looking at weight alone can send you in the wrong direction, since durability and wash frequency can change the outcome.
How Functional Unit and Boundary Choices Change Results
Boundary choice matters just as much as the functional unit. A cradle-to-gate study covers raw material extraction through fiber or fabric production. A cradle-to-grave study goes further, adding spinning, fabric formation, garment manufacturing, consumer use, laundering, repair, and end of life.
That difference isn’t small. In one cradle-to-grave LCA of a cotton shirt, washing, drying, and ironing accounted for 64% of energy use, 72% of water use, and 76% of global warming potential over the garment’s lifetime.[14] A gate-to-gate study misses all of that.
Once the boundary is fixed, the next step is more practical: which fiber pathway carries the lowest burden in that exact scenario?
Fiber Pathways: Cotton, Synthetics, and Cellulosics
Each fiber comes with its own pressure points, and none wins in every case. Results move around based on where the fiber is grown or made, what powers the mill, how often the garment is washed, and what happens when its life is over.
Cotton grown with irrigation in water-stressed regions can show far higher water scarcity impacts than rain-fed cotton. For polyester and nylon, the carbon footprint is tied closely to the manufacturing region’s energy grid. Coal-heavy grids push global warming potential much higher than production powered by renewables. Viscose and lyocell can also diverge in a big way. Lyocell made in closed-loop systems with renewable energy can perform better than conventional viscose, mainly because solvent recovery is better and emissions are lower.
Microfiber shedding adds another issue for synthetics. Domestic laundry can release over 700,000 microfibers in a single wash from a 13-pound (6 kg) load.[12] Polyester fleeces and jerseys shed an average of 161 ± 173 mg of microfibers per kilogram of textile per wash, compared with 27 ± 14 mg/kg for woven nylon.[9][10]
The table below shows where impacts often cluster for each fiber pathway, what data analysts need to model them with care, and what end-of-life routes are actually on the table.
Fiber Pathway | Likely Hotspots | Key Data Needs | End-of-Life Implications |
|---|---|---|---|
Cotton | Irrigation, fertilizer use, pesticides, land occupation | Regional water scarcity indices, irrigation method, farm-level chemical inputs, local energy mix for pumping | Biodegrades, but recycling is limited by blends and finishes |
Synthetics (Polyester/Nylon) | Fossil feedstock extraction, energy-intensive extrusion, microfiber shedding in use phase | National grid energy mix, polymerization energy, microfiber shedding rates by fabric construction | Non-biodegradable; recycling depends on effective collection, sorting, and polymer purity; landfill or incineration dominates in many regions |
Cellulosics (Viscose/Lyocell/Modal) | Pulp sourcing (deforestation risk), chemical processing, solvent recovery efficiency, mill energy use | Forest certification status (FSC/PEFC), solvent recovery rates, wastewater treatment data, energy mix | Biodegradable; needs high purity for textile-to-textile recycling; chemical residues from processing can complicate end of life |
Regional primary data matter because the same fiber can rank very differently depending on location, energy mix, and use pattern. The same modeling discipline applies to reuse, repair, recycling, and take-back systems, where allocation choices can flip the result.
LCA of Reuse, Repair, Recycling, and Take-Back Systems
Textile Circular Strategies: LCA Impact Comparison
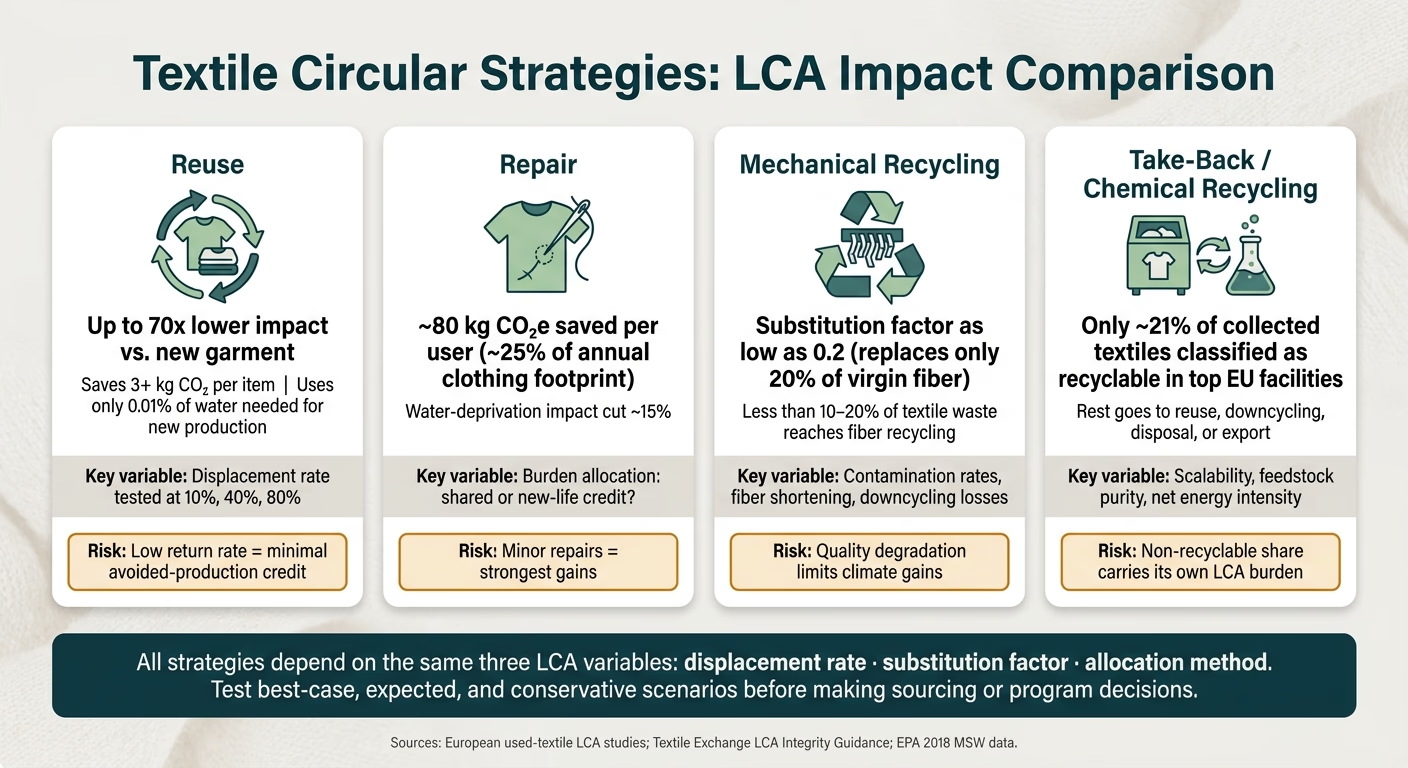
After fiber choice and use-phase hotspots, the next issue is straightforward: which circular loop cuts impact the most? In practice, the answer depends less on the label - reuse, repair, recycling, or take-back - and more on how the LCA is modeled. Allocation rules and displacement assumptions can make the difference between a system that cuts impact and one that mostly moves burdens from one stage to another.
Reuse and Repair: Lifespan Extension and Allocation Choices
When a garment is resold, donated, or rented instead of thrown away, the main LCA gain usually comes from avoided production of a new item. One LCA of European used textiles found that reuse can cut a T-shirt's overall impact by about 70x, saving more than 3 kg CO₂ per higher-quality garment and using only 0.01% of the water needed to make a new one.[16][17]
Repair works on the same basic logic, but with smaller material and energy inputs. An LCA of circular e-businesses found that reuse reduced climate impact by about 80 kg CO₂e per user - roughly 25% of an average Swedish citizen's annual clothing-related footprint. Repair saved about 37 kg CO₂e (11%) and cut water-deprivation impact by around 15%.[18]
The hard part in both cases is burden allocation. Put simply, how much of the original production impact should be assigned to each use? That choice needs to fit the purpose of the study. It should also be stated plainly, since the result can shift quite a bit, especially for high-impact fibers or garments that stay in use for a long time.
Pathway | System Boundary | Burden Allocation Issue | Expected Impact Direction |
|---|---|---|---|
Reuse | Collection, sorting, redistribution, possible cleaning and resale | How to split original production burden across multiple users | Usually lower than new if it displaces virgin production |
Repair | Repair materials, labor, transport, possible cleaning | Whether the repaired item gets shared burden or a new-life credit | Usually lower than replacement with new, especially for minor repairs |
The displacement rate is the key assumption here. European used-textile LCAs have tested replacement rates of 10%, 40%, and 80% to estimate how often a reused item actually prevents a new purchase.[13][16] If that rate is low, the avoided-production credit gets much smaller. At that point, collection and transport can outweigh the gain from not making a new product.
When extending lifespan stops being workable, the next step is to test whether collection and reprocessing still deliver net savings.
Recycling and Take-Back: Where Impacts and Uncertainties Arise
Recycling starts only after a garment's direct use value is spent. That means the LCA boundary has to include consumer return, collection, transport to sorting hubs, pre-processing, the recycling process itself, and the final market for the output. Collection and reverse logistics can matter a lot, especially when volumes are scattered or items move long distances. Sorting and pre-processing often become major pressure points because textile waste arrives in mixed grades, blended fibers, and uneven levels of contamination.
Mechanical recycling shreds fibers, which shortens them and lowers quality. In many cases, the output is downcycled into insulation, rags, or fiber fill instead of being turned back into apparel yarn. Chemical recycling can produce a cleaner feedstock, but its result depends on yield, contamination losses, and scale.
The substitution rate - how much virgin material the recycled output actually replaces - is often the assumption that matters most. One study used a substitution factor of only 0.2, meaning recycled fiber replaced just 20% of the equivalent virgin fiber because of quality limits.[15] At that level, much of the expected climate or resource gain fades out. Reviews of textile recycling also suggest that less than 10–20% of textile waste in many cases ends up in fiber or fabric recycling, though even that share can still earn meaningful credits when it clearly displaces primary fiber production.[19]
Circular Strategy | Main Hotspots | Likely Benefits | Uncertainty Sources |
|---|---|---|---|
Mechanical Recycling | Sorting energy, shredding, fiber degradation | Reduced virgin material demand, low chemical use | Contamination rates, downcycling losses, low substitution factors |
Chemical Recycling | Energy intensity, solvent use, purification steps | Higher-purity output, potential to separate blends | Scalability, net climate impact, feedstock purity requirements |
Take-Back Systems | Reverse logistics, consumer participation, sorting overhead | Controlled material recovery, feedstock security | Return rates, share actually recycled vs. landfilled or exported, transport efficiency |
Take-back programs add another layer of uncertainty that recycling models sometimes gloss over: not everything collected gets recycled. In high-value European sorting facilities, about 21% of collected textiles were classified as recyclable. The rest went to reuse, downcycling, or disposal. So the LCA has to track what happens to the non-recyclable share - landfill, incineration, or export - because those paths bring their own burdens and can chip away at the headline gain of the program.
These results hinge on data quality, substitution assumptions, and allocation rules.
Data Quality, Allocation, and Using LCA Results Responsibly
Data and allocation choices can flip reuse and recycling results. In many cases, the biggest risk is not the circular move itself. It’s the data sitting underneath the claim.
Common Data and Modeling Limits
A lot of textile LCAs start to wobble when generic database averages stand in for verified mill data. That swap can skew results, especially for wet processing and polymers. Dyeing and finishing often drive a large share of impact, and one mill’s performance can look nothing like a database average.
Traceability is another weak spot that keeps showing up. Blended fibers, multi-tier supply chains, and messy documentation make it hard to tie impacts to a specific fiber or production setup. End-of-life data is thinner still. Reuse rates, sorting yields, actual recycling routes, and the share of collected textiles that end up in landfill or incineration usually are not tracked with enough precision to support strong modeling. A systematic review of textile waste LCAs found that 75% of reviewed studies did not specify whether the assessment was attributional or consequential, and 26% had inventories with missing data or weak references.[20] When those pieces are missing, studies stop being easy to compare.
Consumer behavior adds even more uncertainty. A garment might be listed for resale and never bought. It might be worn twice or fifty times. A take-back return might replace a new purchase, or it might not. Those outcomes are usually modeled from assumptions rather than measured behavior. The EU IMPRO Textiles study found that assuming one reused item replaces one new item was optimistic, which shows just how sensitive reuse results are to behavior assumptions.[1]
That matters because these limits do more than blur the picture. They can change the direction of the result.
What Decision-Makers Should Take Away
Allocation method can decide the outcome. Cut-off, substitution, and burden-sharing each assign impacts in different ways, so the method has to fit the purpose of the study.[11][22] Leaders should ask a simple question up front: Which allocation method was used, and why? They should also ask whether the study was stress-tested against other assumptions.
The most useful way to treat textile LCA is as scenario-based decision support, not a scorecard. Start with hotspot analysis to see where impacts cluster. Then compare options using the same functional unit and the same boundary logic. After that, test best-case, expected, and conservative scenarios for:
garment life
return rate
sorting yield
recycling yield
grid mix
If an intervention still looks strong across all three scenarios, that’s usually a sign it deserves attention. Textile Exchange makes the same point in its guidance on LCA integrity: avoid using LCA as a simplified ranking tool, and be clear about assumptions, data sources, and allocation choices.[21]
Conclusion: What LCA Can and Cannot Tell You About Textile Circularity
Once the data and allocation rules are on the table, the better question is not which option wins on paper. It’s which one still holds up under realistic assumptions.
LCA can be very useful for textile circularity when it is handled with care. It can show where impacts are concentrated, flag which circular strategies cut impacts versus just shifting them elsewhere, and surface the assumptions that drive the result. What it cannot do is hand over a universal ranking. Fiber comparisons move when the functional unit or system boundary changes. Reuse and repair depend on actual life extension and displacement rates. Recycling depends on yield, contamination, and what the output replaces in the market. Data quality and allocation choices can swing results enough to change the business call.
Used well, LCA narrows the field and makes trade-offs easier to see. Used poorly, it can produce sharp-looking numbers built on shaky assumptions. The difference usually comes down to execution: sourcing decisions, supplier data collection, reverse logistics, and the capabilities of the partners doing the work. Council Fire helps organizations turn LCA findings into implementation pathways that are environmentally sound and grounded in day-to-day operations.
FAQs
What is the right functional unit for textile LCA?
In textile life cycle assessment, the functional unit needs to reflect equivalent service, not just products that look alike on the shelf. It serves as the reference point for calculating environmental impacts within the study boundaries.
For textiles, that unit may be based on the garments or fabric needed to deliver a defined service over a set period. That makes it easier to compare fiber options, reuse, and repair on fair terms.
When does reuse actually lower textile impacts?
Reuse can cut textile impacts in a big way when it keeps a product in use longer without heavy, energy-hungry reprocessing. In many cases, it uses 80% to 95% less energy than making a new item from virgin materials.
That said, you still need LCA to check the full picture. It helps show whether those gains are being eaten up by shipping, cleaning, or repairs, and whether the burden is simply moving to another part of the value chain.
Why can recycling fail to deliver net benefits?
Recycling does not always lead to a net gain for the environment. In some cases, it simply moves the damage from one place to another, leading to worse results in other areas, such as higher water use or more toxic emissions.
Without a Life Cycle Assessment, it’s also easy to back the wrong circular strategy. Recycling may sound like the safe bet, but options like reuse, repair, or remanufacturing can deliver better results. Put simply, recycling is not always the most sustainable path.
Related Blog Posts
Latest Articles
©2026

Narrative Change and Power Building: The Missing Half of Advocacy
Narrative change is the process of disrupting dominant narratives that normalize inequity and advancing new narratives from historically marginalized communities.

Funding Resilience Without Federal Grants
BRIC is unreliable and FEMA is shrinking. Here's how cities fund climate resilience with dedicated revenue, blended finance, and a coordinating authority.

The ESG Blind Spot: How AI Is Finding Risks in Companies Nobody Else Is Watching
Norway's sovereign wealth fund uses AI to screen 7,200 portfolio companies for forced labor and corruption within 24 hours. The real story is the emerging-market coverage gap that traditional ESG data vendors miss — and what it means for any company with a global supply chain.
Narrative Change and Power Building: The Missing Half of Advocacy
Narrative change is the process of disrupting dominant narratives that normalize inequity and advancing new narratives from historically marginalized communities.
Funding Resilience Without Federal Grants
BRIC is unreliable and FEMA is shrinking. Here's how cities fund climate resilience with dedicated revenue, blended finance, and a coordinating authority.
The ESG Blind Spot: How AI Is Finding Risks in Companies Nobody Else Is Watching
Norway's sovereign wealth fund uses AI to screen 7,200 portfolio companies for forced labor and corruption within 24 hours. The real story is the emerging-market coverage gap that traditional ESG data vendors miss — and what it means for any company with a global supply chain.
FAQ
01
What does it really mean to “redefine profit”?
02
What makes Council Fire different?
03
Who does Council Fire work with?
04
What does working with Council Fire actually look like?
05
How does Council Fire help organizations turn big goals into action?
06
How does Council Fire define and measure success?
07
How does technology fit into Council Fire’s work?
Sep 6, 2026
Textile Value Chains: LCA and Circularity
Sustainability Strategy
In This Article
Use LCA to test whether fiber choices, reuse, repair, and recycling actually reduce textiles' environmental impacts.
Textile Value Chains: LCA and Circularity
If I want lower impact from textiles, I can’t assume circular programs will do the job on their own. The article’s main point is simple: LCA helps me test whether fiber choices, reuse, repair, recycling, and take-back programs cut total harm or just shift it elsewhere.
Here’s the short version:
Textiles have a large footprint: about 1.2 billion metric tons of CO₂e per year and about 215 trillion liters of water.
The biggest pressure points are often fiber production, wet processing, consumer laundry, and end of life.
Use phase can change results fast, especially in the U.S., where dryer use is high.
Fiber comparisons only make sense when I use the same functional unit and the same study boundary.
Reuse and repair can lower impact a lot, but only if they extend use and replace new purchases.
Recycling is not a guaranteed win, because sorting losses, contamination, transport, and low-quality output can cut the gains.
Data quality and allocation choices matter, and weak assumptions can flip the result.
My takeaway: I should use LCA as a scenario tool, not as a simple ranking system. If a textile option still looks good under best-case, expected, and conservative assumptions, it is more likely to hold up in practice.
A quick way to read the article is this: it explains where impacts sit, what circular moves often work, where they fail, and which assumptions I need to check before making a sourcing or program decision.
Textile Value Chain Hotspots and Circularity Priorities
Where Impacts Usually Concentrate
Most of the damage in a textile product’s life cycle piles up in a few places: fiber production, wet processing, and consumer use.
For a typical apparel item, one apparel LCA assigns about 36% of climate impact to fiber production, 24% to yarn and fabric formation, 12% to dyeing and finishing, 12% to cut-and-sew assembly, and about 10% to the use phase.[3] That said, the use phase can swing a lot more than people expect. Care habits matter. In some everyday garments, washing and drying account for 46–74% of net life-cycle impacts across certain impact categories.[3]
In the U.S., laundry habits often push that share even higher than in other markets. Levi Strauss & Co. found that 82% of U.S. consumers use a dryer, compared with 32% in the U.K. and France and 12% in China. U.S. consumers also averaged nearly three times as many drying cycles per year for jeans as their European counterparts.[6] On fossil-heavy grids, warm-water washes and tumble-drying add much more carbon.[6][7][8]
Wet processing - dyeing, scouring, bleaching, and finishing - creates another major pressure point, no matter which fiber is used. This stage drives chemical toxicity and eutrophication impacts, uses large amounts of water and energy, and produces effluent that remains one of the industry’s hardest pollution problems.
End-of-life also carries weight. EPA data show that in 2018, textiles made up 7.7% of all U.S. municipal solid waste sent to landfill.[5] Once there, natural fibers can generate methane. On the other side, synthetic fibers sent to incineration can release hazardous air pollutants.
Why Circular Systems Fall Short Without Design Changes
Circularity tools - longevity, reuse, repair, recycling, and take-back - sound good on paper. But they don’t work if the product was never made to support them. That’s why product design comes first.
A lot of garments still block circular flows from the start. Blended fabrics are one of the clearest examples. A cotton-polyester blend or stretch jeans with elastane can clog shredders.[2] Mixed-fiber blends also tend to create shorter, weaker fibers during mechanical recycling, which often pushes the output into low-value nonwovens instead of fiber-to-fiber use.
Small contaminants can also do outsized damage.
PVC present at around 100 parts per million in a textile waste stream can release hydrochloric acid during re-extrusion, causing color defects and processing failures in recycled fiber output.[4]
Trims and added parts create the same kind of headache. Zippers, buttons, labels, coatings, and laminates often mean extra manual disassembly or poorer recyclate quality.
Collection systems make things harder. Most U.S. municipal programs do not include textiles in curbside pickup. Brand-led take-back programs often struggle because many people don’t know they exist, or the drop-off process is a hassle. Charity bins collect high volumes of items that are too worn or too contaminated for resale, which shifts sorting and disposal costs onto downstream partners.
That’s the core problem: product design shapes what happens later. It affects failure rates in collection, sorting, and recycling long before a garment reaches its end of use.
These hotspots lead straight into the next issue: how LCA shifts fiber comparisons and circular design decisions.
Enabling the shift to sustainability and circularity in the textile value chain
How LCA Frames Fiber Choice
Most textile impacts pile up in production, use, and end of life. That’s why fiber comparisons only mean something when they’re modeled on the same basis. The question has to be specific: one T-shirt worn 30 times or one pair of jeans worn 50 times. Looking at weight alone can send you in the wrong direction, since durability and wash frequency can change the outcome.
How Functional Unit and Boundary Choices Change Results
Boundary choice matters just as much as the functional unit. A cradle-to-gate study covers raw material extraction through fiber or fabric production. A cradle-to-grave study goes further, adding spinning, fabric formation, garment manufacturing, consumer use, laundering, repair, and end of life.
That difference isn’t small. In one cradle-to-grave LCA of a cotton shirt, washing, drying, and ironing accounted for 64% of energy use, 72% of water use, and 76% of global warming potential over the garment’s lifetime.[14] A gate-to-gate study misses all of that.
Once the boundary is fixed, the next step is more practical: which fiber pathway carries the lowest burden in that exact scenario?
Fiber Pathways: Cotton, Synthetics, and Cellulosics
Each fiber comes with its own pressure points, and none wins in every case. Results move around based on where the fiber is grown or made, what powers the mill, how often the garment is washed, and what happens when its life is over.
Cotton grown with irrigation in water-stressed regions can show far higher water scarcity impacts than rain-fed cotton. For polyester and nylon, the carbon footprint is tied closely to the manufacturing region’s energy grid. Coal-heavy grids push global warming potential much higher than production powered by renewables. Viscose and lyocell can also diverge in a big way. Lyocell made in closed-loop systems with renewable energy can perform better than conventional viscose, mainly because solvent recovery is better and emissions are lower.
Microfiber shedding adds another issue for synthetics. Domestic laundry can release over 700,000 microfibers in a single wash from a 13-pound (6 kg) load.[12] Polyester fleeces and jerseys shed an average of 161 ± 173 mg of microfibers per kilogram of textile per wash, compared with 27 ± 14 mg/kg for woven nylon.[9][10]
The table below shows where impacts often cluster for each fiber pathway, what data analysts need to model them with care, and what end-of-life routes are actually on the table.
Fiber Pathway | Likely Hotspots | Key Data Needs | End-of-Life Implications |
|---|---|---|---|
Cotton | Irrigation, fertilizer use, pesticides, land occupation | Regional water scarcity indices, irrigation method, farm-level chemical inputs, local energy mix for pumping | Biodegrades, but recycling is limited by blends and finishes |
Synthetics (Polyester/Nylon) | Fossil feedstock extraction, energy-intensive extrusion, microfiber shedding in use phase | National grid energy mix, polymerization energy, microfiber shedding rates by fabric construction | Non-biodegradable; recycling depends on effective collection, sorting, and polymer purity; landfill or incineration dominates in many regions |
Cellulosics (Viscose/Lyocell/Modal) | Pulp sourcing (deforestation risk), chemical processing, solvent recovery efficiency, mill energy use | Forest certification status (FSC/PEFC), solvent recovery rates, wastewater treatment data, energy mix | Biodegradable; needs high purity for textile-to-textile recycling; chemical residues from processing can complicate end of life |
Regional primary data matter because the same fiber can rank very differently depending on location, energy mix, and use pattern. The same modeling discipline applies to reuse, repair, recycling, and take-back systems, where allocation choices can flip the result.
LCA of Reuse, Repair, Recycling, and Take-Back Systems
Textile Circular Strategies: LCA Impact Comparison
After fiber choice and use-phase hotspots, the next issue is straightforward: which circular loop cuts impact the most? In practice, the answer depends less on the label - reuse, repair, recycling, or take-back - and more on how the LCA is modeled. Allocation rules and displacement assumptions can make the difference between a system that cuts impact and one that mostly moves burdens from one stage to another.
Reuse and Repair: Lifespan Extension and Allocation Choices
When a garment is resold, donated, or rented instead of thrown away, the main LCA gain usually comes from avoided production of a new item. One LCA of European used textiles found that reuse can cut a T-shirt's overall impact by about 70x, saving more than 3 kg CO₂ per higher-quality garment and using only 0.01% of the water needed to make a new one.[16][17]
Repair works on the same basic logic, but with smaller material and energy inputs. An LCA of circular e-businesses found that reuse reduced climate impact by about 80 kg CO₂e per user - roughly 25% of an average Swedish citizen's annual clothing-related footprint. Repair saved about 37 kg CO₂e (11%) and cut water-deprivation impact by around 15%.[18]
The hard part in both cases is burden allocation. Put simply, how much of the original production impact should be assigned to each use? That choice needs to fit the purpose of the study. It should also be stated plainly, since the result can shift quite a bit, especially for high-impact fibers or garments that stay in use for a long time.
Pathway | System Boundary | Burden Allocation Issue | Expected Impact Direction |
|---|---|---|---|
Reuse | Collection, sorting, redistribution, possible cleaning and resale | How to split original production burden across multiple users | Usually lower than new if it displaces virgin production |
Repair | Repair materials, labor, transport, possible cleaning | Whether the repaired item gets shared burden or a new-life credit | Usually lower than replacement with new, especially for minor repairs |
The displacement rate is the key assumption here. European used-textile LCAs have tested replacement rates of 10%, 40%, and 80% to estimate how often a reused item actually prevents a new purchase.[13][16] If that rate is low, the avoided-production credit gets much smaller. At that point, collection and transport can outweigh the gain from not making a new product.
When extending lifespan stops being workable, the next step is to test whether collection and reprocessing still deliver net savings.
Recycling and Take-Back: Where Impacts and Uncertainties Arise
Recycling starts only after a garment's direct use value is spent. That means the LCA boundary has to include consumer return, collection, transport to sorting hubs, pre-processing, the recycling process itself, and the final market for the output. Collection and reverse logistics can matter a lot, especially when volumes are scattered or items move long distances. Sorting and pre-processing often become major pressure points because textile waste arrives in mixed grades, blended fibers, and uneven levels of contamination.
Mechanical recycling shreds fibers, which shortens them and lowers quality. In many cases, the output is downcycled into insulation, rags, or fiber fill instead of being turned back into apparel yarn. Chemical recycling can produce a cleaner feedstock, but its result depends on yield, contamination losses, and scale.
The substitution rate - how much virgin material the recycled output actually replaces - is often the assumption that matters most. One study used a substitution factor of only 0.2, meaning recycled fiber replaced just 20% of the equivalent virgin fiber because of quality limits.[15] At that level, much of the expected climate or resource gain fades out. Reviews of textile recycling also suggest that less than 10–20% of textile waste in many cases ends up in fiber or fabric recycling, though even that share can still earn meaningful credits when it clearly displaces primary fiber production.[19]
Circular Strategy | Main Hotspots | Likely Benefits | Uncertainty Sources |
|---|---|---|---|
Mechanical Recycling | Sorting energy, shredding, fiber degradation | Reduced virgin material demand, low chemical use | Contamination rates, downcycling losses, low substitution factors |
Chemical Recycling | Energy intensity, solvent use, purification steps | Higher-purity output, potential to separate blends | Scalability, net climate impact, feedstock purity requirements |
Take-Back Systems | Reverse logistics, consumer participation, sorting overhead | Controlled material recovery, feedstock security | Return rates, share actually recycled vs. landfilled or exported, transport efficiency |
Take-back programs add another layer of uncertainty that recycling models sometimes gloss over: not everything collected gets recycled. In high-value European sorting facilities, about 21% of collected textiles were classified as recyclable. The rest went to reuse, downcycling, or disposal. So the LCA has to track what happens to the non-recyclable share - landfill, incineration, or export - because those paths bring their own burdens and can chip away at the headline gain of the program.
These results hinge on data quality, substitution assumptions, and allocation rules.
Data Quality, Allocation, and Using LCA Results Responsibly
Data and allocation choices can flip reuse and recycling results. In many cases, the biggest risk is not the circular move itself. It’s the data sitting underneath the claim.
Common Data and Modeling Limits
A lot of textile LCAs start to wobble when generic database averages stand in for verified mill data. That swap can skew results, especially for wet processing and polymers. Dyeing and finishing often drive a large share of impact, and one mill’s performance can look nothing like a database average.
Traceability is another weak spot that keeps showing up. Blended fibers, multi-tier supply chains, and messy documentation make it hard to tie impacts to a specific fiber or production setup. End-of-life data is thinner still. Reuse rates, sorting yields, actual recycling routes, and the share of collected textiles that end up in landfill or incineration usually are not tracked with enough precision to support strong modeling. A systematic review of textile waste LCAs found that 75% of reviewed studies did not specify whether the assessment was attributional or consequential, and 26% had inventories with missing data or weak references.[20] When those pieces are missing, studies stop being easy to compare.
Consumer behavior adds even more uncertainty. A garment might be listed for resale and never bought. It might be worn twice or fifty times. A take-back return might replace a new purchase, or it might not. Those outcomes are usually modeled from assumptions rather than measured behavior. The EU IMPRO Textiles study found that assuming one reused item replaces one new item was optimistic, which shows just how sensitive reuse results are to behavior assumptions.[1]
That matters because these limits do more than blur the picture. They can change the direction of the result.
What Decision-Makers Should Take Away
Allocation method can decide the outcome. Cut-off, substitution, and burden-sharing each assign impacts in different ways, so the method has to fit the purpose of the study.[11][22] Leaders should ask a simple question up front: Which allocation method was used, and why? They should also ask whether the study was stress-tested against other assumptions.
The most useful way to treat textile LCA is as scenario-based decision support, not a scorecard. Start with hotspot analysis to see where impacts cluster. Then compare options using the same functional unit and the same boundary logic. After that, test best-case, expected, and conservative scenarios for:
garment life
return rate
sorting yield
recycling yield
grid mix
If an intervention still looks strong across all three scenarios, that’s usually a sign it deserves attention. Textile Exchange makes the same point in its guidance on LCA integrity: avoid using LCA as a simplified ranking tool, and be clear about assumptions, data sources, and allocation choices.[21]
Conclusion: What LCA Can and Cannot Tell You About Textile Circularity
Once the data and allocation rules are on the table, the better question is not which option wins on paper. It’s which one still holds up under realistic assumptions.
LCA can be very useful for textile circularity when it is handled with care. It can show where impacts are concentrated, flag which circular strategies cut impacts versus just shifting them elsewhere, and surface the assumptions that drive the result. What it cannot do is hand over a universal ranking. Fiber comparisons move when the functional unit or system boundary changes. Reuse and repair depend on actual life extension and displacement rates. Recycling depends on yield, contamination, and what the output replaces in the market. Data quality and allocation choices can swing results enough to change the business call.
Used well, LCA narrows the field and makes trade-offs easier to see. Used poorly, it can produce sharp-looking numbers built on shaky assumptions. The difference usually comes down to execution: sourcing decisions, supplier data collection, reverse logistics, and the capabilities of the partners doing the work. Council Fire helps organizations turn LCA findings into implementation pathways that are environmentally sound and grounded in day-to-day operations.
FAQs
What is the right functional unit for textile LCA?
In textile life cycle assessment, the functional unit needs to reflect equivalent service, not just products that look alike on the shelf. It serves as the reference point for calculating environmental impacts within the study boundaries.
For textiles, that unit may be based on the garments or fabric needed to deliver a defined service over a set period. That makes it easier to compare fiber options, reuse, and repair on fair terms.
When does reuse actually lower textile impacts?
Reuse can cut textile impacts in a big way when it keeps a product in use longer without heavy, energy-hungry reprocessing. In many cases, it uses 80% to 95% less energy than making a new item from virgin materials.
That said, you still need LCA to check the full picture. It helps show whether those gains are being eaten up by shipping, cleaning, or repairs, and whether the burden is simply moving to another part of the value chain.
Why can recycling fail to deliver net benefits?
Recycling does not always lead to a net gain for the environment. In some cases, it simply moves the damage from one place to another, leading to worse results in other areas, such as higher water use or more toxic emissions.
Without a Life Cycle Assessment, it’s also easy to back the wrong circular strategy. Recycling may sound like the safe bet, but options like reuse, repair, or remanufacturing can deliver better results. Put simply, recycling is not always the most sustainable path.
Related Blog Posts
Latest Articles
©2026
Narrative Change and Power Building: The Missing Half of Advocacy
Narrative change is the process of disrupting dominant narratives that normalize inequity and advancing new narratives from historically marginalized communities.
Funding Resilience Without Federal Grants
BRIC is unreliable and FEMA is shrinking. Here's how cities fund climate resilience with dedicated revenue, blended finance, and a coordinating authority.
The ESG Blind Spot: How AI Is Finding Risks in Companies Nobody Else Is Watching
Norway's sovereign wealth fund uses AI to screen 7,200 portfolio companies for forced labor and corruption within 24 hours. The real story is the emerging-market coverage gap that traditional ESG data vendors miss — and what it means for any company with a global supply chain.
FAQ
What does it really mean to “redefine profit”?
What makes Council Fire different?
Who does Council Fire work with?
What does working with Council Fire actually look like?
How does Council Fire help organizations turn big goals into action?
How does Council Fire define and measure success?
How does technology fit into Council Fire’s work?