Jul 25, 2026
Lifecycle Assessment in Circular Economy Design
Sustainability Strategy
In This Article
ISO-based LCA tests reuse, repair, remanufacture and recycling to show when circular design cuts total life-cycle impact.
Lifecycle Assessment in Circular Economy Design
If I want circular design claims to hold up, I need lifecycle assessment. It tells me whether reuse, repair, remanufacturing, recycled content, modularity, or take-back programs cut total impact per unit of service - or just shift impacts from one stage to another.
Here’s the short version:
LCA tracks the whole life cycle: raw materials, manufacturing, shipping, use, and end-of-life.
The functional unit is the key rule: I compare options based on the same service delivered, not just the same product.
ISO 14040 and 14044 set the ground rules: scope, data quality, allocation, reporting, and review.
Circular options can flip based on conditions: return rates, reverse-logistics miles, electricity mix, cleaning energy, and product life often decide the outcome.
One metric is not enough: carbon may go down while water use, toxicity, land use, or resource use goes up.
Early screening helps: I can test rough concepts first, then add supplier and process data later.
Good outputs are decision-focused: hotspot maps, scenario rankings, trade-off notes, assumptions, and confidence ranges.
A few numbers make the point. Research on reusable food containers found climate break-even points often land between 4 and 13 uses. One pallet redesign cut global warming impact by 21% after LCA showed weight was the main driver. Those examples show why circular design needs numbers, not labels.
If I boil the article down to one message, it’s this: circular design works only when the whole system works. LCA is how I check that before a claim, pilot, or purchase decision goes out the door.
LCA for Ecodesign: A step-by-step guide
LCA Foundations and ISO Requirements for Circular Design
Life cycle assessment gives circular design a way to test claims with numbers. It shows whether reuse, repair, remanufacturing, or recycling cuts impact per functional unit.[7][9] In plain terms, LCA tracks materials and energy across the full system and compares options based on the service the product provides.[9][11] That functional unit is the anchor. Without it, design comparisons fall apart.
LCA Basics: Phases, Terms, and the Link to Circular Economy
ISO 14040 and ISO 14044 define LCA as a four-phase, iterative process built to support comparable, auditable comparisons across products and business models.[7][9][6]
ISO LCA Phase | What It Does | Why It Matters for Circular Design |
|---|---|---|
Goal & Scope | Defines the functional unit, system boundaries, and study purpose | Determines whether reuse, repair, or recycling loops are included in the comparison |
Life Cycle Inventory (LCI) | Collects and models energy, material, emissions, and waste data across included stages | Shows how circular strategies change material flows, such as recycled content replacing virgin input or added transport from reverse logistics |
Life Cycle Impact Assessment (LCIA) | Converts inventory data into impact indicators such as global warming potential, acidification, eutrophication, smog formation, and resource depletion | Makes trade-offs visible so teams can see whether gains in one category create problems in another |
Interpretation | Analyzes results to identify hotspots, uncertainties, limitations, and improvement options | Produces design recommendations and clarifies confidence for decision-makers |
These phases matter because every circular design move - reuse loops, repairability, modularity, recycling, reverse logistics - changes at least one part of the model. Together, the four phases turn a design idea into a comparison you can defend.[6][2]
That matters in practice. LCA can show when a gain in one stage leads to a loss somewhere else. A reusable container, for example, may cut waste but add transport and cleaning impacts. In the interpretation phase, scenario analysis tests whether that option still comes out ahead under different assumptions about return rates, use frequency, or the regional energy mix.[8][10][2]
ISO 14040 and ISO 14044: Rules That Make Results Credible
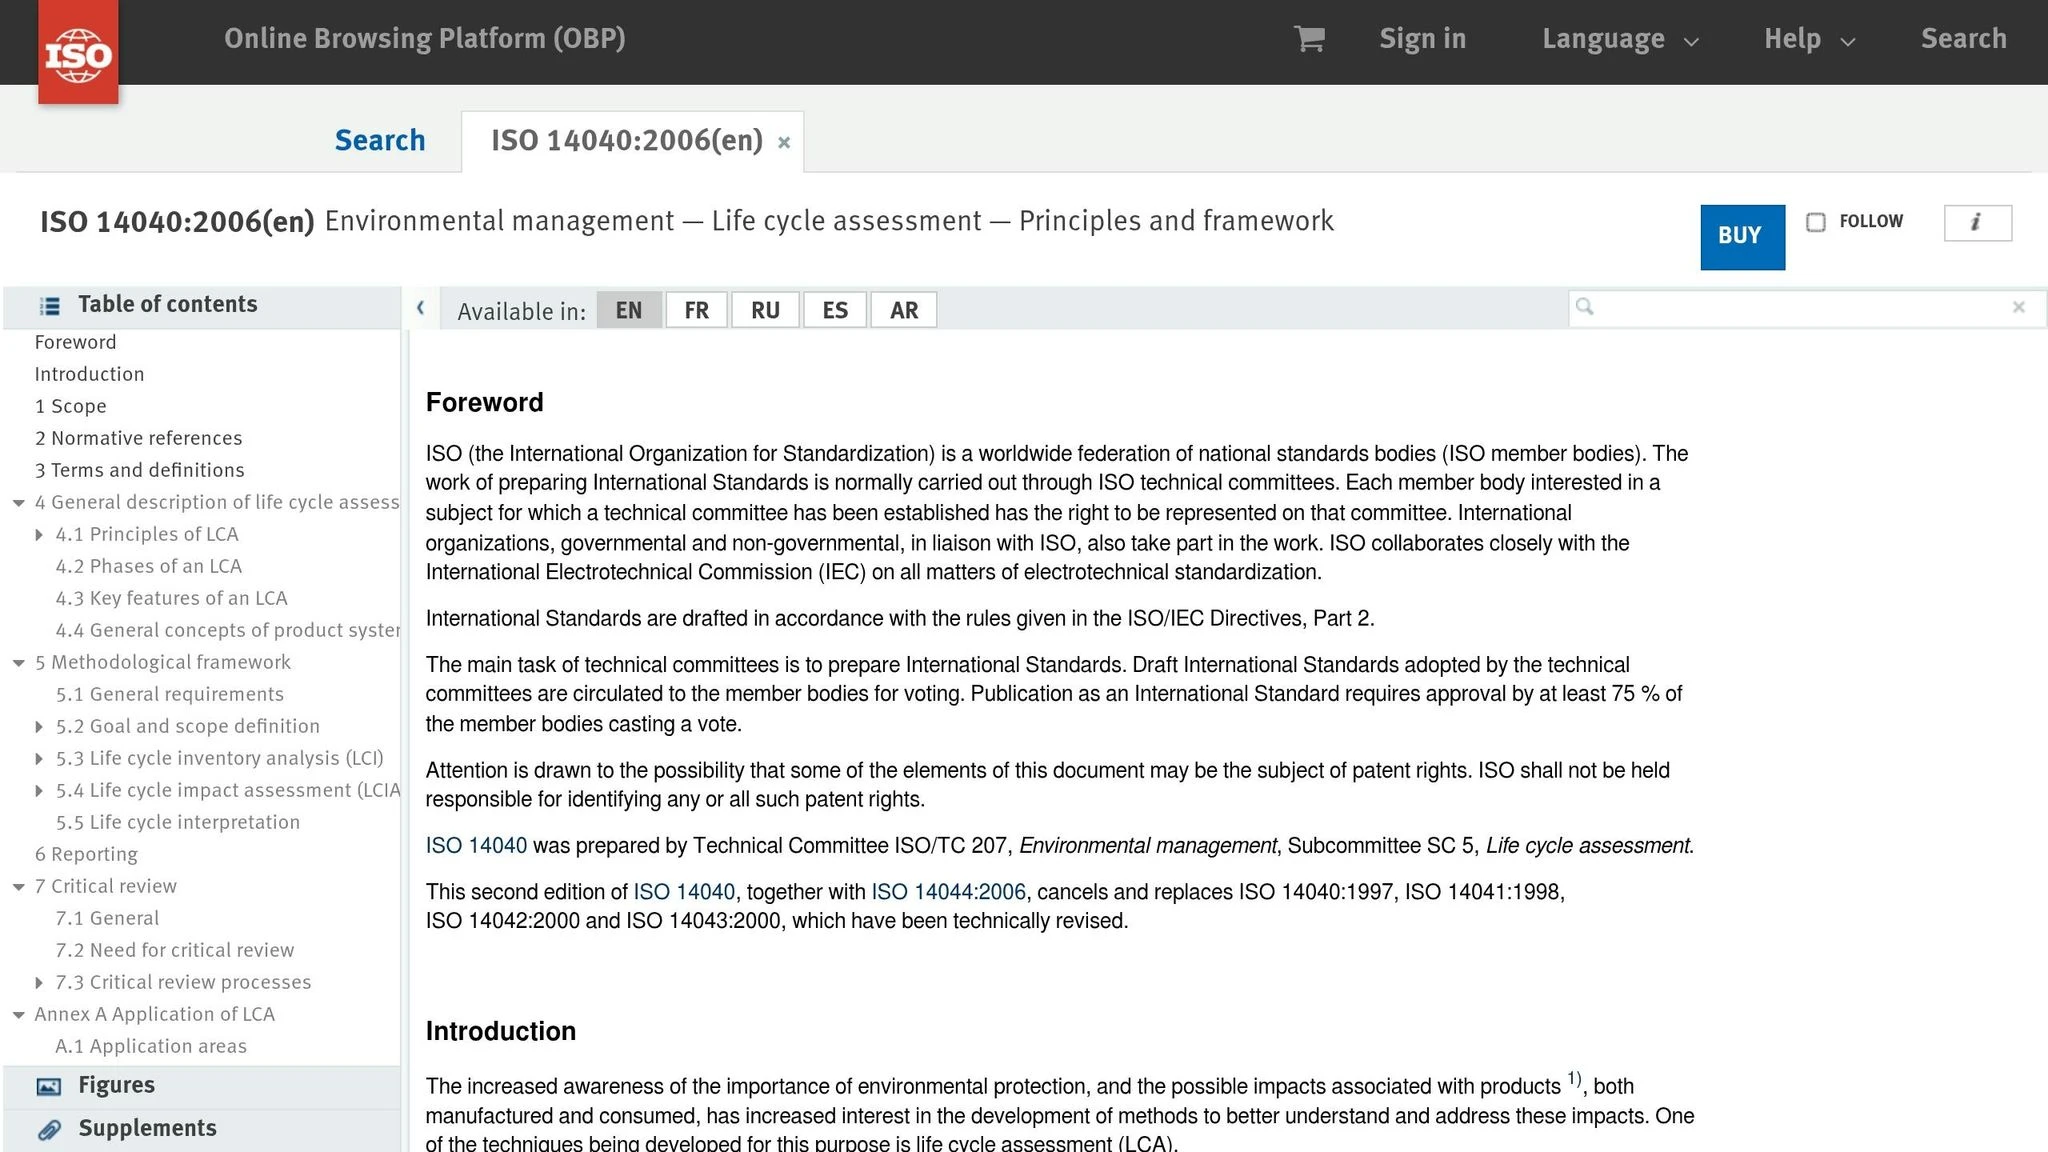
ISO 14040 sets the core framework: a life-cycle view, use of a functional unit, transparency, and an iterative approach. ISO 14044 gets more specific. It sets requirements for each phase, including goal and scope documentation, data quality criteria, allocation procedures, reporting rules, and when an independent critical review is needed.[3][6][12][5][15] If a study supports a comparative public claim, that independent critical review is required.
For circular design, two parts of ISO 14044 need close attention.
Allocation. Circular systems often create multi-output processes, and materials may move into a second life. ISO 14044 sets a clear order here. First, avoid allocation through system expansion or subdivision. If that does not work, use physical relationships such as mass or energy. Economic allocation comes last, and it should be paired with sensitivity analysis.[13][14][15][16]
Data quality. Data needs to match the product, the location, and the time period being studied. For U.S. decisions, that means using U.S. grid, logistics, and end-of-life data rather than global averages that can distort U.S. conditions.[6][14][15]
Once those rules are in place, the model can test which circular strategies the LCA actually supports.
Circular Design Strategies That LCA Can Evaluate
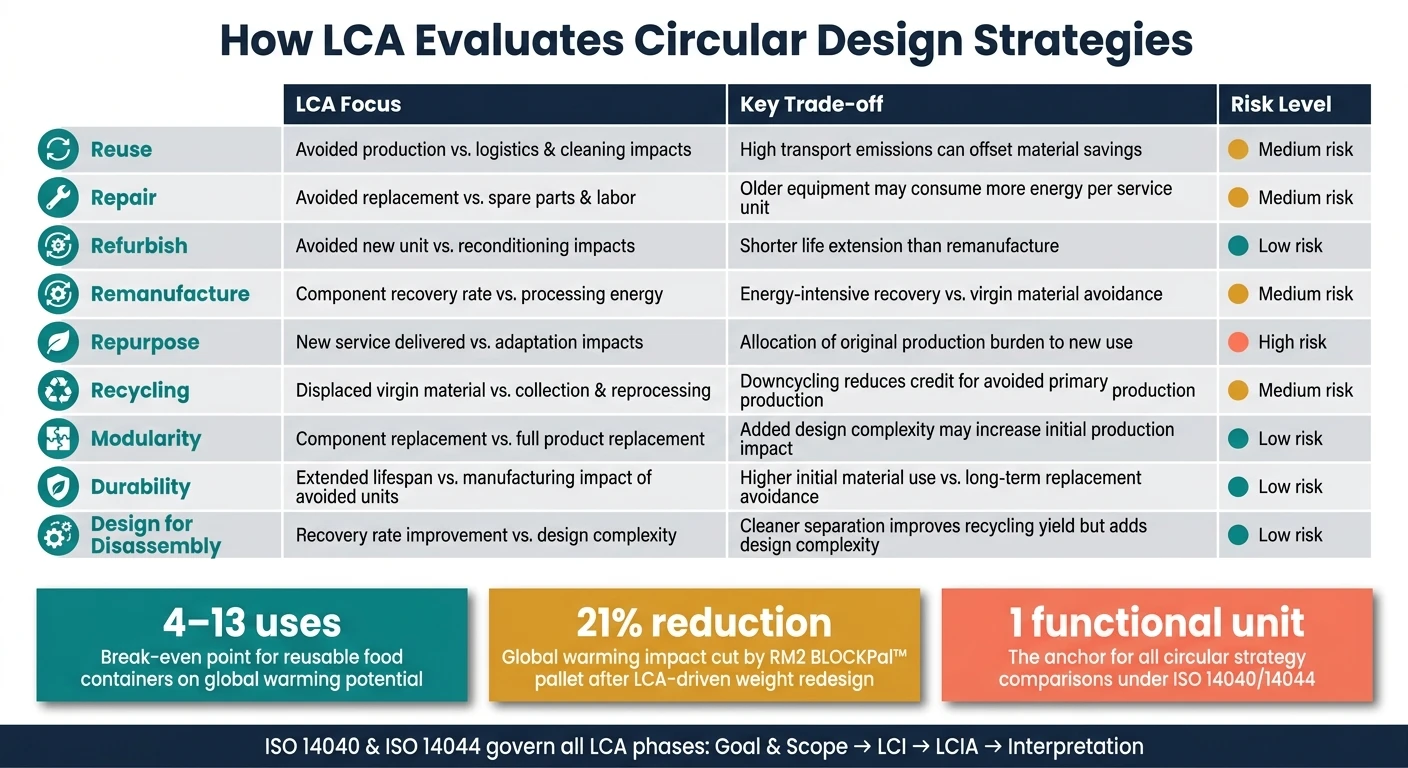
LCA Evaluation of Circular Design Strategies: Trade-offs & Key Data
Once the ISO rules are set, the next job is simple in theory and messy in practice: test which circular moves actually cut impact. LCA helps product teams compare options based on measured results, not on whether something sounds circular. In many cases, reuse, repair, and remanufacturing beat recycling when the conditions are right, because they keep more of the product’s value in play and avoid the energy needed for reprocessing.[18][19]
Reuse, Repair, Refurbish, Remanufacture, and Repurpose
These strategies all keep products or parts in use longer, but they do not affect the system in the same way. Reuse brings in cleaning and transport. Repair brings in spare parts and technician travel. Refurbishment adds testing and reconditioning. Remanufacturing adds disassembly, inspection, and reassembly, while avoiding most virgin production. Repurpose is a different case altogether, since the product takes on a new function, which means the functional unit has to change as well.
One smart-device study makes the point clearly: every circular scenario performed better than the 3-year linear model, and the product-as-a-service option delivered the largest gains.[21]
That said, results can flip when operating conditions are weak. The main risk factors are older equipment with high energy use, low return rates, and long reverse-logistics distances. This is why sensitivity analysis matters so much here. Those variables often decide whether a life-extension plan cuts impact or just shifts it around.[20][21]
Recycling, Recovery, Modularity, Durability, and Design for Disassembly
Recycling and material recovery come into play at end of life. LCA looks at them by asking a few hard questions: How much virgin production does recycled content displace? What are the real recovery rates at end of life? And does the recovered material return to an equivalent-quality use, or does it get downcycled?
Modularity, durability, and design for disassembly (DfD) sit earlier in the design process. They shape how well a product can support more than one circular path over time. A modular product lets teams swap worn parts instead of tossing the whole unit. A durable product stretches the time between replacements. A product built for disassembly comes apart with less effort, which can improve repair yields and material recovery at end of life.[17]
The table below shows what LCA checks for each strategy and where trade-offs usually show up:
Circular Strategy | LCA Evaluation Focus | Key Data Needs | Common Trade-offs |
|---|---|---|---|
Reuse | Avoided production vs. use-phase and logistics impacts | Use cycles, transport distance, cleaning energy | High transport emissions can offset material savings |
Repair | Avoided replacement vs. spare parts and labor impacts | Failure rates, spare parts sourcing, technician travel | Older equipment may consume more energy per service unit |
Refurbish | Avoided new unit vs. reconditioning process impacts | Component replacement rates, testing energy, reverse logistics | Shorter life extension than remanufacture |
Remanufacture | Component recovery rate vs. processing energy | Disassembly yield, cleaning/testing energy, scrap rates | Energy-intensive recovery vs. virgin material avoidance |
Repurpose | New service delivered vs. adaptation and logistics impacts | Residual performance, adaptation hardware, screening costs | Allocation of original production burden to new use |
Recycling | Displaced virgin material vs. collection and reprocessing | Collection rates, sorting yield, processing energy | Downcycling reduces credit for avoided primary production |
Modularity | Component replacement vs. full product replacement | Module lifetimes, disassembly time, part compatibility | Added complexity in design may increase initial production impact |
Durability | Extended lifespan vs. manufacturing impact of avoided units | Product lifetime, failure rates, maintenance frequency | Higher initial material use vs. long-term replacement avoidance |
Design for Disassembly | Recovery rate improvement vs. design complexity | Disassembly time, material separability, tooling needs | Cleaner separation improves recycling yield but may add design complexity |
Use LCA to test strategy-product fit. Circular value depends on context. These comparisons matter most when teams model them early, before design choices are locked in.
How to Apply LCA in Product Design and Development
Knowing which circular strategies LCA can test is only part of the work. The other part is timing. If you run too much analysis too early, you waste time on rough ideas. If you wait too long, the big design calls are already locked in. The better approach is simple: use a light screen early, then add more detail as the design takes shape.
From Concept Screening to Scenario Modeling
At the concept stage, most teams do not need a full LCA. A lean screening LCA, built with generic inventory databases and rough bills of materials, is often enough to answer directional questions. Does moving to recycled PET cut carbon intensity in a meaningful way? Does a reusable format beat single-use once washing and return logistics are included? These early side-by-side checks - virgin vs. recycled, single-use vs. reusable, sealed vs. repairable - help teams rule out weak options before major money and time go into them.[24][23][1] That’s why screening works best as the first pass, before supplier inputs and component details are fixed.
As the design becomes more defined, the model should do the same. Teams split the product into components, plug in supplier-specific data, and test several circular scenarios against one consistent functional unit. Say a packaging team wants to model delivery of 1,000 gallons of beverage to U.S. consumers. It might compare three end-of-life routes - mechanical recycling, landfill, and waste-to-energy - using actual U.S. freight distances and regional grid emission factors. This is the point where parametric scenario tools start to pay off: change one input, like reuse count or recycled content percentage, and the model updates to show how the outcome shifts.[22][1][27]
Hotspot Analysis, Trade-Offs, and Scenario Comparison Rules
Hotspot analysis shows which life cycle stage or component drives most of the impact, so design teams can focus effort where it will count most.[1][4][26] From there, the next move is to check whether those same hotspots stay in place across circular scenarios.
Fair scenario comparison depends on a few basic rules:
Every option needs the same functional unit, especially when comparing repairable and sealed assemblies, where service life may differ.
Assumptions about product life, reuse counts, and user behavior should be written down and easy for business stakeholders to see.
Use-phase conditions should match U.S. reality, including regional grid mix, household appliance efficiency, and likely distribution distances.
End-of-life pathways should reflect actual U.S. end-of-life rates for the material stream being studied, not European default assumptions that can make circular gains look bigger than they are.[24][25][26]
Data Quality, Uncertainty, and Burden Shifting Risks
Primary data should be used for the main impact drivers, like actual plant energy use, measured scrap rates, and confirmed supplier locations. Secondary data from sources such as ecoinvent works well for background processes with less influence on the final result. Teams should rate each data source for reliability and age, then update the gaps most likely to change a design choice.[24][23][29]
Uncertainty needs to be shown, not buried. Sensitivity analysis and result ranges make that possible. A reusable packaging model, for example, might test 10, 25, and 50 use cycles under different U.S. dishwashing energy assumptions to show where the break-even point lands. Research on reusable restaurant food containers found that break-even on global warming potential usually falls between 4 and 13 uses, depending on the single-use baseline and operating conditions.[25][28] Showing a range gives leaders two things at once: the signal from the analysis and the risk around it. Those ranges, paired with hotspot results, help teams focus on the design changes that matter most.
A product that lowers carbon but drives up water use, toxicity, land use, or resource depletion hasn’t fixed the problem; it has just moved it. Looking at carbon, water, toxicity, land use, and resource depletion together is the best way to catch those trade-offs before they get built into a product line.[1][4][26] These outputs feed straight into the next decision: which design changes should move ahead.
Decision Outputs and Next Steps
What Good LCA Outputs Look Like for Design Teams and Executives
A strong LCA should end with a short decision package, not a dump of raw data. The job is simple: show leaders where to act, how much confidence they can place in the findings, and what trade-offs may come with each option.
The most useful outputs usually land in four groups. Hotspot maps show which life-cycle stages and components drive the most impact. Trade-off summaries make it plain when one improvement creates a new burden somewhere else - for example, a chemical recycling process that cuts landfill volume but lifts energy use. Scenario rankings compare circular paths like baseline, design for disassembly, high recycled content, and remanufacturing under the same assumptions. Boundary and assumption documentation records the basis of the study for audit and later updates.
LCA Output | Decision It Supports | Why It Matters |
|---|---|---|
Hotspot map | Redesign prioritization, supplier engagement | Focuses effort on the stages driving the largest share of impact |
Trade-off summary | Multi-criteria design selection | Prevents single-metric wins that shift burdens elsewhere |
Scenario ranking | Investment and circular strategy selection | Compares options on the same assumptions |
Boundary and assumption documentation | Regulatory review, stakeholder communication | Records the study basis for audit and updating |
Confidence levels | Capital allocation, pilot program design | Separates decision-ready insights from areas needing more data |
These outputs are most useful when teams clearly label what is ready for a decision and what is not. Marking results as decision-ready, pilot-ready, or research-needed helps executives back the areas where evidence is strong and steer R&D dollars toward the places where uncertainty is still too high.
Turning Analysis into Action
Once the findings are clear, the next move is to turn them into design, sourcing, and procurement requirements. LCA only matters if it changes what a company builds, buys, or asks of partners. In day-to-day work, that means using hotspot maps to direct engineering effort toward the parts with the highest impact, setting redesign targets tied to LCA metrics, and adding LCA-based thresholds to supplier scorecards and RFQ specifications.
A good example comes from 2022. Pallet maker RM2 used LCA findings on its BLOCKPal™ system to identify pallet weight as the main driver of global warming impact. After redesigning the pallet to weigh less, RM2 cut global warming impact by 21% and reduced diesel use in transport [30]. That gets to the heart of LCA in design: find the driver, change it, and check the result.
Conclusion: Use LCA to Make Circular Design Decisions That Hold Up
Circularity claims without full life-cycle evidence are still assumptions. A product may cut waste at end-of-life, but if it pushes up energy use, water consumption, or toxicity upstream, it has not solved the problem. It has just moved it. ISO-based LCA, built on a clear functional unit, defined system boundaries, sound data, and transparent assumptions, separates defensible circular design from marketing language.
The aim is lower total life-cycle impact without shifting burdens somewhere else. That bar is harder to meet, but it is the one that stands up to scrutiny.
FAQs
What is a functional unit in LCA?
In Life Cycle Assessment (LCA), a functional unit is the reference point used to compare products or services on equal terms.
It sets a specific, measurable service - such as delivering 1 liter of beverage to a consumer - so impacts are judged by the same level of service, not by random product measures.
When is a screening LCA enough?
A screening-level lifecycle assessment is often enough when you need a faster, more accessible read on impact and you're working from secondary data. In most cases, it can be finished in 4 to 8 weeks.
That makes it a solid place to start. It helps teams spot product impact hotspots early and guide design and circular economy choices when primary supply chain data isn't available yet. It also gives you a way to move forward before putting time and money into a full, peer-reviewed LCA, which usually takes 3 to 6 months.
How do I avoid burden shifting?
Use Lifecycle Assessment (LCA) to assess multiple impact categories at the same time, instead of zeroing in on a single metric.
Burden shifting happens when solving one problem, like ocean pollution, creates another one somewhere else, such as higher carbon emissions, more water use, or added toxicity. A multi-criteria approach brings those trade-offs into view, so teams can spot options that are better overall rather than better in just one narrow area.
Related Blog Posts
Latest Articles
©2026

Narrative Change and Power Building: The Missing Half of Advocacy
Narrative change is the process of disrupting dominant narratives that normalize inequity and advancing new narratives from historically marginalized communities.

Funding Resilience Without Federal Grants
BRIC is unreliable and FEMA is shrinking. Here's how cities fund climate resilience with dedicated revenue, blended finance, and a coordinating authority.

The ESG Blind Spot: How AI Is Finding Risks in Companies Nobody Else Is Watching
Norway's sovereign wealth fund uses AI to screen 7,200 portfolio companies for forced labor and corruption within 24 hours. The real story is the emerging-market coverage gap that traditional ESG data vendors miss — and what it means for any company with a global supply chain.
Narrative Change and Power Building: The Missing Half of Advocacy
Narrative change is the process of disrupting dominant narratives that normalize inequity and advancing new narratives from historically marginalized communities.
Funding Resilience Without Federal Grants
BRIC is unreliable and FEMA is shrinking. Here's how cities fund climate resilience with dedicated revenue, blended finance, and a coordinating authority.
The ESG Blind Spot: How AI Is Finding Risks in Companies Nobody Else Is Watching
Norway's sovereign wealth fund uses AI to screen 7,200 portfolio companies for forced labor and corruption within 24 hours. The real story is the emerging-market coverage gap that traditional ESG data vendors miss — and what it means for any company with a global supply chain.
FAQ
01
What does it really mean to “redefine profit”?
02
What makes Council Fire different?
03
Who does Council Fire work with?
04
What does working with Council Fire actually look like?
05
How does Council Fire help organizations turn big goals into action?
06
How does Council Fire define and measure success?
07
How does technology fit into Council Fire’s work?
Jul 25, 2026
Lifecycle Assessment in Circular Economy Design
Sustainability Strategy
In This Article
ISO-based LCA tests reuse, repair, remanufacture and recycling to show when circular design cuts total life-cycle impact.
Lifecycle Assessment in Circular Economy Design
If I want circular design claims to hold up, I need lifecycle assessment. It tells me whether reuse, repair, remanufacturing, recycled content, modularity, or take-back programs cut total impact per unit of service - or just shift impacts from one stage to another.
Here’s the short version:
LCA tracks the whole life cycle: raw materials, manufacturing, shipping, use, and end-of-life.
The functional unit is the key rule: I compare options based on the same service delivered, not just the same product.
ISO 14040 and 14044 set the ground rules: scope, data quality, allocation, reporting, and review.
Circular options can flip based on conditions: return rates, reverse-logistics miles, electricity mix, cleaning energy, and product life often decide the outcome.
One metric is not enough: carbon may go down while water use, toxicity, land use, or resource use goes up.
Early screening helps: I can test rough concepts first, then add supplier and process data later.
Good outputs are decision-focused: hotspot maps, scenario rankings, trade-off notes, assumptions, and confidence ranges.
A few numbers make the point. Research on reusable food containers found climate break-even points often land between 4 and 13 uses. One pallet redesign cut global warming impact by 21% after LCA showed weight was the main driver. Those examples show why circular design needs numbers, not labels.
If I boil the article down to one message, it’s this: circular design works only when the whole system works. LCA is how I check that before a claim, pilot, or purchase decision goes out the door.
LCA for Ecodesign: A step-by-step guide
LCA Foundations and ISO Requirements for Circular Design
Life cycle assessment gives circular design a way to test claims with numbers. It shows whether reuse, repair, remanufacturing, or recycling cuts impact per functional unit.[7][9] In plain terms, LCA tracks materials and energy across the full system and compares options based on the service the product provides.[9][11] That functional unit is the anchor. Without it, design comparisons fall apart.
LCA Basics: Phases, Terms, and the Link to Circular Economy
ISO 14040 and ISO 14044 define LCA as a four-phase, iterative process built to support comparable, auditable comparisons across products and business models.[7][9][6]
ISO LCA Phase | What It Does | Why It Matters for Circular Design |
|---|---|---|
Goal & Scope | Defines the functional unit, system boundaries, and study purpose | Determines whether reuse, repair, or recycling loops are included in the comparison |
Life Cycle Inventory (LCI) | Collects and models energy, material, emissions, and waste data across included stages | Shows how circular strategies change material flows, such as recycled content replacing virgin input or added transport from reverse logistics |
Life Cycle Impact Assessment (LCIA) | Converts inventory data into impact indicators such as global warming potential, acidification, eutrophication, smog formation, and resource depletion | Makes trade-offs visible so teams can see whether gains in one category create problems in another |
Interpretation | Analyzes results to identify hotspots, uncertainties, limitations, and improvement options | Produces design recommendations and clarifies confidence for decision-makers |
These phases matter because every circular design move - reuse loops, repairability, modularity, recycling, reverse logistics - changes at least one part of the model. Together, the four phases turn a design idea into a comparison you can defend.[6][2]
That matters in practice. LCA can show when a gain in one stage leads to a loss somewhere else. A reusable container, for example, may cut waste but add transport and cleaning impacts. In the interpretation phase, scenario analysis tests whether that option still comes out ahead under different assumptions about return rates, use frequency, or the regional energy mix.[8][10][2]
ISO 14040 and ISO 14044: Rules That Make Results Credible
ISO 14040 sets the core framework: a life-cycle view, use of a functional unit, transparency, and an iterative approach. ISO 14044 gets more specific. It sets requirements for each phase, including goal and scope documentation, data quality criteria, allocation procedures, reporting rules, and when an independent critical review is needed.[3][6][12][5][15] If a study supports a comparative public claim, that independent critical review is required.
For circular design, two parts of ISO 14044 need close attention.
Allocation. Circular systems often create multi-output processes, and materials may move into a second life. ISO 14044 sets a clear order here. First, avoid allocation through system expansion or subdivision. If that does not work, use physical relationships such as mass or energy. Economic allocation comes last, and it should be paired with sensitivity analysis.[13][14][15][16]
Data quality. Data needs to match the product, the location, and the time period being studied. For U.S. decisions, that means using U.S. grid, logistics, and end-of-life data rather than global averages that can distort U.S. conditions.[6][14][15]
Once those rules are in place, the model can test which circular strategies the LCA actually supports.
Circular Design Strategies That LCA Can Evaluate
LCA Evaluation of Circular Design Strategies: Trade-offs & Key Data
Once the ISO rules are set, the next job is simple in theory and messy in practice: test which circular moves actually cut impact. LCA helps product teams compare options based on measured results, not on whether something sounds circular. In many cases, reuse, repair, and remanufacturing beat recycling when the conditions are right, because they keep more of the product’s value in play and avoid the energy needed for reprocessing.[18][19]
Reuse, Repair, Refurbish, Remanufacture, and Repurpose
These strategies all keep products or parts in use longer, but they do not affect the system in the same way. Reuse brings in cleaning and transport. Repair brings in spare parts and technician travel. Refurbishment adds testing and reconditioning. Remanufacturing adds disassembly, inspection, and reassembly, while avoiding most virgin production. Repurpose is a different case altogether, since the product takes on a new function, which means the functional unit has to change as well.
One smart-device study makes the point clearly: every circular scenario performed better than the 3-year linear model, and the product-as-a-service option delivered the largest gains.[21]
That said, results can flip when operating conditions are weak. The main risk factors are older equipment with high energy use, low return rates, and long reverse-logistics distances. This is why sensitivity analysis matters so much here. Those variables often decide whether a life-extension plan cuts impact or just shifts it around.[20][21]
Recycling, Recovery, Modularity, Durability, and Design for Disassembly
Recycling and material recovery come into play at end of life. LCA looks at them by asking a few hard questions: How much virgin production does recycled content displace? What are the real recovery rates at end of life? And does the recovered material return to an equivalent-quality use, or does it get downcycled?
Modularity, durability, and design for disassembly (DfD) sit earlier in the design process. They shape how well a product can support more than one circular path over time. A modular product lets teams swap worn parts instead of tossing the whole unit. A durable product stretches the time between replacements. A product built for disassembly comes apart with less effort, which can improve repair yields and material recovery at end of life.[17]
The table below shows what LCA checks for each strategy and where trade-offs usually show up:
Circular Strategy | LCA Evaluation Focus | Key Data Needs | Common Trade-offs |
|---|---|---|---|
Reuse | Avoided production vs. use-phase and logistics impacts | Use cycles, transport distance, cleaning energy | High transport emissions can offset material savings |
Repair | Avoided replacement vs. spare parts and labor impacts | Failure rates, spare parts sourcing, technician travel | Older equipment may consume more energy per service unit |
Refurbish | Avoided new unit vs. reconditioning process impacts | Component replacement rates, testing energy, reverse logistics | Shorter life extension than remanufacture |
Remanufacture | Component recovery rate vs. processing energy | Disassembly yield, cleaning/testing energy, scrap rates | Energy-intensive recovery vs. virgin material avoidance |
Repurpose | New service delivered vs. adaptation and logistics impacts | Residual performance, adaptation hardware, screening costs | Allocation of original production burden to new use |
Recycling | Displaced virgin material vs. collection and reprocessing | Collection rates, sorting yield, processing energy | Downcycling reduces credit for avoided primary production |
Modularity | Component replacement vs. full product replacement | Module lifetimes, disassembly time, part compatibility | Added complexity in design may increase initial production impact |
Durability | Extended lifespan vs. manufacturing impact of avoided units | Product lifetime, failure rates, maintenance frequency | Higher initial material use vs. long-term replacement avoidance |
Design for Disassembly | Recovery rate improvement vs. design complexity | Disassembly time, material separability, tooling needs | Cleaner separation improves recycling yield but may add design complexity |
Use LCA to test strategy-product fit. Circular value depends on context. These comparisons matter most when teams model them early, before design choices are locked in.
How to Apply LCA in Product Design and Development
Knowing which circular strategies LCA can test is only part of the work. The other part is timing. If you run too much analysis too early, you waste time on rough ideas. If you wait too long, the big design calls are already locked in. The better approach is simple: use a light screen early, then add more detail as the design takes shape.
From Concept Screening to Scenario Modeling
At the concept stage, most teams do not need a full LCA. A lean screening LCA, built with generic inventory databases and rough bills of materials, is often enough to answer directional questions. Does moving to recycled PET cut carbon intensity in a meaningful way? Does a reusable format beat single-use once washing and return logistics are included? These early side-by-side checks - virgin vs. recycled, single-use vs. reusable, sealed vs. repairable - help teams rule out weak options before major money and time go into them.[24][23][1] That’s why screening works best as the first pass, before supplier inputs and component details are fixed.
As the design becomes more defined, the model should do the same. Teams split the product into components, plug in supplier-specific data, and test several circular scenarios against one consistent functional unit. Say a packaging team wants to model delivery of 1,000 gallons of beverage to U.S. consumers. It might compare three end-of-life routes - mechanical recycling, landfill, and waste-to-energy - using actual U.S. freight distances and regional grid emission factors. This is the point where parametric scenario tools start to pay off: change one input, like reuse count or recycled content percentage, and the model updates to show how the outcome shifts.[22][1][27]
Hotspot Analysis, Trade-Offs, and Scenario Comparison Rules
Hotspot analysis shows which life cycle stage or component drives most of the impact, so design teams can focus effort where it will count most.[1][4][26] From there, the next move is to check whether those same hotspots stay in place across circular scenarios.
Fair scenario comparison depends on a few basic rules:
Every option needs the same functional unit, especially when comparing repairable and sealed assemblies, where service life may differ.
Assumptions about product life, reuse counts, and user behavior should be written down and easy for business stakeholders to see.
Use-phase conditions should match U.S. reality, including regional grid mix, household appliance efficiency, and likely distribution distances.
End-of-life pathways should reflect actual U.S. end-of-life rates for the material stream being studied, not European default assumptions that can make circular gains look bigger than they are.[24][25][26]
Data Quality, Uncertainty, and Burden Shifting Risks
Primary data should be used for the main impact drivers, like actual plant energy use, measured scrap rates, and confirmed supplier locations. Secondary data from sources such as ecoinvent works well for background processes with less influence on the final result. Teams should rate each data source for reliability and age, then update the gaps most likely to change a design choice.[24][23][29]
Uncertainty needs to be shown, not buried. Sensitivity analysis and result ranges make that possible. A reusable packaging model, for example, might test 10, 25, and 50 use cycles under different U.S. dishwashing energy assumptions to show where the break-even point lands. Research on reusable restaurant food containers found that break-even on global warming potential usually falls between 4 and 13 uses, depending on the single-use baseline and operating conditions.[25][28] Showing a range gives leaders two things at once: the signal from the analysis and the risk around it. Those ranges, paired with hotspot results, help teams focus on the design changes that matter most.
A product that lowers carbon but drives up water use, toxicity, land use, or resource depletion hasn’t fixed the problem; it has just moved it. Looking at carbon, water, toxicity, land use, and resource depletion together is the best way to catch those trade-offs before they get built into a product line.[1][4][26] These outputs feed straight into the next decision: which design changes should move ahead.
Decision Outputs and Next Steps
What Good LCA Outputs Look Like for Design Teams and Executives
A strong LCA should end with a short decision package, not a dump of raw data. The job is simple: show leaders where to act, how much confidence they can place in the findings, and what trade-offs may come with each option.
The most useful outputs usually land in four groups. Hotspot maps show which life-cycle stages and components drive the most impact. Trade-off summaries make it plain when one improvement creates a new burden somewhere else - for example, a chemical recycling process that cuts landfill volume but lifts energy use. Scenario rankings compare circular paths like baseline, design for disassembly, high recycled content, and remanufacturing under the same assumptions. Boundary and assumption documentation records the basis of the study for audit and later updates.
LCA Output | Decision It Supports | Why It Matters |
|---|---|---|
Hotspot map | Redesign prioritization, supplier engagement | Focuses effort on the stages driving the largest share of impact |
Trade-off summary | Multi-criteria design selection | Prevents single-metric wins that shift burdens elsewhere |
Scenario ranking | Investment and circular strategy selection | Compares options on the same assumptions |
Boundary and assumption documentation | Regulatory review, stakeholder communication | Records the study basis for audit and updating |
Confidence levels | Capital allocation, pilot program design | Separates decision-ready insights from areas needing more data |
These outputs are most useful when teams clearly label what is ready for a decision and what is not. Marking results as decision-ready, pilot-ready, or research-needed helps executives back the areas where evidence is strong and steer R&D dollars toward the places where uncertainty is still too high.
Turning Analysis into Action
Once the findings are clear, the next move is to turn them into design, sourcing, and procurement requirements. LCA only matters if it changes what a company builds, buys, or asks of partners. In day-to-day work, that means using hotspot maps to direct engineering effort toward the parts with the highest impact, setting redesign targets tied to LCA metrics, and adding LCA-based thresholds to supplier scorecards and RFQ specifications.
A good example comes from 2022. Pallet maker RM2 used LCA findings on its BLOCKPal™ system to identify pallet weight as the main driver of global warming impact. After redesigning the pallet to weigh less, RM2 cut global warming impact by 21% and reduced diesel use in transport [30]. That gets to the heart of LCA in design: find the driver, change it, and check the result.
Conclusion: Use LCA to Make Circular Design Decisions That Hold Up
Circularity claims without full life-cycle evidence are still assumptions. A product may cut waste at end-of-life, but if it pushes up energy use, water consumption, or toxicity upstream, it has not solved the problem. It has just moved it. ISO-based LCA, built on a clear functional unit, defined system boundaries, sound data, and transparent assumptions, separates defensible circular design from marketing language.
The aim is lower total life-cycle impact without shifting burdens somewhere else. That bar is harder to meet, but it is the one that stands up to scrutiny.
FAQs
What is a functional unit in LCA?
In Life Cycle Assessment (LCA), a functional unit is the reference point used to compare products or services on equal terms.
It sets a specific, measurable service - such as delivering 1 liter of beverage to a consumer - so impacts are judged by the same level of service, not by random product measures.
When is a screening LCA enough?
A screening-level lifecycle assessment is often enough when you need a faster, more accessible read on impact and you're working from secondary data. In most cases, it can be finished in 4 to 8 weeks.
That makes it a solid place to start. It helps teams spot product impact hotspots early and guide design and circular economy choices when primary supply chain data isn't available yet. It also gives you a way to move forward before putting time and money into a full, peer-reviewed LCA, which usually takes 3 to 6 months.
How do I avoid burden shifting?
Use Lifecycle Assessment (LCA) to assess multiple impact categories at the same time, instead of zeroing in on a single metric.
Burden shifting happens when solving one problem, like ocean pollution, creates another one somewhere else, such as higher carbon emissions, more water use, or added toxicity. A multi-criteria approach brings those trade-offs into view, so teams can spot options that are better overall rather than better in just one narrow area.
Related Blog Posts
Latest Articles
©2026
Narrative Change and Power Building: The Missing Half of Advocacy
Narrative change is the process of disrupting dominant narratives that normalize inequity and advancing new narratives from historically marginalized communities.
Funding Resilience Without Federal Grants
BRIC is unreliable and FEMA is shrinking. Here's how cities fund climate resilience with dedicated revenue, blended finance, and a coordinating authority.
The ESG Blind Spot: How AI Is Finding Risks in Companies Nobody Else Is Watching
Norway's sovereign wealth fund uses AI to screen 7,200 portfolio companies for forced labor and corruption within 24 hours. The real story is the emerging-market coverage gap that traditional ESG data vendors miss — and what it means for any company with a global supply chain.
FAQ
01
What does it really mean to “redefine profit”?
02
What makes Council Fire different?
03
Who does Council Fire work with?
04
What does working with Council Fire actually look like?
05
How does Council Fire help organizations turn big goals into action?
06
How does Council Fire define and measure success?
07
How does technology fit into Council Fire’s work?
Jul 25, 2026
Lifecycle Assessment in Circular Economy Design
Sustainability Strategy
In This Article
ISO-based LCA tests reuse, repair, remanufacture and recycling to show when circular design cuts total life-cycle impact.
Lifecycle Assessment in Circular Economy Design
If I want circular design claims to hold up, I need lifecycle assessment. It tells me whether reuse, repair, remanufacturing, recycled content, modularity, or take-back programs cut total impact per unit of service - or just shift impacts from one stage to another.
Here’s the short version:
LCA tracks the whole life cycle: raw materials, manufacturing, shipping, use, and end-of-life.
The functional unit is the key rule: I compare options based on the same service delivered, not just the same product.
ISO 14040 and 14044 set the ground rules: scope, data quality, allocation, reporting, and review.
Circular options can flip based on conditions: return rates, reverse-logistics miles, electricity mix, cleaning energy, and product life often decide the outcome.
One metric is not enough: carbon may go down while water use, toxicity, land use, or resource use goes up.
Early screening helps: I can test rough concepts first, then add supplier and process data later.
Good outputs are decision-focused: hotspot maps, scenario rankings, trade-off notes, assumptions, and confidence ranges.
A few numbers make the point. Research on reusable food containers found climate break-even points often land between 4 and 13 uses. One pallet redesign cut global warming impact by 21% after LCA showed weight was the main driver. Those examples show why circular design needs numbers, not labels.
If I boil the article down to one message, it’s this: circular design works only when the whole system works. LCA is how I check that before a claim, pilot, or purchase decision goes out the door.
LCA for Ecodesign: A step-by-step guide
LCA Foundations and ISO Requirements for Circular Design
Life cycle assessment gives circular design a way to test claims with numbers. It shows whether reuse, repair, remanufacturing, or recycling cuts impact per functional unit.[7][9] In plain terms, LCA tracks materials and energy across the full system and compares options based on the service the product provides.[9][11] That functional unit is the anchor. Without it, design comparisons fall apart.
LCA Basics: Phases, Terms, and the Link to Circular Economy
ISO 14040 and ISO 14044 define LCA as a four-phase, iterative process built to support comparable, auditable comparisons across products and business models.[7][9][6]
ISO LCA Phase | What It Does | Why It Matters for Circular Design |
|---|---|---|
Goal & Scope | Defines the functional unit, system boundaries, and study purpose | Determines whether reuse, repair, or recycling loops are included in the comparison |
Life Cycle Inventory (LCI) | Collects and models energy, material, emissions, and waste data across included stages | Shows how circular strategies change material flows, such as recycled content replacing virgin input or added transport from reverse logistics |
Life Cycle Impact Assessment (LCIA) | Converts inventory data into impact indicators such as global warming potential, acidification, eutrophication, smog formation, and resource depletion | Makes trade-offs visible so teams can see whether gains in one category create problems in another |
Interpretation | Analyzes results to identify hotspots, uncertainties, limitations, and improvement options | Produces design recommendations and clarifies confidence for decision-makers |
These phases matter because every circular design move - reuse loops, repairability, modularity, recycling, reverse logistics - changes at least one part of the model. Together, the four phases turn a design idea into a comparison you can defend.[6][2]
That matters in practice. LCA can show when a gain in one stage leads to a loss somewhere else. A reusable container, for example, may cut waste but add transport and cleaning impacts. In the interpretation phase, scenario analysis tests whether that option still comes out ahead under different assumptions about return rates, use frequency, or the regional energy mix.[8][10][2]
ISO 14040 and ISO 14044: Rules That Make Results Credible
ISO 14040 sets the core framework: a life-cycle view, use of a functional unit, transparency, and an iterative approach. ISO 14044 gets more specific. It sets requirements for each phase, including goal and scope documentation, data quality criteria, allocation procedures, reporting rules, and when an independent critical review is needed.[3][6][12][5][15] If a study supports a comparative public claim, that independent critical review is required.
For circular design, two parts of ISO 14044 need close attention.
Allocation. Circular systems often create multi-output processes, and materials may move into a second life. ISO 14044 sets a clear order here. First, avoid allocation through system expansion or subdivision. If that does not work, use physical relationships such as mass or energy. Economic allocation comes last, and it should be paired with sensitivity analysis.[13][14][15][16]
Data quality. Data needs to match the product, the location, and the time period being studied. For U.S. decisions, that means using U.S. grid, logistics, and end-of-life data rather than global averages that can distort U.S. conditions.[6][14][15]
Once those rules are in place, the model can test which circular strategies the LCA actually supports.
Circular Design Strategies That LCA Can Evaluate
LCA Evaluation of Circular Design Strategies: Trade-offs & Key Data
Once the ISO rules are set, the next job is simple in theory and messy in practice: test which circular moves actually cut impact. LCA helps product teams compare options based on measured results, not on whether something sounds circular. In many cases, reuse, repair, and remanufacturing beat recycling when the conditions are right, because they keep more of the product’s value in play and avoid the energy needed for reprocessing.[18][19]
Reuse, Repair, Refurbish, Remanufacture, and Repurpose
These strategies all keep products or parts in use longer, but they do not affect the system in the same way. Reuse brings in cleaning and transport. Repair brings in spare parts and technician travel. Refurbishment adds testing and reconditioning. Remanufacturing adds disassembly, inspection, and reassembly, while avoiding most virgin production. Repurpose is a different case altogether, since the product takes on a new function, which means the functional unit has to change as well.
One smart-device study makes the point clearly: every circular scenario performed better than the 3-year linear model, and the product-as-a-service option delivered the largest gains.[21]
That said, results can flip when operating conditions are weak. The main risk factors are older equipment with high energy use, low return rates, and long reverse-logistics distances. This is why sensitivity analysis matters so much here. Those variables often decide whether a life-extension plan cuts impact or just shifts it around.[20][21]
Recycling, Recovery, Modularity, Durability, and Design for Disassembly
Recycling and material recovery come into play at end of life. LCA looks at them by asking a few hard questions: How much virgin production does recycled content displace? What are the real recovery rates at end of life? And does the recovered material return to an equivalent-quality use, or does it get downcycled?
Modularity, durability, and design for disassembly (DfD) sit earlier in the design process. They shape how well a product can support more than one circular path over time. A modular product lets teams swap worn parts instead of tossing the whole unit. A durable product stretches the time between replacements. A product built for disassembly comes apart with less effort, which can improve repair yields and material recovery at end of life.[17]
The table below shows what LCA checks for each strategy and where trade-offs usually show up:
Circular Strategy | LCA Evaluation Focus | Key Data Needs | Common Trade-offs |
|---|---|---|---|
Reuse | Avoided production vs. use-phase and logistics impacts | Use cycles, transport distance, cleaning energy | High transport emissions can offset material savings |
Repair | Avoided replacement vs. spare parts and labor impacts | Failure rates, spare parts sourcing, technician travel | Older equipment may consume more energy per service unit |
Refurbish | Avoided new unit vs. reconditioning process impacts | Component replacement rates, testing energy, reverse logistics | Shorter life extension than remanufacture |
Remanufacture | Component recovery rate vs. processing energy | Disassembly yield, cleaning/testing energy, scrap rates | Energy-intensive recovery vs. virgin material avoidance |
Repurpose | New service delivered vs. adaptation and logistics impacts | Residual performance, adaptation hardware, screening costs | Allocation of original production burden to new use |
Recycling | Displaced virgin material vs. collection and reprocessing | Collection rates, sorting yield, processing energy | Downcycling reduces credit for avoided primary production |
Modularity | Component replacement vs. full product replacement | Module lifetimes, disassembly time, part compatibility | Added complexity in design may increase initial production impact |
Durability | Extended lifespan vs. manufacturing impact of avoided units | Product lifetime, failure rates, maintenance frequency | Higher initial material use vs. long-term replacement avoidance |
Design for Disassembly | Recovery rate improvement vs. design complexity | Disassembly time, material separability, tooling needs | Cleaner separation improves recycling yield but may add design complexity |
Use LCA to test strategy-product fit. Circular value depends on context. These comparisons matter most when teams model them early, before design choices are locked in.
How to Apply LCA in Product Design and Development
Knowing which circular strategies LCA can test is only part of the work. The other part is timing. If you run too much analysis too early, you waste time on rough ideas. If you wait too long, the big design calls are already locked in. The better approach is simple: use a light screen early, then add more detail as the design takes shape.
From Concept Screening to Scenario Modeling
At the concept stage, most teams do not need a full LCA. A lean screening LCA, built with generic inventory databases and rough bills of materials, is often enough to answer directional questions. Does moving to recycled PET cut carbon intensity in a meaningful way? Does a reusable format beat single-use once washing and return logistics are included? These early side-by-side checks - virgin vs. recycled, single-use vs. reusable, sealed vs. repairable - help teams rule out weak options before major money and time go into them.[24][23][1] That’s why screening works best as the first pass, before supplier inputs and component details are fixed.
As the design becomes more defined, the model should do the same. Teams split the product into components, plug in supplier-specific data, and test several circular scenarios against one consistent functional unit. Say a packaging team wants to model delivery of 1,000 gallons of beverage to U.S. consumers. It might compare three end-of-life routes - mechanical recycling, landfill, and waste-to-energy - using actual U.S. freight distances and regional grid emission factors. This is the point where parametric scenario tools start to pay off: change one input, like reuse count or recycled content percentage, and the model updates to show how the outcome shifts.[22][1][27]
Hotspot Analysis, Trade-Offs, and Scenario Comparison Rules
Hotspot analysis shows which life cycle stage or component drives most of the impact, so design teams can focus effort where it will count most.[1][4][26] From there, the next move is to check whether those same hotspots stay in place across circular scenarios.
Fair scenario comparison depends on a few basic rules:
Every option needs the same functional unit, especially when comparing repairable and sealed assemblies, where service life may differ.
Assumptions about product life, reuse counts, and user behavior should be written down and easy for business stakeholders to see.
Use-phase conditions should match U.S. reality, including regional grid mix, household appliance efficiency, and likely distribution distances.
End-of-life pathways should reflect actual U.S. end-of-life rates for the material stream being studied, not European default assumptions that can make circular gains look bigger than they are.[24][25][26]
Data Quality, Uncertainty, and Burden Shifting Risks
Primary data should be used for the main impact drivers, like actual plant energy use, measured scrap rates, and confirmed supplier locations. Secondary data from sources such as ecoinvent works well for background processes with less influence on the final result. Teams should rate each data source for reliability and age, then update the gaps most likely to change a design choice.[24][23][29]
Uncertainty needs to be shown, not buried. Sensitivity analysis and result ranges make that possible. A reusable packaging model, for example, might test 10, 25, and 50 use cycles under different U.S. dishwashing energy assumptions to show where the break-even point lands. Research on reusable restaurant food containers found that break-even on global warming potential usually falls between 4 and 13 uses, depending on the single-use baseline and operating conditions.[25][28] Showing a range gives leaders two things at once: the signal from the analysis and the risk around it. Those ranges, paired with hotspot results, help teams focus on the design changes that matter most.
A product that lowers carbon but drives up water use, toxicity, land use, or resource depletion hasn’t fixed the problem; it has just moved it. Looking at carbon, water, toxicity, land use, and resource depletion together is the best way to catch those trade-offs before they get built into a product line.[1][4][26] These outputs feed straight into the next decision: which design changes should move ahead.
Decision Outputs and Next Steps
What Good LCA Outputs Look Like for Design Teams and Executives
A strong LCA should end with a short decision package, not a dump of raw data. The job is simple: show leaders where to act, how much confidence they can place in the findings, and what trade-offs may come with each option.
The most useful outputs usually land in four groups. Hotspot maps show which life-cycle stages and components drive the most impact. Trade-off summaries make it plain when one improvement creates a new burden somewhere else - for example, a chemical recycling process that cuts landfill volume but lifts energy use. Scenario rankings compare circular paths like baseline, design for disassembly, high recycled content, and remanufacturing under the same assumptions. Boundary and assumption documentation records the basis of the study for audit and later updates.
LCA Output | Decision It Supports | Why It Matters |
|---|---|---|
Hotspot map | Redesign prioritization, supplier engagement | Focuses effort on the stages driving the largest share of impact |
Trade-off summary | Multi-criteria design selection | Prevents single-metric wins that shift burdens elsewhere |
Scenario ranking | Investment and circular strategy selection | Compares options on the same assumptions |
Boundary and assumption documentation | Regulatory review, stakeholder communication | Records the study basis for audit and updating |
Confidence levels | Capital allocation, pilot program design | Separates decision-ready insights from areas needing more data |
These outputs are most useful when teams clearly label what is ready for a decision and what is not. Marking results as decision-ready, pilot-ready, or research-needed helps executives back the areas where evidence is strong and steer R&D dollars toward the places where uncertainty is still too high.
Turning Analysis into Action
Once the findings are clear, the next move is to turn them into design, sourcing, and procurement requirements. LCA only matters if it changes what a company builds, buys, or asks of partners. In day-to-day work, that means using hotspot maps to direct engineering effort toward the parts with the highest impact, setting redesign targets tied to LCA metrics, and adding LCA-based thresholds to supplier scorecards and RFQ specifications.
A good example comes from 2022. Pallet maker RM2 used LCA findings on its BLOCKPal™ system to identify pallet weight as the main driver of global warming impact. After redesigning the pallet to weigh less, RM2 cut global warming impact by 21% and reduced diesel use in transport [30]. That gets to the heart of LCA in design: find the driver, change it, and check the result.
Conclusion: Use LCA to Make Circular Design Decisions That Hold Up
Circularity claims without full life-cycle evidence are still assumptions. A product may cut waste at end-of-life, but if it pushes up energy use, water consumption, or toxicity upstream, it has not solved the problem. It has just moved it. ISO-based LCA, built on a clear functional unit, defined system boundaries, sound data, and transparent assumptions, separates defensible circular design from marketing language.
The aim is lower total life-cycle impact without shifting burdens somewhere else. That bar is harder to meet, but it is the one that stands up to scrutiny.
FAQs
What is a functional unit in LCA?
In Life Cycle Assessment (LCA), a functional unit is the reference point used to compare products or services on equal terms.
It sets a specific, measurable service - such as delivering 1 liter of beverage to a consumer - so impacts are judged by the same level of service, not by random product measures.
When is a screening LCA enough?
A screening-level lifecycle assessment is often enough when you need a faster, more accessible read on impact and you're working from secondary data. In most cases, it can be finished in 4 to 8 weeks.
That makes it a solid place to start. It helps teams spot product impact hotspots early and guide design and circular economy choices when primary supply chain data isn't available yet. It also gives you a way to move forward before putting time and money into a full, peer-reviewed LCA, which usually takes 3 to 6 months.
How do I avoid burden shifting?
Use Lifecycle Assessment (LCA) to assess multiple impact categories at the same time, instead of zeroing in on a single metric.
Burden shifting happens when solving one problem, like ocean pollution, creates another one somewhere else, such as higher carbon emissions, more water use, or added toxicity. A multi-criteria approach brings those trade-offs into view, so teams can spot options that are better overall rather than better in just one narrow area.
Related Blog Posts
Latest Articles
©2026
Narrative Change and Power Building: The Missing Half of Advocacy
Narrative change is the process of disrupting dominant narratives that normalize inequity and advancing new narratives from historically marginalized communities.
Funding Resilience Without Federal Grants
BRIC is unreliable and FEMA is shrinking. Here's how cities fund climate resilience with dedicated revenue, blended finance, and a coordinating authority.
The ESG Blind Spot: How AI Is Finding Risks in Companies Nobody Else Is Watching
Norway's sovereign wealth fund uses AI to screen 7,200 portfolio companies for forced labor and corruption within 24 hours. The real story is the emerging-market coverage gap that traditional ESG data vendors miss — and what it means for any company with a global supply chain.
FAQ
What does it really mean to “redefine profit”?
What makes Council Fire different?
Who does Council Fire work with?
What does working with Council Fire actually look like?
How does Council Fire help organizations turn big goals into action?
How does Council Fire define and measure success?
How does technology fit into Council Fire’s work?