In This Article
Map supplier tiers and material hotspots to cut Scope 3: collect primary data, rank emissions, and plan supplier reductions.
Manufacturing Supply Chains: Carbon Hotspot Analysis
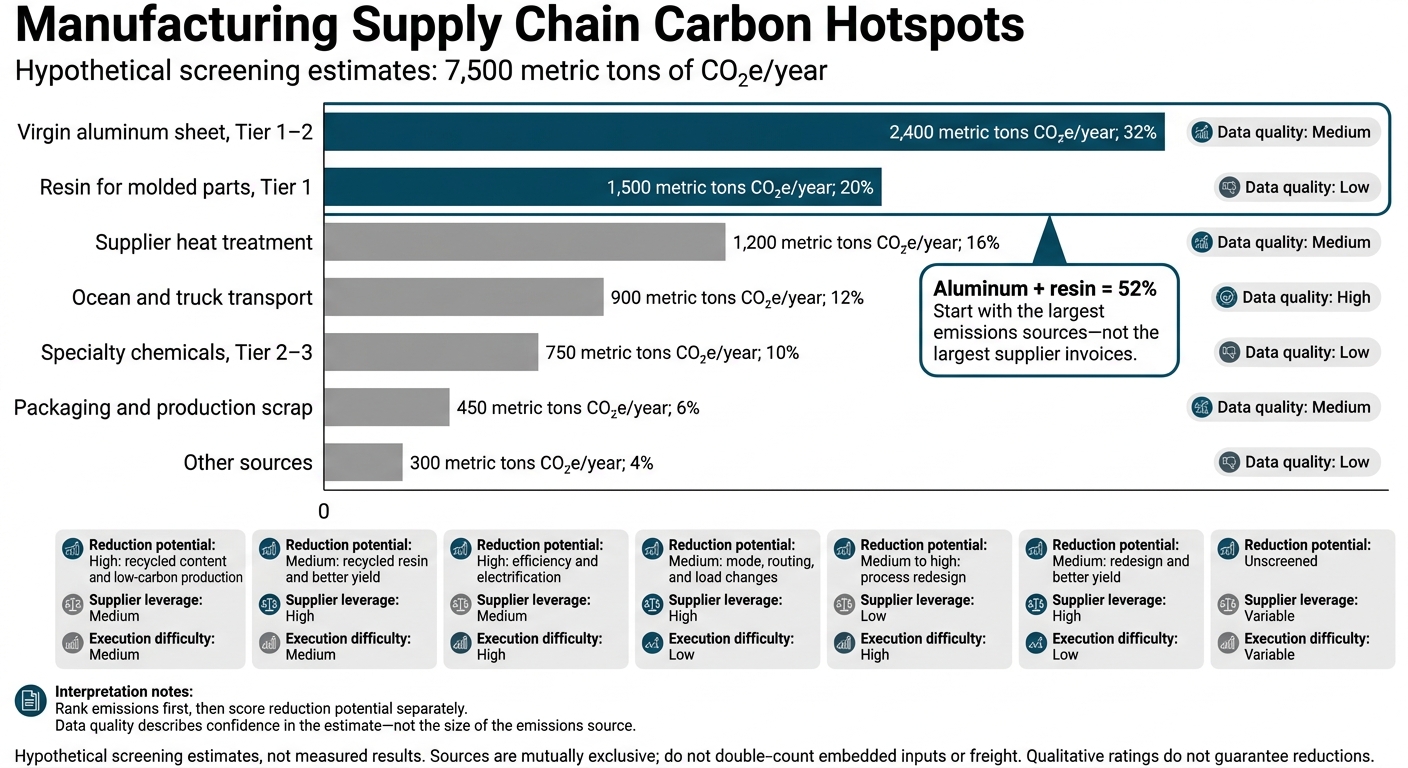
We start with the largest emissions sources - not the largest supplier invoices. In this article’s hypothetical footprint, aluminum and resin account for 52% of 7,500 metric tons of CO₂e. That points us toward materials and production methods before smaller sources.
Our approach turns purchasing records into a plan you can act on:
Set the boundary: Track emissions from raw materials through delivery, without counting the same source twice.
Trace and rank: Follow priority inputs beyond direct suppliers, check data quality, and compare reduction options.
Agree on actions: Give supplier projects owners, budgets, deadlines, and measures of progress.
Track results: Review priorities quarterly and update the inventory annually.
Our rule: <u>separate physical emissions cuts from accounting changes</u>. Better data can change the numbers; it does not mean emissions fell.
Where Supply Chain Decarbonization Starts | Al Iannuzzi | NYC Climate... #Shorts
sbb-itb-8baf5f1
Map Supplier Tiers and Establish an Emissions Baseline
Use the ranked hotspots and confidence ratings from the previous step to decide where to collect primary data first. Start with records already available: procurement provides purchase history and supplier contacts; engineering checks bills of materials (BOMs), material grades, and weights; sustainability sets calculation rules and reviews evidence; logistics provides shipment data; and finance reconciles spending.
Link records through supplier IDs, facility IDs, and part numbers - not supplier names alone. The baseline gives teams a shared reference for hotspot ranking and supplier action planning.
Trace Materials Beyond Direct Suppliers
Connect purchased quantities to BOM quantities and production volumes. Then trace priority inputs through fabricators, processors, refiners, and raw-material producers, starting with the highest-emission materials.
Separate each supplier’s processing emissions from emissions embedded in its purchased inputs. Request part-level, site-level data, rather than relying only on a corporate footprint. For each shipment, record its origin, destination, mode, carrier ownership, freight payer, and whether the supplier footprint already includes transport. Exclude freight already counted.
Choose Calculation Methods and Evidence
Use the GHG Protocol Scope 3 Standard to select methods based on data quality and materiality. Move major sources toward supplier-specific or hybrid calculations, and use spend-based estimates mainly for screening. Primary data can come from utility bills, production records, and material balances; suppliers do not need a completed company-wide inventory before sharing it.[7][3]
| Method | Data needed | Strength | Limit | Best use |
|---|---|---|---|---|
| Supplier-specific | Purchased quantity and supplier product-level cradle-to-gate footprint | Reflects the actual product when supported by sound evidence | Requires clear boundaries, allocation, and supplier cooperation | Major materials and reduction projects |
| Hybrid | Allocated supplier emissions and activity data, plus secondary factors for gaps | Maintains coverage while adding product and supplier detail | Mixed sources can hide omissions or overlaps | Priority components with incomplete tier data |
| Material-based / average-data | Material mass or units, specification, geography, and matching factors | Uses physical quantities rather than prices | May miss site technology, energy mix, and recycled content | Materials with reliable quantities but limited supplier evidence |
| Spend-based | Purchasing value, category, currency, year, and economic factors | Covers records without physical quantities | Changes with prices, inflation, and product mix | Initial screening and low-priority gaps |
Check the evidence before treating supplier data as better data. Request the reporting period, declared unit, site, upstream coverage, exclusions, allocation method, factor references, and verification status. Use ISO 14067 and life-cycle-assessment standards to keep boundaries, allocation, and reporting consistent. Using these standards does not mean a supplier is certified or independently verified.[4][6]
Apply these methods to prepare the hotspot ranking in the next section.
Standardize Supplier and Purchasing Data
| Record group | Required fields and units | Period, allocation, and evidence controls |
|---|---|---|
| Supplier | Legal entity, vendor ID, parent company, site name, site address or country, tier, contact, production activity | Reporting period; distinguish site from corporate data; check against supplier master records |
| Product | Internal and supplier part numbers, BOM link, declared unit, mass in kg or metric tons | BOM revision and production period; document shared-process allocation; retain specifications and product footprints |
| Material | Grade, composition, origin, quantity, recycled content %, yield, scrap rate | Material-data year; document recycled-input and scrap treatment; retain material and production records |
| Process | Process route, production volume, electricity in kWh, fuel and heat in documented units | Metering period; allocation basis across products; utility bills, meters, and calculation workbooks |
| Logistics | Origin, destination, mode, carrier ownership, payer, shipment mass and distance | Shipment dates; allocation across loads; manifests and freight invoices |
| Purchasing | Quantity, purchase date, unit price, spend in U.S. dollars, original currency | Inventory year; exchange-rate method and dollar-year adjustment; invoices and general ledger |
| Emissions evidence | Metric tons of CO₂e; factor value, unit, source, geography, reference year, boundary | Allocation rule, verification status, data-quality rating, and supporting footprint or workbook |
Report totals in metric tons of CO₂e, retain original units, and match activity units to factor units: 1 U.S. short ton = 2,000 lb; 1 metric ton ≈ 2,204.62 lb.
Keep a gap register for missing tier data, factor coverage, and supplier evidence. For spend-based calculations, document dollar-year adjustments so inflation does not appear as higher emissions. Version-control factor updates and supplier-data replacements so better data does not look like emission cuts.
Rank Emissions Sources and Reduction Options
Manufacturing Supply Chain Carbon Hotspots
Identify What Drives Material and Process Emissions
Start with the suppliers, processes, and materials responsible for the most emissions. View the footprint by materials, components, supplier tiers, product families, geography, and freight. These are separate views of the same footprint - not totals to add together.
Separate purchase volume from emissions intensity. For metals, compare production routes and recycled content. For plastics, check resin type, recycled feedstock, polymerization energy, and additives. For chemicals, examine feedstocks, reaction emissions, and energy use. Across all inputs, check yield, scrap, rework, and transport. These drivers help show whether to focus on using less material, cleaner production, or better logistics.[2][5][8]
Rank Hotspots and Check Data Confidence
Use the baseline from the prior section to distinguish the largest emissions sources from the actions with the greatest reduction potential. Rank emissions first, then score reduction potential separately.
Use that ranking to choose suppliers for joint work, rather than simply listing emissions. Keep rows mutually exclusive: if a source appears separately, exclude it from the material footprint.
The table shows hypothetical screening estimates for a 7,500-metric-ton CO₂e footprint.
Source Emissions, metric tons CO₂e/year Footprint share Data quality Reduction potential Supplier leverage Execution difficulty Virgin aluminum sheet, Tier 1–2 2,400 32% Medium High: recycled content and low-carbon production Medium Medium Resin for molded parts, Tier 1 1,500 20% Low Medium: recycled resin and better yield High Medium Supplier heat treatment 1,200 16% Medium High: efficiency and electrification Medium High Ocean and truck transport 900 12% High Medium: mode, routing, and load changes High Low Specialty chemicals, Tier 2–3 750 10% Low Medium to high: process redesign Low High Packaging and production scrap 450 6% Medium Medium: redesign and better yield High Low Other sources 300 4% Low Unscreened Variable Variable
Score data confidence based on reliability, completeness, and fit to current technology, geography, and time period. Test low, central, and high estimates by varying factors, quantities, allocation rules, recycled-content assumptions, and estimates for missing tiers. A hotspot that stays near the top across these tests supports a firmer decision; one that moves sharply in rank remains provisional.
Smaller manufacturers can start with purchasing and material-weight records, then request stronger evidence where uncertainty could change a decision. Record each row’s method, year, boundary, and factor source in the supporting register.[1][9][10]
Choose Reduction Priorities
Separate feasible reductions from large opportunities that are harder to deliver. Use the matrix to screen actions, then calculate annual metric tons of CO₂e avoided and cost per metric ton. Check quality risk, delivery resilience, and supplier readiness together. Ratings guide decisions; they do not guarantee results.
| Option | Emissions impact | Controllability | Data confidence | Cost | Supplier readiness | Timing | Priority |
|---|---|---|---|---|---|---|---|
| Reduce scrap and improve yield | Medium to high | High | High | Low to medium | High | Short term | Immediate action |
| Improve motor, furnace, and process efficiency | Medium to high | Medium | Medium to high | Medium | Medium | Short to medium term | Immediate action |
| Electrify supplier heat processes | High when powered by low-carbon electricity | Medium | Medium | High | Medium | Medium to long term | Long-term collaboration |
| Increase recycled metal or plastic content | High for suitable materials | Medium | Medium | Medium | Medium | Short to medium term | Immediate action or collaboration |
| Redesign for lower material mass | High | High | High | Medium to high | Internal | Medium to long term | Long-term design program |
| Shift freight mode or improve load utilization | Low to medium | High | High | Low to medium | High | Short term | Immediate action |
| Obtain primary data for weak Tier 2–3 sources | Indirect but potentially high | Medium | Low initially | Low to medium | Low to medium | Short term | Better data priority |
| Small, low-confidence source | Unclear | Low | Low | Variable | Variable | Unclear | Monitor |
Work with suppliers to assess joint actions against total emissions, product performance, cost, supply continuity, lead time, quality, and exposure to energy or regulatory risks.
A nearby supplier is not automatically lower-carbon if it uses carbon-intensive electricity or inefficient processes. A distant supplier may have lower production emissions but higher freight impacts.
Compare full scenarios, including material production, supplier energy, process losses, packaging, transport mode, shipment utilization, and expected defect or replacement rates. Joint changes should preserve resilience without creating excess inventory that increases waste. Carry the top, high-confidence priorities into supplier action planning.
Create Supplier Emissions Reduction Plans
Turn the highest-confidence emissions hotspots into supplier action plans.
Request Supplier Data and Agree on Actions
Group suppliers by emissions contribution, importance to the business, and readiness, rather than tier alone. Start with the top three to five hotspots. Offer joint planning support to high-impact suppliers that are central to your business, and keep requests simpler for lower-priority suppliers.
Request product carbon footprints, Scope 1 and Scope 2 emissions, energy consumption by source, material composition, output volumes, allocation methods, and reduction plans. Keep supplier-wide emissions separate from emissions allocated to your purchases. Protect sensitive production data with confidentiality terms and restricted access.
Follow a disclose-validate-plan-implement-measure-improve cycle. Check boundaries and allocation methods, then agree on a one-page plan. Name the emissions source, baseline, intervention, expected reduction, budget, supplier and buyer owners, deadline, and measurement method. Set a deadline for replacing missing evidence.
Connect the data request to sourcing terms and performance targets.
Tie Procurement Support to Measured Results
Make each commitment part of sourcing decisions - not a standalone questionnaire. Contracts should spell out required disclosures, accepted evidence, change notifications, and corrective action for missed milestones. Separate minimum requirements from preferred sourcing criteria.
Tie co-investment, preferred-supplier status, or longer purchasing commitments to documented progress, while keeping quality and delivery requirements in place. Coordinate requests across departments so suppliers don't have to report the same information twice.
| Hotspot type | Owner tier | Requested evidence | Intervention | Buyer action | KPI | Review cycle |
|---|---|---|---|---|---|---|
| Primary steel or aluminum | Tier 1–2 material producer | Product footprint, furnace energy, recycled content, allocation | Increase recycled content; improve efficiency; use lower-carbon production | Volume commitment; technical review | kg CO₂e/kg material; recycled content % | Quarterly during implementation |
| Fossil-fuel process heat | Tier 1 manufacturer or processing subcontractor | Site/process fuel use, equipment age, output volume | Electrify heat; improve insulation; use suitable lower-carbon fuels | Feasibility study; co-investment | Energy per unit; absolute Scope 1 emissions | Monthly or quarterly during pilot |
| High-carbon resin or chemical input | Tier 2–3 material supplier | Feedstock, recycled or bio-based content, product footprint | Substitute feedstock; increase recycled content; reduce losses | Design collaboration; material approval | Product carbon intensity; recycled content % | Quarterly |
| Scrap and low process yield | Tier 1 contract manufacturer | Input/output mass balance, defects, rework | Improve yield, maintenance, process control, and design | Joint lean or quality project | Scrap rate; yield; emissions per saleable unit | Monthly |
| Inbound freight | Logistics provider or supplier shipping point | Mode, distance, weight, fuel, shipment frequency | Consolidate loads; shift modes; optimize routes | Forecast sharing; lane redesign | kg CO₂e/ton-mile; load factor | Monthly or quarterly |
Plan Supplier Action With Council Fire
Council Fire can help translate hotspot findings into procurement criteria, product-design choices, and capital plans. Use systems thinking, circularity, and stakeholder engagement to connect these efforts around specific supplier actions rather than separate workstreams.
Define concrete deliverables: selected supplier projects, responsibilities, funding decisions, milestones, and progress measures. Ask how suppliers and internal engineering, finance, and procurement teams will shape each plan. Keep assurance separate from planning support; planning work is not verification.
Record each action in the inventory and review cycle to keep progress visible.
Conclusion: Track Reductions and Update the Baseline
After ranking hotspots and planning supplier actions, put the results into a regular review cycle. Maintain a version-controlled emissions baseline and a live reduction register that records owners, deadlines, costs, methods, and status.
Assign Owners and Measure Progress
Give each team a clear role: sustainability manages the inventory, procurement handles supplier engagement, engineering reviews technical details, operations implements projects, finance makes investment decisions, and business leaders resolve trade-offs. Name one owner for each hotspot to maintain tier-level traceability and coordinate supplier workstreams. Each owner keeps the baseline current and the reduction plan on track.
Measure progress using total metric tons of CO₂e, kilograms of CO₂e per finished unit, the share of Scope 3 emissions covered by supplier-specific data, priority-supplier plan coverage, and verified base-year reductions. Keep denominators consistent, and report achieved reductions separately from contracted or estimated savings.
Review priority sources quarterly and update the inventory annually. Document when major changes to boundaries, methods, or data require a base-year recalculation. Include the thresholds, approvals, and rules for restating results.[11]
Schedule Projects and Annual Inventory Updates
Follow this sequence during the first reporting cycle.
| Maintenance stage | Required output |
|---|---|
| Review hotspot priorities | Updated hotspot register |
| Close priority data gaps | Updated supplier data and confidence ratings |
| Update supplier commitments | Updated plans, owners, and deadlines |
| Review reduction projects | Project savings estimates |
| Update annual inventory | Reconciled inventory, progress report, and revised action plan |
Repeat the sequence each year to keep hotspot priorities and supplier actions current.
Maintain version-controlled links between purchases, factors, calculations, and evidence. Map every hotspot and reduction project to its Scope 3 category, reporting boundary, base year, and target metric. Where applicable, align the program with approved science-based targets.
Separate physical reductions from accounting changes. Report purchasing volume, product mix, factor updates, and improvements in data quality separately so that inventory decreases aren't automatically treated as decarbonization.
FAQs
How can we trace emissions when upstream suppliers won't share data?
Use a hybrid approach to build a baseline you can support with evidence. Start with spend-based estimates from EEIO models, such as EPA supply chain emission factors, to identify high-emission categories. Apply industry-average emission factors to smaller suppliers while requesting primary data from your top 20 to 100 high-impact suppliers.
Label estimates as low-confidence placeholders. Replace them with primary data as supplier relationships strengthen and data collection improves.
How do we prioritize hotspots when emissions estimates are uncertain?
Don’t let imperfect data hold up action. Use spend-based estimates from economic input-output models to build a baseline that points you in the right direction. Then identify the three to five categories responsible for 80% to 90% of your total footprint. Take a hybrid approach: gather primary data from suppliers contributing most to that footprint, and use sector-specific averages for the rest. Improve data quality over time instead of waiting for a perfect baseline.
How can we cut supplier emissions with limited purchasing leverage?
Replace rigid demands with collaborative partnerships that treat decarbonization as shared value rather than a compliance burden. Start with spend-based screening to identify your highest-emitting categories. Then focus on a select group of critical or high-emission suppliers.
Help these partners act through co-investment in energy efficiency projects, training or data support, and sustainability metrics built into procurement scorecards. Council Fire helps organizations turn sustainability goals into measurable, long-term action.




FAQ