
Jul 31, 2026
How Supply Chains Track Scope 3 Data
Sustainability Strategy
In This Article
Rank material categories, map suppliers, and use spend, activity, and supplier-specific data to build reliable Scope 3 inventories.
How Supply Chains Track Scope 3 Data
Most companies miss the bulk of their emissions because it sits in the supply chain, not inside their own sites. If you want to track Scope 3 well, I’d keep it simple: rank the biggest categories first, map the suppliers behind them, collect the right data by category, and check it before reporting.
For many manufacturers, retailers, and consumer goods companies, Scope 3 is the largest part of the footprint. In many cases, Category 1 alone can make up 43% of total Scope 3 emissions, yet only 36% of companies report it. On top of that, SBTi requires Scope 3 targets when Scope 3 is 40% or more of total emissions, and those targets must cover at least 67% of Scope 3.
If I had to boil the article down into a short action list, it would be this:
Start with material categories such as purchased goods, freight, product use, capital goods, and end-of-life
Use spend and activity data to find hotspots before sending supplier requests
Focus first on top suppliers, especially those that make up 80% of spend
Match the method to the category:
Supplier-specific for high-impact suppliers and products
Activity-based for freight, fuel, and energy-heavy processes
Spend-based for low-impact areas, tail spend, and early estimates
Check units, time periods, factors, outliers, and gaps before disclosure
Use low-confidence proxies only as placeholders, then improve them in the next cycle
A few numbers shape the whole approach:
Upstream Scope 3 averages 26 times higher than Scope 1 and 2 combined
Only about 25% of companies use supplier-specific methods for purchased goods and services
Just 13% of companies put climate requirements into supplier contracts
Fewer than 6% include enforcement terms
Quick Comparison
Data method | Accuracy | Effort | Best fit |
|---|---|---|---|
Supplier-specific | High | High | Top suppliers, hotspot categories, target tracking |
Activity-based | Medium to High | Medium | Freight lanes, fuel use, energy-heavy inputs |
Spend-based | Low | Low | Screening, lower-impact categories, missing supplier data |
The core idea is straightforward: don’t try to get perfect data from every supplier at once. I’d start where emissions are highest, use the best data available for each category, and improve the inventory year by year.
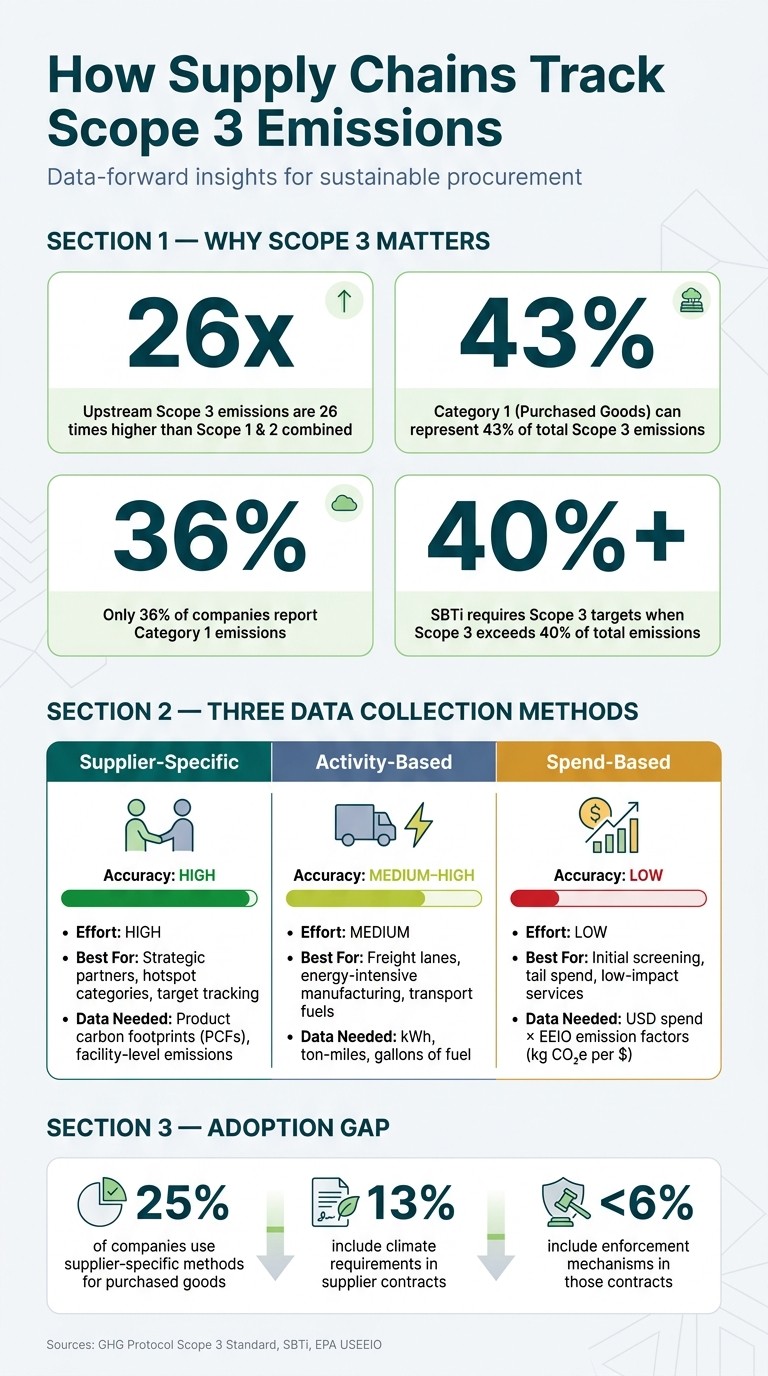
Scope 3 Supply Chain Emissions: Key Stats & Data Collection Methods
Mastering Scope 3 Emissions – From Strategy to Supply Chain Action Webinar
Map Categories, Suppliers, and Tiers Before Collecting Data
Procurement, finance, logistics, and sustainability need to work from the same supplier taxonomy, with shared vendor IDs and category codes. If they don’t, duplicate entries and missing records slow everything down. Just as important, that map shows which suppliers should hear from you first.
Screen Material Categories Using Spend and Activity Data
Start with spend data, then bring in activity data where spend is too rough to tell the full story. That helps teams sort likely hotspots from lower-priority categories without wasting time.
Spend on its own can be too rough - especially for Category 4 (Upstream Transportation). In that case, logistics data gives you a better estimate. Shipment weight, distance, and transport mode usually tell you more than dollar figures because they track what actually happened. Put both data sets together, and you get a practical starting point for prioritization.
The aim is simple: focus primary data collection on the small set of categories and suppliers that drive most emissions. The GHG Protocol recommends ranking tier 1 suppliers by spend and selecting those that together account for at least 80% of spend, plus any supplier that individually exceeds 1% of spend or is strategically important [3]. That keeps outreach focused and helps teams avoid flooding low-impact suppliers with requests.
Once categories are ranked, the next step is to build the supplier and tier map.
Build a Supplier and Tier Map
After ranking categories, map the suppliers behind them. Each record should include supplier name, parent company, business unit, commodity or product type, geography, contract owner, spend, tier, and the relevant Scope 3 category. When suppliers are tied to internal category owners - not only sustainability leads - follow-up becomes much clearer, and so does accountability.
For most service-based categories, tier 1 data is enough. Tier depth matters more when upstream processing drives emissions. With physical goods tied to carbon-intensive upstream processes - such as steel, chemicals, and agricultural commodities - the largest emissions often sit at tier 2 or 3, where raw material extraction or energy-heavy manufacturing takes place [2][4]. If a tier 1 supplier is a trader or distributor instead of a manufacturer, the data they provide is often too aggregated to support solid estimates or useful reduction planning. In those cases, extending the map helps show where the footprint actually sits.
Prioritization Table: Categories and Suppliers Ranked by Impact
Use this matrix to decide which suppliers should get primary-data requests first.
Scope 3 Category | Spend Level | Est. Emissions | Supplier Count | Emission Factor Availability | Data Maturity Level | Recommended Action |
|---|---|---|---|---|---|---|
Cat 1: Purchased Goods & Services (Raw Materials) | High | Very High | Many | Low | Low | Primary data - engage top suppliers now |
Cat 4: Upstream Transportation | Medium | High | Moderate | Medium | Medium | Activity-based - use freight lane records |
Cat 11: Use of Sold Products | N/A | High | N/A | Low | Low | Primary data - coordinate with product engineering |
Cat 2: Capital Goods | High | Medium | Few | Medium | Medium | Hybrid - spend-based plus selective primary |
Cat 5: Waste from Operations | Low | Low | Few | High | High | Spend-based - secondary factors are usually sufficient |
Cat 6: Business Travel | Low | Low | Few | High | High | Spend-based - secondary factors are usually sufficient |
High-impact categories should get primary data first. Lower-impact categories can stay on secondary factors until the inventory becomes more mature.
Use this ranking to sequence supplier requests in the next phase.
Collect Scope 3 Data Through a Phased Supplier Engagement Process
Scope 3 data collection works best when ownership is clear from the start. Procurement should lead supplier outreach, sustainability should own methodology and validation, finance should provide spend data, and IT should keep the workflow running. With that setup in place, the prioritization table becomes a practical, category-by-category request plan instead of a static worksheet.
Choose the Right Data Collection Method for Each Category
Pick the method based on materiality, supplier maturity, and what data is actually available.
Supplier-specific data is the most accurate option. It means collecting product carbon footprints (PCFs) or facility-level emissions straight from suppliers. This method fits best for strategic, high-impact partners, but it takes time and supplier capability to get right. Today, only about 25% of companies use supplier-specific methods for purchased goods and services. [1]
Activity-based data sits in the middle. You collect physical activity metrics - kWh of electricity for energy-intensive products, ton-miles for domestic freight, gallons of fuel for transport - and multiply them by emission factors from EPA or DEFRA sources. This is a good fit for logistics and manufacturing categories where shipment or energy records are solid, even if a full PCF is out of reach. Use consistent U.S. units and number formats, such as 1,250,000 ton-miles and $250,000.00.
Spend-based estimates rely on financial records - USD spend in a category - multiplied by EPA's USEEIO-based supply chain emission factors, expressed as kg CO₂e per dollar spent. This is the fastest method. It works well for early screening, tail spend, and lower-impact service categories. Just as important, it gives you a defensible baseline while you work toward more primary data.
Assign one method to each category, then move your highest-impact areas up the ladder first. Once the method is chosen, turn it into the exact fields each supplier needs to submit.
Run Supplier Outreach and Data Requests
After methods are assigned, start outreach with the highest-impact tier 1 suppliers. A two-wave approach keeps the process focused without overwhelming the team.
Wave 1 should focus on tier 1 suppliers tied to the highest-impact categories. These suppliers need direct engagement, such as meetings, shared templates, and sometimes site visits.
Wave 2 should cover the rest of the supply base through standard questionnaires and portal submissions.
For each supplier request, spell out the required fields with no guesswork: reporting period, base year, boundary, emissions in metric tons of CO₂e, activity data and units, methodology, emission-factor sources, and third-party verification status.
It also helps to build these requirements into contracts and RFP templates. That step can improve response rates because it moves climate reporting from a nice-to-have into a stated expectation. Right now, only 13% of companies include climate-related requirements in supplier contracts, and fewer than 6% include enforcement mechanisms. [5] Tying data reporting to preferred supplier status or incentives adds one more reason to respond.
When suppliers do not respond, use spend-based proxies or industry-average factors. Mark them as low-confidence placeholders and flag them for follow-up in the next reporting cycle.
Method Comparison Table: Supplier-Specific, Activity-Based, and Spend-Based Approaches
Use the table below to match method, effort, and data needs to each category.
Method | Accuracy | Effort | Data Requirements | Best Use Case |
|---|---|---|---|---|
Supplier-Specific | High | High | Primary data (PCFs, allocated facility emissions) | Strategic partners; high-impact hotspot categories; tracking reduction targets |
Activity-Based | Medium to High | Medium | Physical units (kWh, miles, ton-miles, gallons) | Freight and logistics; energy-intensive manufacturing; transport fuels |
Spend-Based | Low | Low | Financial records (USD spend) with EEIO or DEFRA factors | Initial screening; tail spend; low-impact services; early-stage inventories |
Use this table to assign methods by category. Start with the data you can get now, then move your most material categories to higher-accuracy methods year by year.
Check Data Quality and Build a Reporting Workflow
For the categories and suppliers you already ranked as most important, the next job is simple in theory and messy in practice: turn raw data into an inventory that can stand up to review.
Validate Completeness, Consistency, and Credibility
Start by cross-checking supplier activity data against finance records, purchase volumes, and logistics data. If a supplier reports fuel use or material weight that doesn’t match what your internal records suggest, pause and dig into the gap before disclosure.
At this stage, three checks carry the most weight:
Unit and timeframe alignment: Bring all data into one fiscal year and one shared unit set before you apply emission factors.
Emission factor verification: Check that factors are current and fit the right region. Sources such as EPA, DEFRA, or Ecoinvent may fit, depending on the geography and activity.
Outlier screening: Flag emissions intensity numbers that sit well outside prior-year results or benchmark ranges.
For material categories, run a sensitivity analysis. In plain terms, test how much the total inventory moves when a key assumption or emission factor changes. That gives you a clearer read on uncertainty in the final number.
Document assumptions, data gaps, and proxies so a verifier can review them without playing detective.
Design the Inventory, Review, and Disclosure Process
Once validation is done, move the data through one clear workflow: intake, category calculations, review, and disclosure. Each step needs one owner. No gray area, no finger-pointing later.
Procurement should reconcile supplier submissions with purchase and logistics records. Sustainability should check methodology and emission factor choices against the GHG Protocol Scope 3 Standard. Finance should confirm that spend data matches the general ledger and flag variances. Only after those reviews should the data move into disclosure.
After sign-off, lock the files. If a methodology change or acquisition shifts the baseline by more than 5–10% [6], apply a recalculation policy. Also log any changes made after review, along with the reason. That paper trail matters.
Data Quality Checklist: Checks and Internal Owners
Check | What to Look For | Internal Owner |
|---|---|---|
Unit Consistency | All inputs converted to required reporting units such as metric tons or kWh | Sustainability / Procurement |
Emission Factor Source | Factors are current, version-controlled, and region-appropriate | Sustainability |
Boundary Coverage | Prioritized categories and suppliers are included; gaps are documented | Sustainability |
Outlier Threshold | Emissions intensity figures are checked against benchmarks and prior-year data; outliers are flagged | Finance / Sustainability |
Spend Alignment | Activity data is cross-referenced against spend and purchase volumes from finance records | Finance |
Version Lock | Final data sets are locked after sign-off; log any post-review changes and why | IT / Sustainability |
Assign each check to a named owner before the reporting cycle opens. If you wait until data starts coming in, small issues have a way of turning into reporting problems fast.
Conclusion: How to Improve Scope 3 Tracking Year Over Year
The goal isn’t to get perfect data on the first pass. It’s to get better with each reporting cycle. Scope 3 tracking gets stronger through repeatable work: better category ranking, better supplier mapping, better data, and better review.
The big shift is moving from proxies to supplier-specific data. A practical path is to begin with screening and a base year, then bring in primary data for the highest-impact categories, and after that expand coverage and assurance. Upstream Scope 3 emissions average 26 times higher than direct Scopes 1 and 2 emissions [1][7], which makes this shift one of the highest-leverage moves a supply chain team can make.
Once data quality improves, the next step is putting that data to work in procurement. Data should shape decisions, not sit in a disclosure file. Scope 3 data only matters when procurement uses it in bids, scorecards, and contract terms.
Each cycle should make the next one faster, more accurate, and more useful.
FAQs
Where should we start with Scope 3 data?
Start by mapping your value chain across the 15 GHG Protocol categories. The easiest place to begin is with the data you already have: financial records and procurement data. Those records give you a practical backbone for early analysis, especially when perfect emissions data isn’t on hand yet. Use spend-based estimates to build a baseline that’s directionally correct, then use that first pass to spot the biggest emissions hotspots.
Once that baseline is in place, tighten your focus. Put detailed measurement on the 3 to 5 material categories that account for 80 to 90 percent of your footprint. In parallel, prioritize your top 20 to 100 suppliers based on emissions exposure. That way, you’re not trying to boil the ocean - you’re spending time where the numbers are biggest and where action is most likely to matter.
How do we choose between supplier, activity, and spend data?
Choose based on reporting maturity, balancing accuracy with what your team can actually deliver.
Start with spend-based data to screen categories and find the biggest emissions hotspots. It’s the fastest way to get a rough picture, especially early on. Then move to activity-based and supplier-specific data for the categories that matter most, with the deepest supplier data focused on strategic suppliers.
Over time, replace spend-based estimates with primary data through an iterative improvement roadmap. That approach keeps the work practical while improving data quality where it has the most impact.
How often should we update our Scope 3 inventory?
Annual updates are the right baseline for a Scope 3 inventory. They make it easier to track trends, measure progress against targets, and spot emissions drivers before they slip under the radar. They also line up with common reporting expectations, which helps keep your process in step with what stakeholders tend to expect.
Your value chain map should work the same way: as a living document, not a one-and-done file. Update it when supplier relationships shift or when new risk information comes in. A recurring reporting calendar also helps keep data collection, validation, and review steady from one cycle to the next.
Related Blog Posts
Latest Articles
©2025

Narrative Change and Power Building: The Missing Half of Advocacy
Narrative change is the process of disrupting dominant narratives that normalize inequity and advancing new narratives from historically marginalized communities.

Funding Resilience Without Federal Grants
BRIC is unreliable and FEMA is shrinking. Here's how cities fund climate resilience with dedicated revenue, blended finance, and a coordinating authority.

The ESG Blind Spot: How AI Is Finding Risks in Companies Nobody Else Is Watching
Norway's sovereign wealth fund uses AI to screen 7,200 portfolio companies for forced labor and corruption within 24 hours. The real story is the emerging-market coverage gap that traditional ESG data vendors miss — and what it means for any company with a global supply chain.
Narrative Change and Power Building: The Missing Half of Advocacy
Narrative change is the process of disrupting dominant narratives that normalize inequity and advancing new narratives from historically marginalized communities.
Funding Resilience Without Federal Grants
BRIC is unreliable and FEMA is shrinking. Here's how cities fund climate resilience with dedicated revenue, blended finance, and a coordinating authority.
The ESG Blind Spot: How AI Is Finding Risks in Companies Nobody Else Is Watching
Norway's sovereign wealth fund uses AI to screen 7,200 portfolio companies for forced labor and corruption within 24 hours. The real story is the emerging-market coverage gap that traditional ESG data vendors miss — and what it means for any company with a global supply chain.
FAQ
01
What does it really mean to “redefine profit”?
02
What makes Council Fire different?
03
Who does Council Fire work with?
04
What does working with Council Fire actually look like?
05
How does Council Fire help organizations turn big goals into action?
06
How does Council Fire define and measure success?
Jul 31, 2026
How Supply Chains Track Scope 3 Data
Sustainability Strategy
In This Article
Rank material categories, map suppliers, and use spend, activity, and supplier-specific data to build reliable Scope 3 inventories.
How Supply Chains Track Scope 3 Data
Most companies miss the bulk of their emissions because it sits in the supply chain, not inside their own sites. If you want to track Scope 3 well, I’d keep it simple: rank the biggest categories first, map the suppliers behind them, collect the right data by category, and check it before reporting.
For many manufacturers, retailers, and consumer goods companies, Scope 3 is the largest part of the footprint. In many cases, Category 1 alone can make up 43% of total Scope 3 emissions, yet only 36% of companies report it. On top of that, SBTi requires Scope 3 targets when Scope 3 is 40% or more of total emissions, and those targets must cover at least 67% of Scope 3.
If I had to boil the article down into a short action list, it would be this:
Start with material categories such as purchased goods, freight, product use, capital goods, and end-of-life
Use spend and activity data to find hotspots before sending supplier requests
Focus first on top suppliers, especially those that make up 80% of spend
Match the method to the category:
Supplier-specific for high-impact suppliers and products
Activity-based for freight, fuel, and energy-heavy processes
Spend-based for low-impact areas, tail spend, and early estimates
Check units, time periods, factors, outliers, and gaps before disclosure
Use low-confidence proxies only as placeholders, then improve them in the next cycle
A few numbers shape the whole approach:
Upstream Scope 3 averages 26 times higher than Scope 1 and 2 combined
Only about 25% of companies use supplier-specific methods for purchased goods and services
Just 13% of companies put climate requirements into supplier contracts
Fewer than 6% include enforcement terms
Quick Comparison
Data method | Accuracy | Effort | Best fit |
|---|---|---|---|
Supplier-specific | High | High | Top suppliers, hotspot categories, target tracking |
Activity-based | Medium to High | Medium | Freight lanes, fuel use, energy-heavy inputs |
Spend-based | Low | Low | Screening, lower-impact categories, missing supplier data |
The core idea is straightforward: don’t try to get perfect data from every supplier at once. I’d start where emissions are highest, use the best data available for each category, and improve the inventory year by year.
Scope 3 Supply Chain Emissions: Key Stats & Data Collection Methods
Mastering Scope 3 Emissions – From Strategy to Supply Chain Action Webinar
Map Categories, Suppliers, and Tiers Before Collecting Data
Procurement, finance, logistics, and sustainability need to work from the same supplier taxonomy, with shared vendor IDs and category codes. If they don’t, duplicate entries and missing records slow everything down. Just as important, that map shows which suppliers should hear from you first.
Screen Material Categories Using Spend and Activity Data
Start with spend data, then bring in activity data where spend is too rough to tell the full story. That helps teams sort likely hotspots from lower-priority categories without wasting time.
Spend on its own can be too rough - especially for Category 4 (Upstream Transportation). In that case, logistics data gives you a better estimate. Shipment weight, distance, and transport mode usually tell you more than dollar figures because they track what actually happened. Put both data sets together, and you get a practical starting point for prioritization.
The aim is simple: focus primary data collection on the small set of categories and suppliers that drive most emissions. The GHG Protocol recommends ranking tier 1 suppliers by spend and selecting those that together account for at least 80% of spend, plus any supplier that individually exceeds 1% of spend or is strategically important [3]. That keeps outreach focused and helps teams avoid flooding low-impact suppliers with requests.
Once categories are ranked, the next step is to build the supplier and tier map.
Build a Supplier and Tier Map
After ranking categories, map the suppliers behind them. Each record should include supplier name, parent company, business unit, commodity or product type, geography, contract owner, spend, tier, and the relevant Scope 3 category. When suppliers are tied to internal category owners - not only sustainability leads - follow-up becomes much clearer, and so does accountability.
For most service-based categories, tier 1 data is enough. Tier depth matters more when upstream processing drives emissions. With physical goods tied to carbon-intensive upstream processes - such as steel, chemicals, and agricultural commodities - the largest emissions often sit at tier 2 or 3, where raw material extraction or energy-heavy manufacturing takes place [2][4]. If a tier 1 supplier is a trader or distributor instead of a manufacturer, the data they provide is often too aggregated to support solid estimates or useful reduction planning. In those cases, extending the map helps show where the footprint actually sits.
Prioritization Table: Categories and Suppliers Ranked by Impact
Use this matrix to decide which suppliers should get primary-data requests first.
Scope 3 Category | Spend Level | Est. Emissions | Supplier Count | Emission Factor Availability | Data Maturity Level | Recommended Action |
|---|---|---|---|---|---|---|
Cat 1: Purchased Goods & Services (Raw Materials) | High | Very High | Many | Low | Low | Primary data - engage top suppliers now |
Cat 4: Upstream Transportation | Medium | High | Moderate | Medium | Medium | Activity-based - use freight lane records |
Cat 11: Use of Sold Products | N/A | High | N/A | Low | Low | Primary data - coordinate with product engineering |
Cat 2: Capital Goods | High | Medium | Few | Medium | Medium | Hybrid - spend-based plus selective primary |
Cat 5: Waste from Operations | Low | Low | Few | High | High | Spend-based - secondary factors are usually sufficient |
Cat 6: Business Travel | Low | Low | Few | High | High | Spend-based - secondary factors are usually sufficient |
High-impact categories should get primary data first. Lower-impact categories can stay on secondary factors until the inventory becomes more mature.
Use this ranking to sequence supplier requests in the next phase.
Collect Scope 3 Data Through a Phased Supplier Engagement Process
Scope 3 data collection works best when ownership is clear from the start. Procurement should lead supplier outreach, sustainability should own methodology and validation, finance should provide spend data, and IT should keep the workflow running. With that setup in place, the prioritization table becomes a practical, category-by-category request plan instead of a static worksheet.
Choose the Right Data Collection Method for Each Category
Pick the method based on materiality, supplier maturity, and what data is actually available.
Supplier-specific data is the most accurate option. It means collecting product carbon footprints (PCFs) or facility-level emissions straight from suppliers. This method fits best for strategic, high-impact partners, but it takes time and supplier capability to get right. Today, only about 25% of companies use supplier-specific methods for purchased goods and services. [1]
Activity-based data sits in the middle. You collect physical activity metrics - kWh of electricity for energy-intensive products, ton-miles for domestic freight, gallons of fuel for transport - and multiply them by emission factors from EPA or DEFRA sources. This is a good fit for logistics and manufacturing categories where shipment or energy records are solid, even if a full PCF is out of reach. Use consistent U.S. units and number formats, such as 1,250,000 ton-miles and $250,000.00.
Spend-based estimates rely on financial records - USD spend in a category - multiplied by EPA's USEEIO-based supply chain emission factors, expressed as kg CO₂e per dollar spent. This is the fastest method. It works well for early screening, tail spend, and lower-impact service categories. Just as important, it gives you a defensible baseline while you work toward more primary data.
Assign one method to each category, then move your highest-impact areas up the ladder first. Once the method is chosen, turn it into the exact fields each supplier needs to submit.
Run Supplier Outreach and Data Requests
After methods are assigned, start outreach with the highest-impact tier 1 suppliers. A two-wave approach keeps the process focused without overwhelming the team.
Wave 1 should focus on tier 1 suppliers tied to the highest-impact categories. These suppliers need direct engagement, such as meetings, shared templates, and sometimes site visits.
Wave 2 should cover the rest of the supply base through standard questionnaires and portal submissions.
For each supplier request, spell out the required fields with no guesswork: reporting period, base year, boundary, emissions in metric tons of CO₂e, activity data and units, methodology, emission-factor sources, and third-party verification status.
It also helps to build these requirements into contracts and RFP templates. That step can improve response rates because it moves climate reporting from a nice-to-have into a stated expectation. Right now, only 13% of companies include climate-related requirements in supplier contracts, and fewer than 6% include enforcement mechanisms. [5] Tying data reporting to preferred supplier status or incentives adds one more reason to respond.
When suppliers do not respond, use spend-based proxies or industry-average factors. Mark them as low-confidence placeholders and flag them for follow-up in the next reporting cycle.
Method Comparison Table: Supplier-Specific, Activity-Based, and Spend-Based Approaches
Use the table below to match method, effort, and data needs to each category.
Method | Accuracy | Effort | Data Requirements | Best Use Case |
|---|---|---|---|---|
Supplier-Specific | High | High | Primary data (PCFs, allocated facility emissions) | Strategic partners; high-impact hotspot categories; tracking reduction targets |
Activity-Based | Medium to High | Medium | Physical units (kWh, miles, ton-miles, gallons) | Freight and logistics; energy-intensive manufacturing; transport fuels |
Spend-Based | Low | Low | Financial records (USD spend) with EEIO or DEFRA factors | Initial screening; tail spend; low-impact services; early-stage inventories |
Use this table to assign methods by category. Start with the data you can get now, then move your most material categories to higher-accuracy methods year by year.
Check Data Quality and Build a Reporting Workflow
For the categories and suppliers you already ranked as most important, the next job is simple in theory and messy in practice: turn raw data into an inventory that can stand up to review.
Validate Completeness, Consistency, and Credibility
Start by cross-checking supplier activity data against finance records, purchase volumes, and logistics data. If a supplier reports fuel use or material weight that doesn’t match what your internal records suggest, pause and dig into the gap before disclosure.
At this stage, three checks carry the most weight:
Unit and timeframe alignment: Bring all data into one fiscal year and one shared unit set before you apply emission factors.
Emission factor verification: Check that factors are current and fit the right region. Sources such as EPA, DEFRA, or Ecoinvent may fit, depending on the geography and activity.
Outlier screening: Flag emissions intensity numbers that sit well outside prior-year results or benchmark ranges.
For material categories, run a sensitivity analysis. In plain terms, test how much the total inventory moves when a key assumption or emission factor changes. That gives you a clearer read on uncertainty in the final number.
Document assumptions, data gaps, and proxies so a verifier can review them without playing detective.
Design the Inventory, Review, and Disclosure Process
Once validation is done, move the data through one clear workflow: intake, category calculations, review, and disclosure. Each step needs one owner. No gray area, no finger-pointing later.
Procurement should reconcile supplier submissions with purchase and logistics records. Sustainability should check methodology and emission factor choices against the GHG Protocol Scope 3 Standard. Finance should confirm that spend data matches the general ledger and flag variances. Only after those reviews should the data move into disclosure.
After sign-off, lock the files. If a methodology change or acquisition shifts the baseline by more than 5–10% [6], apply a recalculation policy. Also log any changes made after review, along with the reason. That paper trail matters.
Data Quality Checklist: Checks and Internal Owners
Check | What to Look For | Internal Owner |
|---|---|---|
Unit Consistency | All inputs converted to required reporting units such as metric tons or kWh | Sustainability / Procurement |
Emission Factor Source | Factors are current, version-controlled, and region-appropriate | Sustainability |
Boundary Coverage | Prioritized categories and suppliers are included; gaps are documented | Sustainability |
Outlier Threshold | Emissions intensity figures are checked against benchmarks and prior-year data; outliers are flagged | Finance / Sustainability |
Spend Alignment | Activity data is cross-referenced against spend and purchase volumes from finance records | Finance |
Version Lock | Final data sets are locked after sign-off; log any post-review changes and why | IT / Sustainability |
Assign each check to a named owner before the reporting cycle opens. If you wait until data starts coming in, small issues have a way of turning into reporting problems fast.
Conclusion: How to Improve Scope 3 Tracking Year Over Year
The goal isn’t to get perfect data on the first pass. It’s to get better with each reporting cycle. Scope 3 tracking gets stronger through repeatable work: better category ranking, better supplier mapping, better data, and better review.
The big shift is moving from proxies to supplier-specific data. A practical path is to begin with screening and a base year, then bring in primary data for the highest-impact categories, and after that expand coverage and assurance. Upstream Scope 3 emissions average 26 times higher than direct Scopes 1 and 2 emissions [1][7], which makes this shift one of the highest-leverage moves a supply chain team can make.
Once data quality improves, the next step is putting that data to work in procurement. Data should shape decisions, not sit in a disclosure file. Scope 3 data only matters when procurement uses it in bids, scorecards, and contract terms.
Each cycle should make the next one faster, more accurate, and more useful.
FAQs
Where should we start with Scope 3 data?
Start by mapping your value chain across the 15 GHG Protocol categories. The easiest place to begin is with the data you already have: financial records and procurement data. Those records give you a practical backbone for early analysis, especially when perfect emissions data isn’t on hand yet. Use spend-based estimates to build a baseline that’s directionally correct, then use that first pass to spot the biggest emissions hotspots.
Once that baseline is in place, tighten your focus. Put detailed measurement on the 3 to 5 material categories that account for 80 to 90 percent of your footprint. In parallel, prioritize your top 20 to 100 suppliers based on emissions exposure. That way, you’re not trying to boil the ocean - you’re spending time where the numbers are biggest and where action is most likely to matter.
How do we choose between supplier, activity, and spend data?
Choose based on reporting maturity, balancing accuracy with what your team can actually deliver.
Start with spend-based data to screen categories and find the biggest emissions hotspots. It’s the fastest way to get a rough picture, especially early on. Then move to activity-based and supplier-specific data for the categories that matter most, with the deepest supplier data focused on strategic suppliers.
Over time, replace spend-based estimates with primary data through an iterative improvement roadmap. That approach keeps the work practical while improving data quality where it has the most impact.
How often should we update our Scope 3 inventory?
Annual updates are the right baseline for a Scope 3 inventory. They make it easier to track trends, measure progress against targets, and spot emissions drivers before they slip under the radar. They also line up with common reporting expectations, which helps keep your process in step with what stakeholders tend to expect.
Your value chain map should work the same way: as a living document, not a one-and-done file. Update it when supplier relationships shift or when new risk information comes in. A recurring reporting calendar also helps keep data collection, validation, and review steady from one cycle to the next.
Related Blog Posts
Latest Articles
©2025
Narrative Change and Power Building: The Missing Half of Advocacy
Narrative change is the process of disrupting dominant narratives that normalize inequity and advancing new narratives from historically marginalized communities.
Funding Resilience Without Federal Grants
BRIC is unreliable and FEMA is shrinking. Here's how cities fund climate resilience with dedicated revenue, blended finance, and a coordinating authority.
The ESG Blind Spot: How AI Is Finding Risks in Companies Nobody Else Is Watching
Norway's sovereign wealth fund uses AI to screen 7,200 portfolio companies for forced labor and corruption within 24 hours. The real story is the emerging-market coverage gap that traditional ESG data vendors miss — and what it means for any company with a global supply chain.
FAQ
01
What does it really mean to “redefine profit”?
02
What makes Council Fire different?
03
Who does Council Fire work with?
04
What does working with Council Fire actually look like?
05
How does Council Fire help organizations turn big goals into action?
06
How does Council Fire define and measure success?
Jul 31, 2026
How Supply Chains Track Scope 3 Data
Sustainability Strategy
In This Article
Rank material categories, map suppliers, and use spend, activity, and supplier-specific data to build reliable Scope 3 inventories.
How Supply Chains Track Scope 3 Data
Most companies miss the bulk of their emissions because it sits in the supply chain, not inside their own sites. If you want to track Scope 3 well, I’d keep it simple: rank the biggest categories first, map the suppliers behind them, collect the right data by category, and check it before reporting.
For many manufacturers, retailers, and consumer goods companies, Scope 3 is the largest part of the footprint. In many cases, Category 1 alone can make up 43% of total Scope 3 emissions, yet only 36% of companies report it. On top of that, SBTi requires Scope 3 targets when Scope 3 is 40% or more of total emissions, and those targets must cover at least 67% of Scope 3.
If I had to boil the article down into a short action list, it would be this:
Start with material categories such as purchased goods, freight, product use, capital goods, and end-of-life
Use spend and activity data to find hotspots before sending supplier requests
Focus first on top suppliers, especially those that make up 80% of spend
Match the method to the category:
Supplier-specific for high-impact suppliers and products
Activity-based for freight, fuel, and energy-heavy processes
Spend-based for low-impact areas, tail spend, and early estimates
Check units, time periods, factors, outliers, and gaps before disclosure
Use low-confidence proxies only as placeholders, then improve them in the next cycle
A few numbers shape the whole approach:
Upstream Scope 3 averages 26 times higher than Scope 1 and 2 combined
Only about 25% of companies use supplier-specific methods for purchased goods and services
Just 13% of companies put climate requirements into supplier contracts
Fewer than 6% include enforcement terms
Quick Comparison
Data method | Accuracy | Effort | Best fit |
|---|---|---|---|
Supplier-specific | High | High | Top suppliers, hotspot categories, target tracking |
Activity-based | Medium to High | Medium | Freight lanes, fuel use, energy-heavy inputs |
Spend-based | Low | Low | Screening, lower-impact categories, missing supplier data |
The core idea is straightforward: don’t try to get perfect data from every supplier at once. I’d start where emissions are highest, use the best data available for each category, and improve the inventory year by year.
Scope 3 Supply Chain Emissions: Key Stats & Data Collection Methods
Mastering Scope 3 Emissions – From Strategy to Supply Chain Action Webinar
Map Categories, Suppliers, and Tiers Before Collecting Data
Procurement, finance, logistics, and sustainability need to work from the same supplier taxonomy, with shared vendor IDs and category codes. If they don’t, duplicate entries and missing records slow everything down. Just as important, that map shows which suppliers should hear from you first.
Screen Material Categories Using Spend and Activity Data
Start with spend data, then bring in activity data where spend is too rough to tell the full story. That helps teams sort likely hotspots from lower-priority categories without wasting time.
Spend on its own can be too rough - especially for Category 4 (Upstream Transportation). In that case, logistics data gives you a better estimate. Shipment weight, distance, and transport mode usually tell you more than dollar figures because they track what actually happened. Put both data sets together, and you get a practical starting point for prioritization.
The aim is simple: focus primary data collection on the small set of categories and suppliers that drive most emissions. The GHG Protocol recommends ranking tier 1 suppliers by spend and selecting those that together account for at least 80% of spend, plus any supplier that individually exceeds 1% of spend or is strategically important [3]. That keeps outreach focused and helps teams avoid flooding low-impact suppliers with requests.
Once categories are ranked, the next step is to build the supplier and tier map.
Build a Supplier and Tier Map
After ranking categories, map the suppliers behind them. Each record should include supplier name, parent company, business unit, commodity or product type, geography, contract owner, spend, tier, and the relevant Scope 3 category. When suppliers are tied to internal category owners - not only sustainability leads - follow-up becomes much clearer, and so does accountability.
For most service-based categories, tier 1 data is enough. Tier depth matters more when upstream processing drives emissions. With physical goods tied to carbon-intensive upstream processes - such as steel, chemicals, and agricultural commodities - the largest emissions often sit at tier 2 or 3, where raw material extraction or energy-heavy manufacturing takes place [2][4]. If a tier 1 supplier is a trader or distributor instead of a manufacturer, the data they provide is often too aggregated to support solid estimates or useful reduction planning. In those cases, extending the map helps show where the footprint actually sits.
Prioritization Table: Categories and Suppliers Ranked by Impact
Use this matrix to decide which suppliers should get primary-data requests first.
Scope 3 Category | Spend Level | Est. Emissions | Supplier Count | Emission Factor Availability | Data Maturity Level | Recommended Action |
|---|---|---|---|---|---|---|
Cat 1: Purchased Goods & Services (Raw Materials) | High | Very High | Many | Low | Low | Primary data - engage top suppliers now |
Cat 4: Upstream Transportation | Medium | High | Moderate | Medium | Medium | Activity-based - use freight lane records |
Cat 11: Use of Sold Products | N/A | High | N/A | Low | Low | Primary data - coordinate with product engineering |
Cat 2: Capital Goods | High | Medium | Few | Medium | Medium | Hybrid - spend-based plus selective primary |
Cat 5: Waste from Operations | Low | Low | Few | High | High | Spend-based - secondary factors are usually sufficient |
Cat 6: Business Travel | Low | Low | Few | High | High | Spend-based - secondary factors are usually sufficient |
High-impact categories should get primary data first. Lower-impact categories can stay on secondary factors until the inventory becomes more mature.
Use this ranking to sequence supplier requests in the next phase.
Collect Scope 3 Data Through a Phased Supplier Engagement Process
Scope 3 data collection works best when ownership is clear from the start. Procurement should lead supplier outreach, sustainability should own methodology and validation, finance should provide spend data, and IT should keep the workflow running. With that setup in place, the prioritization table becomes a practical, category-by-category request plan instead of a static worksheet.
Choose the Right Data Collection Method for Each Category
Pick the method based on materiality, supplier maturity, and what data is actually available.
Supplier-specific data is the most accurate option. It means collecting product carbon footprints (PCFs) or facility-level emissions straight from suppliers. This method fits best for strategic, high-impact partners, but it takes time and supplier capability to get right. Today, only about 25% of companies use supplier-specific methods for purchased goods and services. [1]
Activity-based data sits in the middle. You collect physical activity metrics - kWh of electricity for energy-intensive products, ton-miles for domestic freight, gallons of fuel for transport - and multiply them by emission factors from EPA or DEFRA sources. This is a good fit for logistics and manufacturing categories where shipment or energy records are solid, even if a full PCF is out of reach. Use consistent U.S. units and number formats, such as 1,250,000 ton-miles and $250,000.00.
Spend-based estimates rely on financial records - USD spend in a category - multiplied by EPA's USEEIO-based supply chain emission factors, expressed as kg CO₂e per dollar spent. This is the fastest method. It works well for early screening, tail spend, and lower-impact service categories. Just as important, it gives you a defensible baseline while you work toward more primary data.
Assign one method to each category, then move your highest-impact areas up the ladder first. Once the method is chosen, turn it into the exact fields each supplier needs to submit.
Run Supplier Outreach and Data Requests
After methods are assigned, start outreach with the highest-impact tier 1 suppliers. A two-wave approach keeps the process focused without overwhelming the team.
Wave 1 should focus on tier 1 suppliers tied to the highest-impact categories. These suppliers need direct engagement, such as meetings, shared templates, and sometimes site visits.
Wave 2 should cover the rest of the supply base through standard questionnaires and portal submissions.
For each supplier request, spell out the required fields with no guesswork: reporting period, base year, boundary, emissions in metric tons of CO₂e, activity data and units, methodology, emission-factor sources, and third-party verification status.
It also helps to build these requirements into contracts and RFP templates. That step can improve response rates because it moves climate reporting from a nice-to-have into a stated expectation. Right now, only 13% of companies include climate-related requirements in supplier contracts, and fewer than 6% include enforcement mechanisms. [5] Tying data reporting to preferred supplier status or incentives adds one more reason to respond.
When suppliers do not respond, use spend-based proxies or industry-average factors. Mark them as low-confidence placeholders and flag them for follow-up in the next reporting cycle.
Method Comparison Table: Supplier-Specific, Activity-Based, and Spend-Based Approaches
Use the table below to match method, effort, and data needs to each category.
Method | Accuracy | Effort | Data Requirements | Best Use Case |
|---|---|---|---|---|
Supplier-Specific | High | High | Primary data (PCFs, allocated facility emissions) | Strategic partners; high-impact hotspot categories; tracking reduction targets |
Activity-Based | Medium to High | Medium | Physical units (kWh, miles, ton-miles, gallons) | Freight and logistics; energy-intensive manufacturing; transport fuels |
Spend-Based | Low | Low | Financial records (USD spend) with EEIO or DEFRA factors | Initial screening; tail spend; low-impact services; early-stage inventories |
Use this table to assign methods by category. Start with the data you can get now, then move your most material categories to higher-accuracy methods year by year.
Check Data Quality and Build a Reporting Workflow
For the categories and suppliers you already ranked as most important, the next job is simple in theory and messy in practice: turn raw data into an inventory that can stand up to review.
Validate Completeness, Consistency, and Credibility
Start by cross-checking supplier activity data against finance records, purchase volumes, and logistics data. If a supplier reports fuel use or material weight that doesn’t match what your internal records suggest, pause and dig into the gap before disclosure.
At this stage, three checks carry the most weight:
Unit and timeframe alignment: Bring all data into one fiscal year and one shared unit set before you apply emission factors.
Emission factor verification: Check that factors are current and fit the right region. Sources such as EPA, DEFRA, or Ecoinvent may fit, depending on the geography and activity.
Outlier screening: Flag emissions intensity numbers that sit well outside prior-year results or benchmark ranges.
For material categories, run a sensitivity analysis. In plain terms, test how much the total inventory moves when a key assumption or emission factor changes. That gives you a clearer read on uncertainty in the final number.
Document assumptions, data gaps, and proxies so a verifier can review them without playing detective.
Design the Inventory, Review, and Disclosure Process
Once validation is done, move the data through one clear workflow: intake, category calculations, review, and disclosure. Each step needs one owner. No gray area, no finger-pointing later.
Procurement should reconcile supplier submissions with purchase and logistics records. Sustainability should check methodology and emission factor choices against the GHG Protocol Scope 3 Standard. Finance should confirm that spend data matches the general ledger and flag variances. Only after those reviews should the data move into disclosure.
After sign-off, lock the files. If a methodology change or acquisition shifts the baseline by more than 5–10% [6], apply a recalculation policy. Also log any changes made after review, along with the reason. That paper trail matters.
Data Quality Checklist: Checks and Internal Owners
Check | What to Look For | Internal Owner |
|---|---|---|
Unit Consistency | All inputs converted to required reporting units such as metric tons or kWh | Sustainability / Procurement |
Emission Factor Source | Factors are current, version-controlled, and region-appropriate | Sustainability |
Boundary Coverage | Prioritized categories and suppliers are included; gaps are documented | Sustainability |
Outlier Threshold | Emissions intensity figures are checked against benchmarks and prior-year data; outliers are flagged | Finance / Sustainability |
Spend Alignment | Activity data is cross-referenced against spend and purchase volumes from finance records | Finance |
Version Lock | Final data sets are locked after sign-off; log any post-review changes and why | IT / Sustainability |
Assign each check to a named owner before the reporting cycle opens. If you wait until data starts coming in, small issues have a way of turning into reporting problems fast.
Conclusion: How to Improve Scope 3 Tracking Year Over Year
The goal isn’t to get perfect data on the first pass. It’s to get better with each reporting cycle. Scope 3 tracking gets stronger through repeatable work: better category ranking, better supplier mapping, better data, and better review.
The big shift is moving from proxies to supplier-specific data. A practical path is to begin with screening and a base year, then bring in primary data for the highest-impact categories, and after that expand coverage and assurance. Upstream Scope 3 emissions average 26 times higher than direct Scopes 1 and 2 emissions [1][7], which makes this shift one of the highest-leverage moves a supply chain team can make.
Once data quality improves, the next step is putting that data to work in procurement. Data should shape decisions, not sit in a disclosure file. Scope 3 data only matters when procurement uses it in bids, scorecards, and contract terms.
Each cycle should make the next one faster, more accurate, and more useful.
FAQs
Where should we start with Scope 3 data?
Start by mapping your value chain across the 15 GHG Protocol categories. The easiest place to begin is with the data you already have: financial records and procurement data. Those records give you a practical backbone for early analysis, especially when perfect emissions data isn’t on hand yet. Use spend-based estimates to build a baseline that’s directionally correct, then use that first pass to spot the biggest emissions hotspots.
Once that baseline is in place, tighten your focus. Put detailed measurement on the 3 to 5 material categories that account for 80 to 90 percent of your footprint. In parallel, prioritize your top 20 to 100 suppliers based on emissions exposure. That way, you’re not trying to boil the ocean - you’re spending time where the numbers are biggest and where action is most likely to matter.
How do we choose between supplier, activity, and spend data?
Choose based on reporting maturity, balancing accuracy with what your team can actually deliver.
Start with spend-based data to screen categories and find the biggest emissions hotspots. It’s the fastest way to get a rough picture, especially early on. Then move to activity-based and supplier-specific data for the categories that matter most, with the deepest supplier data focused on strategic suppliers.
Over time, replace spend-based estimates with primary data through an iterative improvement roadmap. That approach keeps the work practical while improving data quality where it has the most impact.
How often should we update our Scope 3 inventory?
Annual updates are the right baseline for a Scope 3 inventory. They make it easier to track trends, measure progress against targets, and spot emissions drivers before they slip under the radar. They also line up with common reporting expectations, which helps keep your process in step with what stakeholders tend to expect.
Your value chain map should work the same way: as a living document, not a one-and-done file. Update it when supplier relationships shift or when new risk information comes in. A recurring reporting calendar also helps keep data collection, validation, and review steady from one cycle to the next.
Related Blog Posts
Latest Articles
©2025
Narrative Change and Power Building: The Missing Half of Advocacy
Narrative change is the process of disrupting dominant narratives that normalize inequity and advancing new narratives from historically marginalized communities.
Funding Resilience Without Federal Grants
BRIC is unreliable and FEMA is shrinking. Here's how cities fund climate resilience with dedicated revenue, blended finance, and a coordinating authority.
The ESG Blind Spot: How AI Is Finding Risks in Companies Nobody Else Is Watching
Norway's sovereign wealth fund uses AI to screen 7,200 portfolio companies for forced labor and corruption within 24 hours. The real story is the emerging-market coverage gap that traditional ESG data vendors miss — and what it means for any company with a global supply chain.
FAQ
What does it really mean to “redefine profit”?
What makes Council Fire different?
Who does Council Fire work with?
What does working with Council Fire actually look like?
How does Council Fire help organizations turn big goals into action?
How does Council Fire define and measure success?