
Sep 7, 2026
Impact Frameworks: SDGs vs IRIS+ vs GRI
ESG Strategy
In This Article
Use SDGs for direction, IRIS+ for measurable metrics, and GRI for public reporting—align strategy, measurement, and disclosure.
Impact Frameworks: SDGs vs IRIS+ vs GRI
If your goals, metrics, and reports do not connect, your impact work will not hold up. I see these three frameworks as a simple stack: SDGs set the goal, IRIS+ tracks the data, and GRI turns that data into public reporting.
Here’s the short version:
SDGs help me decide what change I want to support
IRIS+ helps me decide what to measure
GRI helps me decide what to disclose
A few facts make this easier to place:
The SDGs include 17 goals and 169 targets
About 83% of the IRIS+ Catalog of Metrics links to SDG targets
GRI was used by 71% of reporting companies in KPMG’s 2024 survey, including 77% of the G250
If I use only one of these, I get only part of the job done. SDGs give direction but not project metrics. IRIS+ gives metrics but not a public report format. GRI gives a report structure but depends on data from somewhere else.
The best way to use them is in order:
Pick the SDG goals and targets that match my work
Choose IRIS+ metrics for outputs and outcomes
Use GRI to report the results to outside audiences
Quick Comparison
Framework | Main Job | Best For | Level of Detail | Main Users |
|---|---|---|---|---|
SDGs | Goal setting | Setting direction | Broad | Governments, nonprofits, companies, funders |
IRIS+ | Impact measurement | Tracking results | Detailed | Impact investors, enterprises, intermediaries |
GRI | Public disclosure | External reporting | Moderate to detailed | Investors, regulators, employees, civil society |
In short, I would not treat these as competing options. They do different jobs. The article shows how to use them as one system so the same data can move from planning to measurement to reporting without extra rework.
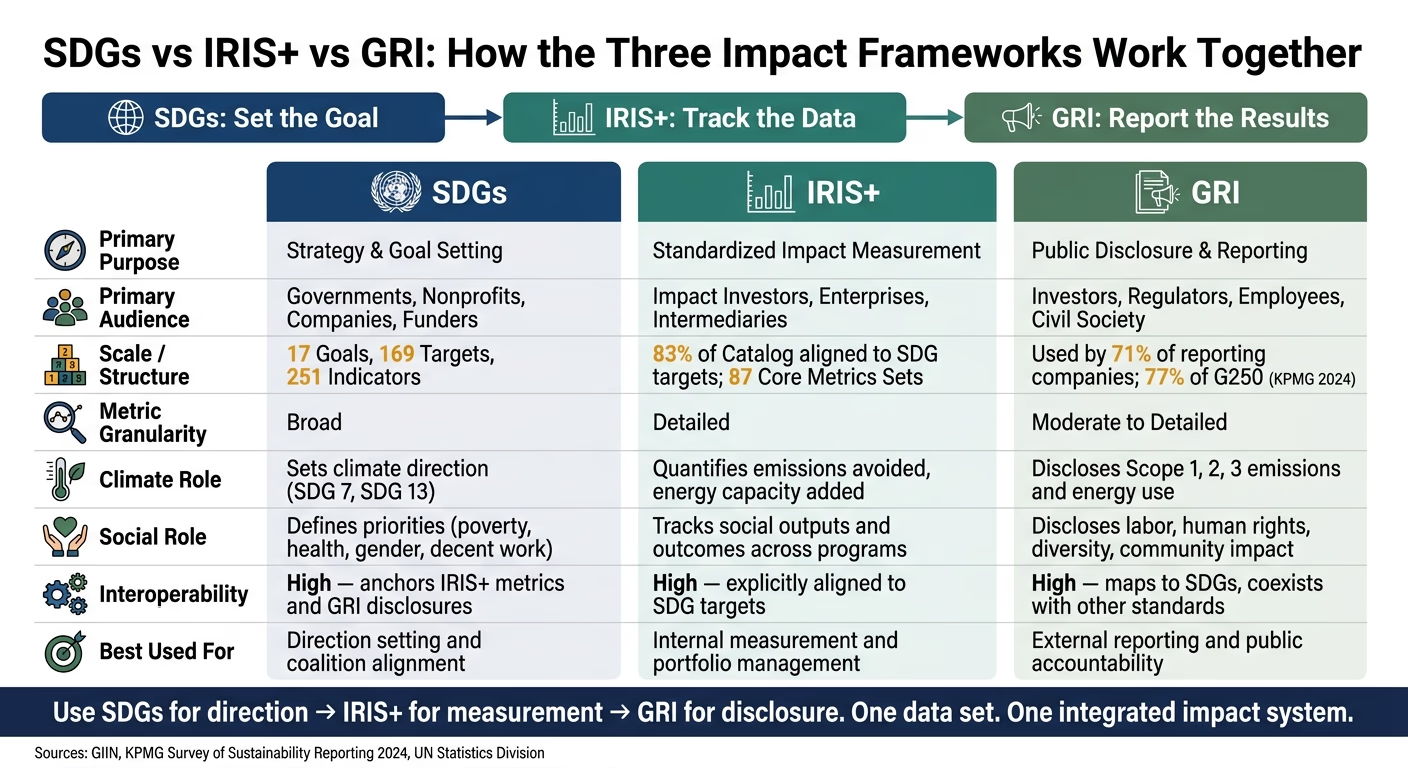
SDGs vs IRIS+ vs GRI: Impact Framework Comparison Guide
One Data Dictionary, Every Impact Framework: IRIS+, SDG & ESRS Without the Rebuild
SDGs: A Global Goals Framework for Setting Direction
The UN Sustainable Development Goals sit at the top of an impact architecture. They include 17 goals, 169 targets, and 251 indicators adopted by 191 UN Member States under the 2030 Agenda.[14][11] Those indicators are maintained by the UN Statistics Division and built for national and global tracking, not for showing what one program or one investment delivered.[9][11] Put simply, the SDGs are the strategy layer, not the measurement layer.
Purpose, Audience, and Structure
The SDGs help organizations set direction, not measure project results. They push two basic questions to the front: What change do we want to support? And who should benefit most? Their structure - Goals → Targets → Indicators - gives teams a clear way to connect a program or portfolio to a global priority, whether that is SDG 7 (Affordable and Clean Energy), SDG 13 (Climate Action), or SDG 11 (Sustainable Cities and Communities).
In the U.S., that shows up in a few familiar ways:
Public agencies use the SDGs to line up climate and infrastructure work.
Foundations use them to frame grantmaking.
Corporations use them to anchor sustainability narratives.
Coalitions often point to SDG 17 to support partnership efforts.
Because the SDGs are not legally binding, they work as a shared reference point rather than a compliance standard.[10] That matters in coalition work. Different partners may have different mandates, budgets, or timelines, but they can still line up around the same goals.
Where SDGs Help and Where They Fall Short
The SDGs are strong at the big-picture level, and that is also where their limits show. Most SDG indicators roll up outcomes across entire populations - national poverty rates, total disaster casualties, or greenhouse gas inventories - so they cannot show the direct contribution of a single organization.[12][13] Only a small portion of SDG indicators can be used at the project level, especially in infrastructure.[13]
That is why most organizations need another layer below SDG alignment. A program may support climate action or resilient infrastructure, but it still needs project-level measures like kWh saved, emissions reduced, or households reached.[13] The smart move is to map only the goals and targets tied to material outcomes. If you tag everything to the SDGs, focus starts to slip and measurement gets weaker. That gap is where a metric system like IRIS+ comes in.
IRIS+: A Standardized System for Impact Measurement
IRIS+ is the measurement layer beneath SDG strategy. Developed and maintained by GIIN, IRIS+ turns broad impact goals into standardized, comparable indicators. It doesn’t replace strategic goals. It makes them measurable. Those metrics can then flow into reporting systems like GRI.
Metric Depth, Core Metrics Sets, and SDG Alignment
IRIS+ works through two layers: the IRIS Catalog of Metrics and Core Metrics Sets. Think of the catalog as the full library, while Core Metrics Sets act more like ready-made bundles for common impact themes. That setup lets organizations pick the right indicators without building a measurement system from the ground up.
GIIN reports that 83% of the IRIS Catalog aligns with SDG targets, based on a review of all 169 SDG targets. In total, 78 SDG targets align with a set of IRIS metrics, and 87 Core Metrics Sets align to the SDGs at the goal level [1][2]. In practice, that means an organization running a clean energy program can choose IRIS+ metrics and quickly see which SDG goals and targets those metrics support.
Just as important, every Core Metrics Set includes metrics for Importance of Outcome to Stakeholder and Stakeholder Engagement. That keeps measurement tied to a simple but often missed point: does the outcome matter to the people it is meant to serve? [15]
How IRIS+ Supports Climate and Social Tracking
IRIS+ groups its metrics around impact themes such as climate, clean energy, water, health, livelihoods, and equity. That makes metric selection much easier. Teams don’t have to sort through the full catalog every time they launch a new program.
For climate work, this means tracking outputs like greenhouse gas emissions avoided, renewable energy capacity added, or energy efficiency gains rather than stopping at whether a climate initiative exists. For social programs, it means going past headcounts and looking at outcomes such as income stabilization, access to services, enrollment retention, or jobs supported.
That common structure helps avoid mismatched definitions across teams, partners, and grantees. It also gives organizations cleaner inputs for GRI disclosure.
GRI: A Disclosure Standard for Sustainability Reporting
If IRIS+ is about measuring performance, GRI is about turning that information into public disclosure. It takes sustainability data and puts it in front of investors, regulators, boards, employees, customers, civil society, and affected communities. In plain terms, GRI standardizes reporting; it does not manage impact.
GRI is the most widely used sustainability reporting standard in the world. In the 2024 KPMG survey, 71% of reporting companies used it, including 77% of the G250.[8]
GRI works best when the disclosures come from an SDG-aligned strategy and IRIS+-based measurement. That sequence matters. First, an organization decides what it is trying to change. Then it measures progress. After that, GRI helps present the results in a format outside audiences can review.
Audience, Disclosure Structure, and Reporting Role
GRI is built for a multi-stakeholder audience. It gives organizations a shared language for reporting environmental, social, and economic impacts across sectors and company types.[3][6]
Its structure is modular:
Universal Standards apply to all organizations.
Sector Standards deal with industry-specific issues.
Topic Standards cover economic (200), environmental (300), and social (400) disclosures.[16][19]
GRI does not invent new metrics. Instead, it organizes existing data into a public-facing report.[5][22] That may sound simple, but it matters. A company can have plenty of internal data and still struggle to explain itself in a way outsiders can follow. GRI fills that gap.
How GRI Supports Public Accountability on Climate and Social Performance
On climate, GRI's 300-series Standards call for Scope 1, Scope 2, and often Scope 3 emissions, along with energy use, efficiency, and climate-risk disclosure.[16][19][20] That gives investors and communities a consistent basis for review. Without a shared format, one company's climate report can look nothing like another's, which makes side-by-side judgment much harder.
On social performance, GRI's 400-series Standards cover labor, health and safety, human rights, diversity, and community impact.[16][19] For U.S. organizations, safety data often lines up with OSHA definitions, while diversity disclosures reflect gender and race/ethnicity breakdowns where legally permitted. The result is a record of actual social performance, not just policy language or polished promises.[16][19][20]
One idea sits at the center of all this: impact materiality. Under GRI, materiality asks which issues most affect people, the environment, and the organization's ability to report them, not only which issues matter in financial terms.[17][18][21] That inside-out view is what makes GRI reports useful for public accountability.[3][20]
Those differences matter when comparing GRI with SDGs and IRIS+.
SDGs vs IRIS+ vs GRI: Key Differences, Compatibility, and Practical Use
Taken together, these frameworks work best as a stack: SDGs set the direction, IRIS+ tracks progress, and GRI shares results with the outside world.
The table below shows where each framework fits and how they connect.
Framework | Primary Purpose | Primary Audience | Metric Granularity | Reporting Use | Social Impact Role | Climate Impact Role | Interoperability |
|---|---|---|---|---|---|---|---|
SDGs | Strategy setting | Governments, companies, nonprofits, investors, and civil society | Broad - 17 goals and 169 targets[11] | Strategy setting | Defines social priorities such as poverty, health, gender, and decent work | Sets climate direction through goals related to climate action, energy, and responsible consumption | High - can anchor IRIS+ metrics and GRI disclosures |
IRIS+ | Standardized impact measurement | Impact investors, enterprises, and intermediaries | Detailed - Core Metrics Sets and standardized metrics | Internal measurement and portfolio management | Tracks specific social outputs and outcomes across programs | Quantifies climate responses with comparable environmental metrics | High - explicitly aligned to SDG targets |
GRI | Public reporting | Broad stakeholder audience, including investors, employees, regulators, and civil society | Moderate to detailed - Universal, Sector, and Topic Standards | Primary external reporting vehicle | Discloses labor, human rights, diversity, and community impacts | Discloses environmental and climate-related impacts | High - maps to SDGs and coexists with other standards |
When to Use Each Framework on Its Own
Use SDGs for strategy and alignment, not for measurement. They help teams decide what matters most, but they do not give you the detailed indicators needed to track day-to-day performance.
Use IRIS+ when you need standardized metrics across programs, regions, or portfolios. If you're comparing results across multiple investments or operating units, IRIS+ gives you a common yardstick.
Use GRI when formal public disclosure is the main goal, especially when investors, regulators, employees, or civil society expect a structured sustainability report. This is the framework built for outward-facing communication.
How to Combine All Three in One Impact Architecture
The practical flow is simple: set SDG-aligned goals, choose IRIS+ metrics, then report through GRI.[1][4][7] In plain terms, start with the why, move to the how you'll measure it, and finish with the how you'll report it.
That approach also keeps teams from building three separate systems for the same work. One data set can support internal management and external disclosure at the same time. That's often the difference between a clean reporting process and a mess of duplicate spreadsheets.
Conclusion: Choose the Right Anchor Point, Then Connect the System
SDGs, IRIS+, and GRI are compatible layers, not competing choices. Each supports the next. Clear SDG goals make IRIS+ metric selection easier, and solid IRIS+ data makes GRI disclosures easier to stand behind.
Use SDGs for direction, IRIS+ for measurement, and GRI for disclosure. Used together, they create one impact system with a clear flow from goals to metrics to reporting.
FAQs
How do I start with these frameworks?
Start with a materiality assessment. It helps you pinpoint the impacts that matter most across the economy, the environment, and people, so you’re not trying to measure everything at once.
If you’re starting from scratch, GRI gives you a solid place to begin. Use its materiality process to map your impacts, then bring in IRIS+ for more specific outcome measurement or investor-focused metrics as your program grows. Just as important, build a unified data infrastructure early. That makes reporting more efficient and a lot easier to scale as demands increase.
Can small organizations use all three?
Yes. Small organizations can use the SDGs, IRIS+, and GRI together because each one does a different job.
The SDGs set the big-picture goals. GRI helps with broad organizational reporting and communication with stakeholders. IRIS+ gives you standard metrics to track how your work connects to specific SDG targets.
How do I map IRIS+ metrics to GRI disclosures?
Use GRI as your main framework for broad sustainability disclosures and stakeholder-focused materiality, and use IRIS+ for standardized, outcome-focused impact metrics.
Start with the material topics identified through the GRI 3 materiality process, then choose IRIS+ metrics that match those impacts. In practice, IRIS+ adds the detailed measurement layer that supports GRI reporting.
Related Blog Posts
Latest Articles
©2026

Narrative Change and Power Building: The Missing Half of Advocacy
Narrative change is the process of disrupting dominant narratives that normalize inequity and advancing new narratives from historically marginalized communities.

Funding Resilience Without Federal Grants
BRIC is unreliable and FEMA is shrinking. Here's how cities fund climate resilience with dedicated revenue, blended finance, and a coordinating authority.

The ESG Blind Spot: How AI Is Finding Risks in Companies Nobody Else Is Watching
Norway's sovereign wealth fund uses AI to screen 7,200 portfolio companies for forced labor and corruption within 24 hours. The real story is the emerging-market coverage gap that traditional ESG data vendors miss — and what it means for any company with a global supply chain.
Narrative Change and Power Building: The Missing Half of Advocacy
Narrative change is the process of disrupting dominant narratives that normalize inequity and advancing new narratives from historically marginalized communities.
Funding Resilience Without Federal Grants
BRIC is unreliable and FEMA is shrinking. Here's how cities fund climate resilience with dedicated revenue, blended finance, and a coordinating authority.
The ESG Blind Spot: How AI Is Finding Risks in Companies Nobody Else Is Watching
Norway's sovereign wealth fund uses AI to screen 7,200 portfolio companies for forced labor and corruption within 24 hours. The real story is the emerging-market coverage gap that traditional ESG data vendors miss — and what it means for any company with a global supply chain.
FAQ
01
What does it really mean to “redefine profit”?
02
What makes Council Fire different?
03
Who does Council Fire work with?
04
What does working with Council Fire actually look like?
05
How does Council Fire help organizations turn big goals into action?
06
How does Council Fire define and measure success?
07
How does technology fit into Council Fire’s work?
Sep 7, 2026
Impact Frameworks: SDGs vs IRIS+ vs GRI
ESG Strategy
In This Article
Use SDGs for direction, IRIS+ for measurable metrics, and GRI for public reporting—align strategy, measurement, and disclosure.
Impact Frameworks: SDGs vs IRIS+ vs GRI
If your goals, metrics, and reports do not connect, your impact work will not hold up. I see these three frameworks as a simple stack: SDGs set the goal, IRIS+ tracks the data, and GRI turns that data into public reporting.
Here’s the short version:
SDGs help me decide what change I want to support
IRIS+ helps me decide what to measure
GRI helps me decide what to disclose
A few facts make this easier to place:
The SDGs include 17 goals and 169 targets
About 83% of the IRIS+ Catalog of Metrics links to SDG targets
GRI was used by 71% of reporting companies in KPMG’s 2024 survey, including 77% of the G250
If I use only one of these, I get only part of the job done. SDGs give direction but not project metrics. IRIS+ gives metrics but not a public report format. GRI gives a report structure but depends on data from somewhere else.
The best way to use them is in order:
Pick the SDG goals and targets that match my work
Choose IRIS+ metrics for outputs and outcomes
Use GRI to report the results to outside audiences
Quick Comparison
Framework | Main Job | Best For | Level of Detail | Main Users |
|---|---|---|---|---|
SDGs | Goal setting | Setting direction | Broad | Governments, nonprofits, companies, funders |
IRIS+ | Impact measurement | Tracking results | Detailed | Impact investors, enterprises, intermediaries |
GRI | Public disclosure | External reporting | Moderate to detailed | Investors, regulators, employees, civil society |
In short, I would not treat these as competing options. They do different jobs. The article shows how to use them as one system so the same data can move from planning to measurement to reporting without extra rework.
SDGs vs IRIS+ vs GRI: Impact Framework Comparison Guide
One Data Dictionary, Every Impact Framework: IRIS+, SDG & ESRS Without the Rebuild
SDGs: A Global Goals Framework for Setting Direction
The UN Sustainable Development Goals sit at the top of an impact architecture. They include 17 goals, 169 targets, and 251 indicators adopted by 191 UN Member States under the 2030 Agenda.[14][11] Those indicators are maintained by the UN Statistics Division and built for national and global tracking, not for showing what one program or one investment delivered.[9][11] Put simply, the SDGs are the strategy layer, not the measurement layer.
Purpose, Audience, and Structure
The SDGs help organizations set direction, not measure project results. They push two basic questions to the front: What change do we want to support? And who should benefit most? Their structure - Goals → Targets → Indicators - gives teams a clear way to connect a program or portfolio to a global priority, whether that is SDG 7 (Affordable and Clean Energy), SDG 13 (Climate Action), or SDG 11 (Sustainable Cities and Communities).
In the U.S., that shows up in a few familiar ways:
Public agencies use the SDGs to line up climate and infrastructure work.
Foundations use them to frame grantmaking.
Corporations use them to anchor sustainability narratives.
Coalitions often point to SDG 17 to support partnership efforts.
Because the SDGs are not legally binding, they work as a shared reference point rather than a compliance standard.[10] That matters in coalition work. Different partners may have different mandates, budgets, or timelines, but they can still line up around the same goals.
Where SDGs Help and Where They Fall Short
The SDGs are strong at the big-picture level, and that is also where their limits show. Most SDG indicators roll up outcomes across entire populations - national poverty rates, total disaster casualties, or greenhouse gas inventories - so they cannot show the direct contribution of a single organization.[12][13] Only a small portion of SDG indicators can be used at the project level, especially in infrastructure.[13]
That is why most organizations need another layer below SDG alignment. A program may support climate action or resilient infrastructure, but it still needs project-level measures like kWh saved, emissions reduced, or households reached.[13] The smart move is to map only the goals and targets tied to material outcomes. If you tag everything to the SDGs, focus starts to slip and measurement gets weaker. That gap is where a metric system like IRIS+ comes in.
IRIS+: A Standardized System for Impact Measurement
IRIS+ is the measurement layer beneath SDG strategy. Developed and maintained by GIIN, IRIS+ turns broad impact goals into standardized, comparable indicators. It doesn’t replace strategic goals. It makes them measurable. Those metrics can then flow into reporting systems like GRI.
Metric Depth, Core Metrics Sets, and SDG Alignment
IRIS+ works through two layers: the IRIS Catalog of Metrics and Core Metrics Sets. Think of the catalog as the full library, while Core Metrics Sets act more like ready-made bundles for common impact themes. That setup lets organizations pick the right indicators without building a measurement system from the ground up.
GIIN reports that 83% of the IRIS Catalog aligns with SDG targets, based on a review of all 169 SDG targets. In total, 78 SDG targets align with a set of IRIS metrics, and 87 Core Metrics Sets align to the SDGs at the goal level [1][2]. In practice, that means an organization running a clean energy program can choose IRIS+ metrics and quickly see which SDG goals and targets those metrics support.
Just as important, every Core Metrics Set includes metrics for Importance of Outcome to Stakeholder and Stakeholder Engagement. That keeps measurement tied to a simple but often missed point: does the outcome matter to the people it is meant to serve? [15]
How IRIS+ Supports Climate and Social Tracking
IRIS+ groups its metrics around impact themes such as climate, clean energy, water, health, livelihoods, and equity. That makes metric selection much easier. Teams don’t have to sort through the full catalog every time they launch a new program.
For climate work, this means tracking outputs like greenhouse gas emissions avoided, renewable energy capacity added, or energy efficiency gains rather than stopping at whether a climate initiative exists. For social programs, it means going past headcounts and looking at outcomes such as income stabilization, access to services, enrollment retention, or jobs supported.
That common structure helps avoid mismatched definitions across teams, partners, and grantees. It also gives organizations cleaner inputs for GRI disclosure.
GRI: A Disclosure Standard for Sustainability Reporting
If IRIS+ is about measuring performance, GRI is about turning that information into public disclosure. It takes sustainability data and puts it in front of investors, regulators, boards, employees, customers, civil society, and affected communities. In plain terms, GRI standardizes reporting; it does not manage impact.
GRI is the most widely used sustainability reporting standard in the world. In the 2024 KPMG survey, 71% of reporting companies used it, including 77% of the G250.[8]
GRI works best when the disclosures come from an SDG-aligned strategy and IRIS+-based measurement. That sequence matters. First, an organization decides what it is trying to change. Then it measures progress. After that, GRI helps present the results in a format outside audiences can review.
Audience, Disclosure Structure, and Reporting Role
GRI is built for a multi-stakeholder audience. It gives organizations a shared language for reporting environmental, social, and economic impacts across sectors and company types.[3][6]
Its structure is modular:
Universal Standards apply to all organizations.
Sector Standards deal with industry-specific issues.
Topic Standards cover economic (200), environmental (300), and social (400) disclosures.[16][19]
GRI does not invent new metrics. Instead, it organizes existing data into a public-facing report.[5][22] That may sound simple, but it matters. A company can have plenty of internal data and still struggle to explain itself in a way outsiders can follow. GRI fills that gap.
How GRI Supports Public Accountability on Climate and Social Performance
On climate, GRI's 300-series Standards call for Scope 1, Scope 2, and often Scope 3 emissions, along with energy use, efficiency, and climate-risk disclosure.[16][19][20] That gives investors and communities a consistent basis for review. Without a shared format, one company's climate report can look nothing like another's, which makes side-by-side judgment much harder.
On social performance, GRI's 400-series Standards cover labor, health and safety, human rights, diversity, and community impact.[16][19] For U.S. organizations, safety data often lines up with OSHA definitions, while diversity disclosures reflect gender and race/ethnicity breakdowns where legally permitted. The result is a record of actual social performance, not just policy language or polished promises.[16][19][20]
One idea sits at the center of all this: impact materiality. Under GRI, materiality asks which issues most affect people, the environment, and the organization's ability to report them, not only which issues matter in financial terms.[17][18][21] That inside-out view is what makes GRI reports useful for public accountability.[3][20]
Those differences matter when comparing GRI with SDGs and IRIS+.
SDGs vs IRIS+ vs GRI: Key Differences, Compatibility, and Practical Use
Taken together, these frameworks work best as a stack: SDGs set the direction, IRIS+ tracks progress, and GRI shares results with the outside world.
The table below shows where each framework fits and how they connect.
Framework | Primary Purpose | Primary Audience | Metric Granularity | Reporting Use | Social Impact Role | Climate Impact Role | Interoperability |
|---|---|---|---|---|---|---|---|
SDGs | Strategy setting | Governments, companies, nonprofits, investors, and civil society | Broad - 17 goals and 169 targets[11] | Strategy setting | Defines social priorities such as poverty, health, gender, and decent work | Sets climate direction through goals related to climate action, energy, and responsible consumption | High - can anchor IRIS+ metrics and GRI disclosures |
IRIS+ | Standardized impact measurement | Impact investors, enterprises, and intermediaries | Detailed - Core Metrics Sets and standardized metrics | Internal measurement and portfolio management | Tracks specific social outputs and outcomes across programs | Quantifies climate responses with comparable environmental metrics | High - explicitly aligned to SDG targets |
GRI | Public reporting | Broad stakeholder audience, including investors, employees, regulators, and civil society | Moderate to detailed - Universal, Sector, and Topic Standards | Primary external reporting vehicle | Discloses labor, human rights, diversity, and community impacts | Discloses environmental and climate-related impacts | High - maps to SDGs and coexists with other standards |
When to Use Each Framework on Its Own
Use SDGs for strategy and alignment, not for measurement. They help teams decide what matters most, but they do not give you the detailed indicators needed to track day-to-day performance.
Use IRIS+ when you need standardized metrics across programs, regions, or portfolios. If you're comparing results across multiple investments or operating units, IRIS+ gives you a common yardstick.
Use GRI when formal public disclosure is the main goal, especially when investors, regulators, employees, or civil society expect a structured sustainability report. This is the framework built for outward-facing communication.
How to Combine All Three in One Impact Architecture
The practical flow is simple: set SDG-aligned goals, choose IRIS+ metrics, then report through GRI.[1][4][7] In plain terms, start with the why, move to the how you'll measure it, and finish with the how you'll report it.
That approach also keeps teams from building three separate systems for the same work. One data set can support internal management and external disclosure at the same time. That's often the difference between a clean reporting process and a mess of duplicate spreadsheets.
Conclusion: Choose the Right Anchor Point, Then Connect the System
SDGs, IRIS+, and GRI are compatible layers, not competing choices. Each supports the next. Clear SDG goals make IRIS+ metric selection easier, and solid IRIS+ data makes GRI disclosures easier to stand behind.
Use SDGs for direction, IRIS+ for measurement, and GRI for disclosure. Used together, they create one impact system with a clear flow from goals to metrics to reporting.
FAQs
How do I start with these frameworks?
Start with a materiality assessment. It helps you pinpoint the impacts that matter most across the economy, the environment, and people, so you’re not trying to measure everything at once.
If you’re starting from scratch, GRI gives you a solid place to begin. Use its materiality process to map your impacts, then bring in IRIS+ for more specific outcome measurement or investor-focused metrics as your program grows. Just as important, build a unified data infrastructure early. That makes reporting more efficient and a lot easier to scale as demands increase.
Can small organizations use all three?
Yes. Small organizations can use the SDGs, IRIS+, and GRI together because each one does a different job.
The SDGs set the big-picture goals. GRI helps with broad organizational reporting and communication with stakeholders. IRIS+ gives you standard metrics to track how your work connects to specific SDG targets.
How do I map IRIS+ metrics to GRI disclosures?
Use GRI as your main framework for broad sustainability disclosures and stakeholder-focused materiality, and use IRIS+ for standardized, outcome-focused impact metrics.
Start with the material topics identified through the GRI 3 materiality process, then choose IRIS+ metrics that match those impacts. In practice, IRIS+ adds the detailed measurement layer that supports GRI reporting.
Related Blog Posts
Latest Articles
©2026
Narrative Change and Power Building: The Missing Half of Advocacy
Narrative change is the process of disrupting dominant narratives that normalize inequity and advancing new narratives from historically marginalized communities.
Funding Resilience Without Federal Grants
BRIC is unreliable and FEMA is shrinking. Here's how cities fund climate resilience with dedicated revenue, blended finance, and a coordinating authority.
The ESG Blind Spot: How AI Is Finding Risks in Companies Nobody Else Is Watching
Norway's sovereign wealth fund uses AI to screen 7,200 portfolio companies for forced labor and corruption within 24 hours. The real story is the emerging-market coverage gap that traditional ESG data vendors miss — and what it means for any company with a global supply chain.
FAQ
What does it really mean to “redefine profit”?
What makes Council Fire different?
Who does Council Fire work with?
What does working with Council Fire actually look like?
How does Council Fire help organizations turn big goals into action?
How does Council Fire define and measure success?
How does technology fit into Council Fire’s work?