
Sep 9, 2026
Green Investment Risk Analysis: Technology Adoption
Sustainability Strategy
In This Article
How technology, market, policy and delivery risks affect cash flow, DSCR and the financeability of green projects—and lender mitigations.
Green Investment Risk Analysis: Technology Adoption
If you want to know what can kill a green project finance deal, start with cash flow. I’d boil this article down to one point: lenders care less about which risk sounds biggest and more about where it hits CFADS, DSCR, leverage, and timing.
Here’s the short version in plain English:
Technology adoption risk is about whether the asset performs as promised. It hits output, degradation, uptime, O&M, and replacement capex.
Market risk is about whether power sold earns the price the model expects. It hits merchant revenue, curtailment, and price exposure.
Policy and regulatory risk is about whether the rules, tax credits, permits, and interconnection path stay in place. It hits ITC/PTC value, compliance costs, and COD timing.
Delivery risk is about whether the project gets built on time and on budget. It hits capex, interest during construction, and revenue start date.
A few numbers show why this matters:
Solar PV degradation is often modeled around 0.5% to 1.0% per year
Offshore wind availability can sit around 90%–95%
Lender DSCR targets can range from about 1.1x to 2.0x
Merchant revenue is often capped by lenders at roughly 10%–30% of total revenue during debt tenor
A 6-month COD delay can cut equity IRR by about 80–150 basis points
For me, the key takeaway is simple: adoption risk is asset-level, market and policy risk are system-level, and delivery risk is execution-level. If output, timing, or credit support slip too far, the deal can move from financeable to stalled fast.
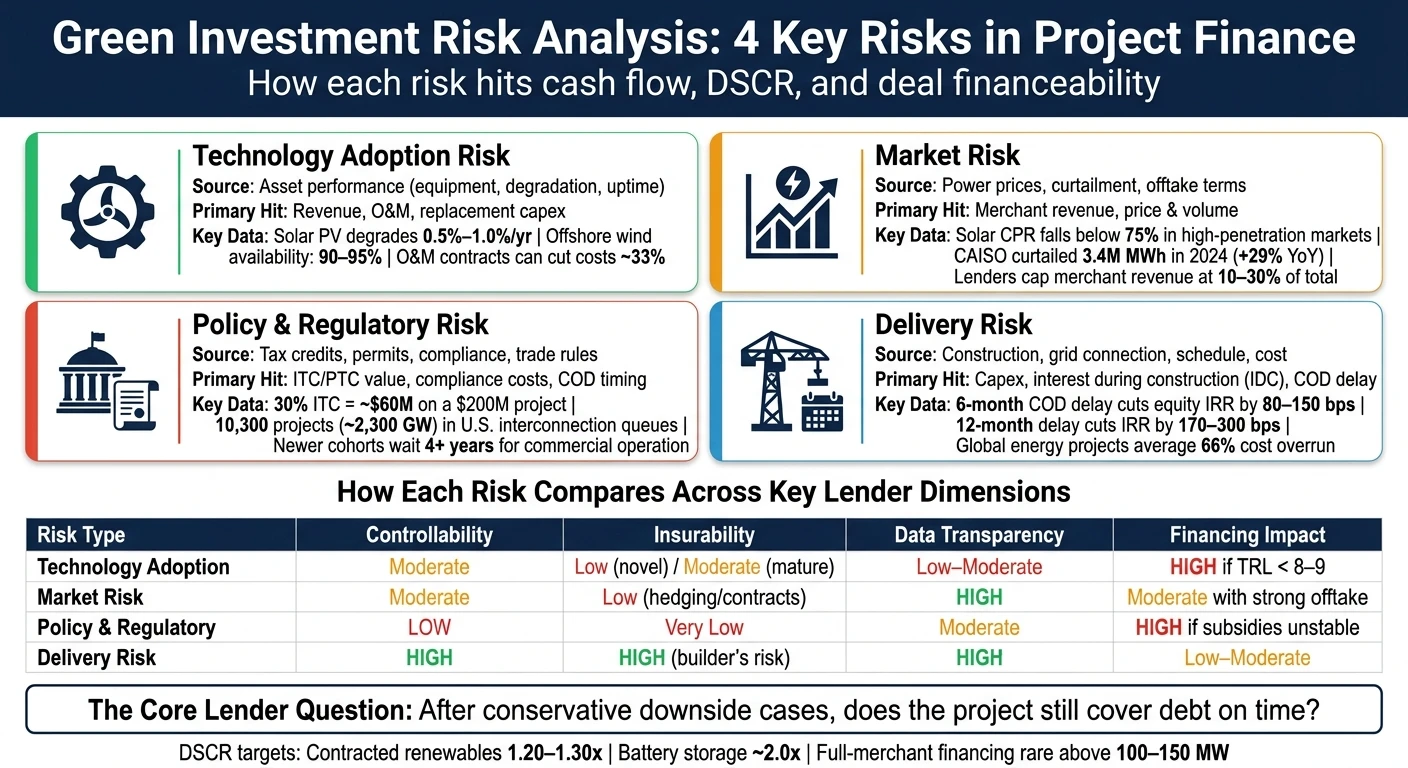
Green Investment Risk Analysis: 4 Key Risks in Project Finance
Financing the Green Transition: Risk, Capital, Banks and Investors
Quick comparison
Risk | Main source | Main hit to the model | Usual lender response |
|---|---|---|---|
Technology adoption | Asset performance | Revenue, O&M, replacement spend, ramp-up | Lower leverage, more reserves, tighter covenants |
Market | Power prices, curtailment, offtake terms | Revenue price and volume | More contracted revenue, lower merchant share |
Policy & regulatory | Tax credits, permits, compliance, trade rules | Credit value, costs, COD timing | Extra legal review, base-case downside runs |
Delivery | Construction, grid connection, schedule, cost | Capex, IDC, COD delay | Contingencies, EPC protections, delay cases |
If I were reading this for an investment screen, I’d ask one question first: after conservative downside cases, does the project still cover debt on time?
1. Technology Adoption Risk
Cash Flow Channel
Technology adoption risk usually shows up in revenue first. If equipment degrades faster than expected, goes offline without warning, or produces less power than planned, annual generation drops. When generation drops, revenue drops with it.
For solar PV, field evidence across roughly 2,000 data points points to a mean degradation rate of 0.8% per year and a median of 0.5% per year, with about 78% of observed systems degrading below 1% per year.[12] That gap matters over time. A project degrading at 1.0% per year instead of 0.5% delivers fewer total MWh across its life, and that lost output cuts the revenue attached to those MWh.
Offshore wind shows the same issue in a different form. Offshore wind farms run at 90–95% availability, compared with roughly 97% for onshore wind.[11][13] Lenders build that gap straight into their availability and yield views. In practice, these are the revenue swings they test first.
Finance Model Impact
The size of the downside matters, but so does where it lands in the model. Adoption risk flows through revenue, O&M, and replacement capex.
On the revenue side, analysts use P50/P90 energy yield curves and adjust them for higher degradation. They also run sensitivity cases, such as testing degradation at 0.5% versus 1.0% per year, to see what happens to DSCR and equity IRR.[5][3] That sounds technical, but the idea is simple: if output slips, can the project still cover debt and deliver the expected return?
O&M is another pressure point. Newer technologies tend to carry higher O&M budgets because failure modes are less clear and the labor pool is more specialized. A solid O&M contract can help a lot. Well-structured O&M contracts can reduce O&M costs by roughly 33%, which directly improves operating margins.[14]
Replacement capex can be even trickier because it does not arrive as a smooth annual cost. Battery energy storage systems, for example, may need pack replacements in years 10–12, and those have to be entered as discrete capital expenditure items in the model.[3][8] If the timing is off, or the cost is set too low, debt amortization can start to feel tight fast.
Bankability Threshold
A technology becomes bankable when lenders trust its cash flows enough to believe debt will be serviced through the loan term. At that point, adoption risk stops being just an operating concern and becomes a credit question.
This is what makes adoption risk harder to deal with than market or policy risk. It sits inside the asset itself. A lender cannot smooth that away just by backing more deals.
For conventional crystalline silicon PV, lender confidence is already in place. The sector has decades of field data, and manufacturer warranties often cap annual degradation at roughly 0.4–0.6% per year over 25 years.[10] Newer technologies, such as long-duration energy storage, face a tougher test. Lenders want independent proof of performance, including round-trip efficiency, cycle life, availability data, and safety records.[8][5]
Without that proof, the answer is often simple: pass on the deal or change the capital stack. In many cases, that means more equity and lower leverage. First-of-a-kind projects often see debt below 60% of capex, with the balance filled by more expensive equity.[15]
Mitigation Path
The clearest way to manage adoption risk is to move performance uncertainty to parties that are better able to take it on. Vendor warranties and long-term performance guarantees on output and degradation can reduce the haircuts lenders apply to base-case assumptions.[3][5] When those protections are not enough, blended finance tranches from development finance institutions or staged funding tied to performance milestones can help close the gap.[7][9][6]
There is also evidence that contract and operating design can change financing terms in a meaningful way. A PV risk framework that combines better EPC contracts, data-led O&M, and stronger production estimates has been shown to reduce debt interest rates by 1 percentage point and increase project IRR by up to 2 percentage points.[14]
That asset-level uncertainty is the core challenge here. It is why adoption risk is tougher to spread than market or policy risk.
2. Market Risk
Cash Flow Channel
If adoption risk sits inside the asset, market risk comes from outside it. A plant can perform exactly as planned and still bring in less cash than expected.
This risk cuts into revenue through price swings, softer offtake demand, price cannibalization, and curtailment. Power price volatility is the clearest path: when wholesale prices drop, energy revenue drops with them, especially for projects exposed to spot markets instead of fixed-price contracts. Weaker offtake demand can shrink contracted volumes, shorten contract terms, or force lower pricing in new agreements. That chips away at long-term revenue visibility before the project is even online.
Then there’s price cannibalization. When solar or wind output is high across the grid, market prices can fall at the same time. In plain terms, the project produces when everyone else does, and that flood of supply pushes down the price it earns. Capture Price Ratio (CPR) modeling shows solar PV CPRs of 85–97% in low-penetration grids, falling below 75% in high-penetration markets like California and Germany.[18][28]
Curtailment makes the problem worse. When transmission is congested or the grid has more supply than it can take, grid operators tell generators to stop producing. Those MWh don’t come back later. CAISO curtailed roughly 3.4 million MWh of solar and wind in 2024, a 29% increase over 2023, with solar accounting for about 93% of curtailed energy.[27][29][30] That directly cuts delivered generation and cash receipts.
Finance Model Impact
In a project finance model, market risk runs straight through the revenue waterfall. Analysts usually build P50, P75, and P90 price curves using third-party market consultant data, then stress-test the model for merchant exposure, curtailment rates, and basis risk between hub and node prices. The core question is simple: does the minimum DSCR still hold if prices fall or curtailment climbs?
The ERCOT market during Winter Storm Uri in February 2021 shows how ugly this can get when merchant exposure meets an extreme price shock. Spot prices jumped to $9,000/MWh for roughly three days, versus a more normal range of $20–$40/MWh.[20] Projects with fixed-volume hedges had to buy power at those peak prices to meet contract obligations. About one-third of projects were materially affected by hedge structures during Uri.[20]
That single event reshaped how lenders and sponsors model merchant risk in Texas and beyond.
Bankability Threshold
In most U.S. markets, senior lenders usually cap merchant revenue at about 10–30% of total project revenue during the debt tenor. The rest generally needs support from PPAs, hedges, or other contracted offtake.[16][17] Full-merchant financing is rare and is usually limited to projects of 100–150 MW, with only a small group of banks willing to step in.[16]
For contracted projects, minimum DSCRs often land in the 1.20–1.30x range. More merchant exposure tends to mean lenders want extra cushion, lower leverage, or both.
The U.S. offshore wind sector gave a clear example of what happens when contracted pricing stops working. Avangrid and Connecticut utilities terminated the Park City Wind PPA in October 2023, with Avangrid explicitly stating the project was "unfinanceable" under the existing contract.[19] Across late 2023 and into 2024, multiple East Coast offshore wind developers canceled or tried to renegotiate offtake agreements as costs rose roughly 50% and fixed-price PPAs without inflation indexing became structurally unviable.[21][22][23][24][25][26] In that case, market risk wasn’t just a downside case in Excel. It stopped deals cold.
Mitigation Path
The clearest mitigation tool is a long-term PPA with a creditworthy offtaker. It turns uncertain merchant revenue into a steadier cash flow stream and gives lenders the contracted base they need to size debt. When full PPA coverage isn’t available, sponsors often lean on:
Virtual PPAs (VPPAs)
Fixed-volume hedges
Contracts for differences
For curtailment, the practical playbook is more operational. Sponsors can choose interconnection points with lower past congestion, or pair projects with battery storage or solar-plus-storage hybrid configurations to shift delivery out of oversupplied hours. Each of these steps can improve DSCR and support higher leverage. Market risk squeezes revenue; policy risk can alter the rules behind it.
3. Policy and Regulatory Risk
Cash Flow Channel
Policy and regulatory risk doesn’t change how the asset operates. It changes whether the project keeps the incentives, permits, and approvals baked into the model. In plain terms, this is a rules problem, not an equipment problem.
In the model, policy risk shows up through credits, compliance, and COD timing, not through operating output. The first pressure point is tax credit value. A 30% Investment Tax Credit (ITC) on a $200 million solar project can support about $60 million in tax equity.[38][41] If bonus credits like domestic content, energy community, or low-income adders are denied, that value can fall fast.[32][36][42] Production Tax Credits (PTCs) face a similar issue. Since they are earned per kilowatt-hour for up to 10 years, any rule change that shortens eligibility or tightens compliance cuts straight into the revenue stack.[37][38][39]
Permitting and interconnection delays create a second cash flow path. If a project can’t start construction on time or secure a grid connection, it may miss tax-credit deadlines, carry construction interest before revenue begins, and slip outside the placed-in-service window needed to keep eligibility.[41][43] By the end of 2024, about 10,300 projects totaling roughly 2,300 GW were sitting in U.S. interconnection queues, and newer cohorts were taking more than 4 years from request to commercial operation.[44][46]
Finance Model Impact
This risk lands in the model differently than adoption risk. Analysts usually run current-law, reduced-credit, and zero-credit cases.[34][40]
Permitting and interconnection issues are often modeled through delayed COD scenarios - often with 6 to 24 months of slippage - plus higher contingencies in EPC and development cost lines, later revenue start dates, and reworked debt amortization.[43] A 2025 IRS bulletin also confirmed that certain qualified interconnection costs can count toward ITC basis, and Energy Innovation estimated that this guidance could improve project economics for roughly 26–37 GW by lowering effective connection costs.[48][49][50]
Bankability Threshold
Lenders and tax equity investors tend to draw a hard line when policy uncertainty makes cash flows too hard to underwrite. Deals often stall when credit eligibility is unclear, when IRS or Treasury guidance on prevailing wage, apprenticeship, or domestic content is still unfinished, or when foreign entity of concern (FEOC) rules put the project’s supply chain or ownership structure at risk.[32][33][34][36] Import tariffs or trade remedies can also push capex higher or tighten supply enough to break cost and schedule assumptions.[31][41]
For tax equity, investors want a clear legal path to credits under current law, backed by tax counsel opinions from teams that know this terrain well, before they commit capital.[38][39] Projects also need to show they can meet prevailing wage and domestic content rules, or still work at the base 30% ITC rate without bonus adders.[32][33] In practice, many projects need to begin construction before the deadline or be placed in service by December 31, 2027, to keep eligibility under current federal rules.[45][47]
Mitigation Path
The best mitigation starts early. Locking in construction-start milestones through safe-harbor equipment purchases or physical work tests helps protect credit eligibility.[33][34][38] Early queue entry matters too. So do conservative interconnection cost assumptions backed by utility studies, which can reduce the odds that surprise upgrade costs blow a hole in the capital budget.[41][43]
On the compliance side, sponsors should build labor and domestic content costs into base-case capex instead of treating them like optional extras.[33][36] EPC contracts should also assign compliance duties clearly, with indemnities that deal with tax recapture risk if those rules are missed.[33][35]
Policy risk narrows the financing window. Delivery risk is where schedule and cost pressure turn that uncertainty into delay.
4. Delivery Risk
Where policy risk changes the rules, delivery risk tests whether a project can still reach COD on time and on budget. In plain terms, this is execution risk: does the project hit COD when planned, within budget, and at the expected level of performance? Policy risk reshapes the playing field. Delivery risk is about whether the team can finish the job.
Cash Flow Channel
The clearest damage shows up through COD timing. Every month of delay pushes revenue farther out, keeps the construction loan in place longer, and adds to IDC. For a 100 MW solar PV project, a 6-month COD delay can lower equity IRR by about 80–150 basis points. A 12-month delay can cut it by 170–300 basis points.[61] Delays can also set off PPA liquidated damages, push a project past tax deadlines, and lock up reserves for longer than planned.[52]
Capex overruns make the hit worse. A global review of 662 energy projects found actual costs of $1.358 trillion versus a budget of $812 billion, which works out to a 66% average overrun. More than three-fifths of those projects came in above their first budget.[62] In the U.S., interconnection costs are still all over the map. A quarter of projects pay more than 10 times what the lowest-cost quartile pays for grid connection.[55]
Finance Model Impact
In the model, delivery risk appears in familiar places: delayed debt draws, higher IDC, larger EPC and balance-of-plant costs, heavier contingency use, and later revenue start dates. Teams usually run 3- to 12-month COD delay scenarios and test whether DSCR still stays above minimum levels when construction costs climb and early-year cash flow gets squeezed.[52][53]
This is where the finance model stops being a spreadsheet exercise and starts acting like a stress test. Grid connection needs its own scenario set. Median interconnection timelines have stretched to 48 months in ERCOT and 80 months in CAISO.[62] If interconnection cost is treated as a fixed input instead of a range with a high-cost case, total capex can look too low and early returns can look better than they should.
Bankability Threshold
Lenders tend to stop when downside delivery cases break core covenants. For contracted renewables, the usual minimum DSCR sits around 1.20–1.30x. If delay and capex overrun cases push coverage below that floor, the deal can stall.[52][53] Interconnection risk adds another filter. Sunk costs from canceled projects average more than $2 million per solar project and $7.5 million per wind project.[63]
Lenders usually want to see four basics in place:
an executed interconnection agreement
a creditworthy EPC contractor
delay liquidated damages sized to the risk
Mitigation Path
Most mitigation here is contractual and structural. Fixed-price, date-certain EPC contracts with delay liquidated damages (DLDs) and performance bonds shift schedule and output risk to the contractor. That gives lenders a cleaner recovery path if execution slips.[53][2] Performance guarantees should link COD output to a clear minimum threshold, with compensation or remediation if the project comes in short.[54][3]
On the grid side, early queue entry and active work with transmission operators can shorten study timelines and bring upgrade costs into view before they turn into a financing shock.[51][57] Developers can also cut interconnection exposure by co-locating storage, sizing projects to fit local grid limits, or using grid-enhancing technologies to improve the odds of getting connected on time.[55][56]
These execution risks feed straight into capex, IDC, and COD timing assumptions in the finance model.
Where Each Risk Enters the Project Finance Model
In project finance, each risk shows up in a different part of the model. Technology adoption risk affects the revenue forecast and ramp-up assumptions. Market risk hits price and volume. Policy risk changes credits and compliance. Delivery risk lands in capex and schedule.
Recent industry data puts solar PV at about a 1.25x P50 DSCR, onshore wind at 1.30–1.40x, and battery storage at about 2.0x.[65] Those gaps don’t come from one issue alone. They reflect how lenders underwrite each asset class.
When adoption risk is high, lenders don’t just shrug and move on. They usually cut forecast revenue, stretch the assumed ramp-up period, and ask for larger debt service reserve accounts - often sized to 6–12 months of debt service.[66] They may also sculpt amortization to back-load principal repayment, add milestone-based disbursement conditions, or tighten cash sweep rules so sponsor distributions stay blocked until the project reaches a steady operating profile. In plain terms, a weak ramp-up case usually leads to lower leverage, tighter covenants, and bigger reserves.
That mapping helps lenders separate operating risk from price, policy, and execution risk.
Risk Type | Where It Appears in the Model | Downside Adjustment | Financing Terms Most Affected |
|---|---|---|---|
Technology Adoption | Revenue build, ramp-up curve, stabilization timeline | Slower take-up, lower base-case cash flow, delayed stabilization | DSCR, tenor, covenant headroom, reserve sizing |
Market Risk | Price and volume assumptions, merchant revenue tranche | Demand volatility, lower realized prices | Reserve accounts, DSCR, leverage limits, spread |
Policy & Regulatory | Tax credits, permits, tariffs, and compliance | Subsidy removal, permit delays | Cost of capital, political risk guarantees, revenue projections |
Delivery Risk | Capex budget, construction schedule, interest during construction, commissioning | Cost overruns, COD delay, completion delay | Capex contingencies, completion guarantees, EPC terms |
The distinction that sponsors sometimes miss is simple: adoption risk changes the shape of cash flow, not just the total revenue figure. If adoption comes in slowly in the early years - before the project stabilizes - DSCR can drop below covenant minimums even when the long-term market case still looks solid. That’s why these model inputs matter so much. They determine whether adoption risk can be priced into the deal or turns into a deal blocker.
Those distinctions drive the trade-offs in the next section.
Technology Adoption Risk vs. Other Risks: Pros and Cons
The core issue isn’t only which risk is biggest. It’s which risk lenders can price, insure, or shape through deal structure.
Each risk category behaves differently when you look at controllability, insurability, data visibility, and the odds that it kills a deal. Technology adoption risk is the most shaped by the sponsor’s choices, policy risk is the hardest to control, and delivery risk is the easiest to handle through contracts and insurance. Those differences flow straight into revenue assumptions, capex buffers, reserve levels, and leverage.
For novel technologies, standard insurance usually does not cover core performance risk. In more mature renewable sectors, OEM warranties and performance guarantees can cover part of that gap. But for advanced battery storage, green hydrogen, or direct air capture, that protection is often limited or missing altogether.[4][1][68][69] Delivery risk is much easier to insure through builder's risk and contractor all-risk policies. Market risk and policy risk are usually handled through contracts, hedging, and political risk products rather than standard insurance.[1][67][68]
Data depth also varies by risk type. Market risk comes with stronger public data. Delivery risk has better cost and schedule benchmarks. Technology adoption risk often lacks both.[67][68][69] When lenders face that kind of fog, they usually respond the same way: lower leverage, tighter terms, and more conservative cases.
The table below shows how these risks line up against the factors lenders care about most.
Risk Type | Controllability | Insurability | Data Transparency | Financing Impact |
|---|---|---|---|---|
Technology Adoption | Moderate; highest before COD | Low for novel tech; moderate for mature tech with OEM warranties | Low to moderate; limited commercial-scale operating data | High if TRL is below 8–9 or no performance guarantee exists |
Market Risk | Moderate; PPAs and offtake contracts reduce exposure | Low; usually managed with hedging and contracts | High; public price indices, forward curves, and demand data | Moderate; often manageable with strong offtake structure |
Policy & Regulatory | Low; sponsors can only shape exposure at the margins | Very low; specialty political risk products cover only narrow scenarios | Moderate; rules are documented, but future changes are hard to predict | High if subsidy frameworks are unstable or permits are uncertain |
Delivery Risk | High; EPC contracts, liquidated damages, and contingency budgets help | High; builder's risk and contractor all-risk policies are standard | High; cost and schedule benchmarks are widely available | Low to moderate; usually leads to tighter terms, not rejection |
One pattern stands out. Delivery risk is the easiest to manage across all four dimensions. Technology adoption risk and policy risk are more likely to stop a deal cold, but for different reasons: one is tied to whether the asset will work as promised, the other to whether the rules may shift midstream.
Red Flags That Push Technology Adoption Risk to Unfinanceable
Technology adoption risk isn’t all-or-nothing. Lenders can live with some uncertainty. What tends to break financeability is a stack of issues that leaves too many open questions at once.
TRL below 8–9 and no commercial-scale operating data.[70][71]
No performance guarantee that covers the debt tenor.[64][4][67]
Commercial insurance unavailable for critical performance risks, leaving lenders exposed to output shortfalls with no insurance backstop.[4][1][68]
Economics dependent on future cost reductions rather than current demonstrated performance.[1][68][69]
Single-vendor dependency with a small or financially weak technology provider, where long-term servicing, replacement parts, and technical support are uncertain.[67][68]
Once those red flags start piling up, the risk stops looking like something lenders can model and starts looking like something they may have to walk away from.
Conclusion
The main question in U.S. green project finance isn't which risk is biggest. It's which risks can be modeled, assigned, and reduced well enough to keep a deal financeable.
That puts adoption risk at the center of underwriting for newer technologies, while market risk and policy risk tend to lead for mature assets. Each risk hits a different part of the deal. Technology adoption shapes output and ramp-up. Market risk shapes price and volume. Policy risk shapes credits and timing. Delivery risk shapes capex and COD. At the underwriting level, the issue is simple: after using conservative assumptions, does the project still clear debt service?
Adoption risk becomes bankable when modeled performance stays inside DSCR limits, key technical downsides are pushed into EPC and OEM contracts, and revenue support is strong enough to carry cautious technical assumptions. If modeled output drops below covenant coverage and no contract picks up that downside, adoption risk stops being an operating issue and turns into a financing issue.
That cushion is often narrow. In the field, policy shifts can hit even well-known technologies hard, while public credit support can help carry early-stage technical risk across the line.
For investors, the practical move is to match the risk structure to the technology's stage of maturity. With proven technologies, credit analysis should stay focused on offtake strength and policy stability. With newer technologies, investors should push for strict technical due diligence, require strong risk transfer through EPC and OEM guarantees, and put more equity into the capital stack. Put plainly, adoption risk is asset-specific, market and policy risk are system-level, and delivery risk is execution-level.
FAQs
How do lenders judge whether adoption risk is still financeable?
Lenders decide whether technology adoption risk is financeable by balancing two things: how mature and reliable a technology is, and how likely it is to shake up the market. In plain terms, they want to know whether the tech works as promised - and whether that promise can hold up under pressure.
To get there, they lean on due diligence, independent reviews, and contractual protections. That means they don’t just take a developer’s word for it. They bring in outside experts, test assumptions, and build deal terms that help protect against weak performance.
Cost matters too. Lenders look for proof that the technology can compete on price, or that government incentives lower the hurdle enough to make adoption more likely. A tax credit, grant, or other public support can change the math in a big way, especially for newer systems trying to gain ground.
If the technology is still unproven, lenders usually ask for extra backstops. These may include guarantees or other credit enhancements that help cover performance shortfalls or borrower defaults. It’s a bit like putting guardrails on a winding road: the risk may still be there, but the downside is less exposed.
When does technology adoption risk become a deal blocker?
Technology adoption risk can kill a deal when a solution hasn’t shown enough market traction or maturity to draw private capital.
It can also stall funding when performance problems threaten projected cash flows. Think equipment degradation, weak capacity factors, or systems that don’t integrate cleanly with what’s already in place. If the technology falls short of expectations, investors often step back unless guarantees or insurance help cover the risk.
Which risk matters most for DSCR: technology, market, policy, or delivery?
For DSCR, the biggest risk is usually the one with the clearest impact on revenue and cash flow stability. In infrastructure and green finance, that often means policy and contract risk matters more than technology or delivery risk.
Regulatory decisions and concession terms can change revenue directly. Technology risk still matters, but it is often reduced through performance insurance or contract guarantees.
Related Blog Posts
Latest Articles
©2026

Narrative Change and Power Building: The Missing Half of Advocacy
Narrative change is the process of disrupting dominant narratives that normalize inequity and advancing new narratives from historically marginalized communities.

Funding Resilience Without Federal Grants
BRIC is unreliable and FEMA is shrinking. Here's how cities fund climate resilience with dedicated revenue, blended finance, and a coordinating authority.

The ESG Blind Spot: How AI Is Finding Risks in Companies Nobody Else Is Watching
Norway's sovereign wealth fund uses AI to screen 7,200 portfolio companies for forced labor and corruption within 24 hours. The real story is the emerging-market coverage gap that traditional ESG data vendors miss — and what it means for any company with a global supply chain.
Narrative Change and Power Building: The Missing Half of Advocacy
Narrative change is the process of disrupting dominant narratives that normalize inequity and advancing new narratives from historically marginalized communities.
Funding Resilience Without Federal Grants
BRIC is unreliable and FEMA is shrinking. Here's how cities fund climate resilience with dedicated revenue, blended finance, and a coordinating authority.
The ESG Blind Spot: How AI Is Finding Risks in Companies Nobody Else Is Watching
Norway's sovereign wealth fund uses AI to screen 7,200 portfolio companies for forced labor and corruption within 24 hours. The real story is the emerging-market coverage gap that traditional ESG data vendors miss — and what it means for any company with a global supply chain.
FAQ
01
What does it really mean to “redefine profit”?
02
What makes Council Fire different?
03
Who does Council Fire work with?
04
What does working with Council Fire actually look like?
05
How does Council Fire help organizations turn big goals into action?
06
How does Council Fire define and measure success?
07
How does technology fit into Council Fire’s work?
Sep 9, 2026
Green Investment Risk Analysis: Technology Adoption
Sustainability Strategy
In This Article
How technology, market, policy and delivery risks affect cash flow, DSCR and the financeability of green projects—and lender mitigations.
Green Investment Risk Analysis: Technology Adoption
If you want to know what can kill a green project finance deal, start with cash flow. I’d boil this article down to one point: lenders care less about which risk sounds biggest and more about where it hits CFADS, DSCR, leverage, and timing.
Here’s the short version in plain English:
Technology adoption risk is about whether the asset performs as promised. It hits output, degradation, uptime, O&M, and replacement capex.
Market risk is about whether power sold earns the price the model expects. It hits merchant revenue, curtailment, and price exposure.
Policy and regulatory risk is about whether the rules, tax credits, permits, and interconnection path stay in place. It hits ITC/PTC value, compliance costs, and COD timing.
Delivery risk is about whether the project gets built on time and on budget. It hits capex, interest during construction, and revenue start date.
A few numbers show why this matters:
Solar PV degradation is often modeled around 0.5% to 1.0% per year
Offshore wind availability can sit around 90%–95%
Lender DSCR targets can range from about 1.1x to 2.0x
Merchant revenue is often capped by lenders at roughly 10%–30% of total revenue during debt tenor
A 6-month COD delay can cut equity IRR by about 80–150 basis points
For me, the key takeaway is simple: adoption risk is asset-level, market and policy risk are system-level, and delivery risk is execution-level. If output, timing, or credit support slip too far, the deal can move from financeable to stalled fast.
Green Investment Risk Analysis: 4 Key Risks in Project Finance
Financing the Green Transition: Risk, Capital, Banks and Investors
Quick comparison
Risk | Main source | Main hit to the model | Usual lender response |
|---|---|---|---|
Technology adoption | Asset performance | Revenue, O&M, replacement spend, ramp-up | Lower leverage, more reserves, tighter covenants |
Market | Power prices, curtailment, offtake terms | Revenue price and volume | More contracted revenue, lower merchant share |
Policy & regulatory | Tax credits, permits, compliance, trade rules | Credit value, costs, COD timing | Extra legal review, base-case downside runs |
Delivery | Construction, grid connection, schedule, cost | Capex, IDC, COD delay | Contingencies, EPC protections, delay cases |
If I were reading this for an investment screen, I’d ask one question first: after conservative downside cases, does the project still cover debt on time?
1. Technology Adoption Risk
Cash Flow Channel
Technology adoption risk usually shows up in revenue first. If equipment degrades faster than expected, goes offline without warning, or produces less power than planned, annual generation drops. When generation drops, revenue drops with it.
For solar PV, field evidence across roughly 2,000 data points points to a mean degradation rate of 0.8% per year and a median of 0.5% per year, with about 78% of observed systems degrading below 1% per year.[12] That gap matters over time. A project degrading at 1.0% per year instead of 0.5% delivers fewer total MWh across its life, and that lost output cuts the revenue attached to those MWh.
Offshore wind shows the same issue in a different form. Offshore wind farms run at 90–95% availability, compared with roughly 97% for onshore wind.[11][13] Lenders build that gap straight into their availability and yield views. In practice, these are the revenue swings they test first.
Finance Model Impact
The size of the downside matters, but so does where it lands in the model. Adoption risk flows through revenue, O&M, and replacement capex.
On the revenue side, analysts use P50/P90 energy yield curves and adjust them for higher degradation. They also run sensitivity cases, such as testing degradation at 0.5% versus 1.0% per year, to see what happens to DSCR and equity IRR.[5][3] That sounds technical, but the idea is simple: if output slips, can the project still cover debt and deliver the expected return?
O&M is another pressure point. Newer technologies tend to carry higher O&M budgets because failure modes are less clear and the labor pool is more specialized. A solid O&M contract can help a lot. Well-structured O&M contracts can reduce O&M costs by roughly 33%, which directly improves operating margins.[14]
Replacement capex can be even trickier because it does not arrive as a smooth annual cost. Battery energy storage systems, for example, may need pack replacements in years 10–12, and those have to be entered as discrete capital expenditure items in the model.[3][8] If the timing is off, or the cost is set too low, debt amortization can start to feel tight fast.
Bankability Threshold
A technology becomes bankable when lenders trust its cash flows enough to believe debt will be serviced through the loan term. At that point, adoption risk stops being just an operating concern and becomes a credit question.
This is what makes adoption risk harder to deal with than market or policy risk. It sits inside the asset itself. A lender cannot smooth that away just by backing more deals.
For conventional crystalline silicon PV, lender confidence is already in place. The sector has decades of field data, and manufacturer warranties often cap annual degradation at roughly 0.4–0.6% per year over 25 years.[10] Newer technologies, such as long-duration energy storage, face a tougher test. Lenders want independent proof of performance, including round-trip efficiency, cycle life, availability data, and safety records.[8][5]
Without that proof, the answer is often simple: pass on the deal or change the capital stack. In many cases, that means more equity and lower leverage. First-of-a-kind projects often see debt below 60% of capex, with the balance filled by more expensive equity.[15]
Mitigation Path
The clearest way to manage adoption risk is to move performance uncertainty to parties that are better able to take it on. Vendor warranties and long-term performance guarantees on output and degradation can reduce the haircuts lenders apply to base-case assumptions.[3][5] When those protections are not enough, blended finance tranches from development finance institutions or staged funding tied to performance milestones can help close the gap.[7][9][6]
There is also evidence that contract and operating design can change financing terms in a meaningful way. A PV risk framework that combines better EPC contracts, data-led O&M, and stronger production estimates has been shown to reduce debt interest rates by 1 percentage point and increase project IRR by up to 2 percentage points.[14]
That asset-level uncertainty is the core challenge here. It is why adoption risk is tougher to spread than market or policy risk.
2. Market Risk
Cash Flow Channel
If adoption risk sits inside the asset, market risk comes from outside it. A plant can perform exactly as planned and still bring in less cash than expected.
This risk cuts into revenue through price swings, softer offtake demand, price cannibalization, and curtailment. Power price volatility is the clearest path: when wholesale prices drop, energy revenue drops with them, especially for projects exposed to spot markets instead of fixed-price contracts. Weaker offtake demand can shrink contracted volumes, shorten contract terms, or force lower pricing in new agreements. That chips away at long-term revenue visibility before the project is even online.
Then there’s price cannibalization. When solar or wind output is high across the grid, market prices can fall at the same time. In plain terms, the project produces when everyone else does, and that flood of supply pushes down the price it earns. Capture Price Ratio (CPR) modeling shows solar PV CPRs of 85–97% in low-penetration grids, falling below 75% in high-penetration markets like California and Germany.[18][28]
Curtailment makes the problem worse. When transmission is congested or the grid has more supply than it can take, grid operators tell generators to stop producing. Those MWh don’t come back later. CAISO curtailed roughly 3.4 million MWh of solar and wind in 2024, a 29% increase over 2023, with solar accounting for about 93% of curtailed energy.[27][29][30] That directly cuts delivered generation and cash receipts.
Finance Model Impact
In a project finance model, market risk runs straight through the revenue waterfall. Analysts usually build P50, P75, and P90 price curves using third-party market consultant data, then stress-test the model for merchant exposure, curtailment rates, and basis risk between hub and node prices. The core question is simple: does the minimum DSCR still hold if prices fall or curtailment climbs?
The ERCOT market during Winter Storm Uri in February 2021 shows how ugly this can get when merchant exposure meets an extreme price shock. Spot prices jumped to $9,000/MWh for roughly three days, versus a more normal range of $20–$40/MWh.[20] Projects with fixed-volume hedges had to buy power at those peak prices to meet contract obligations. About one-third of projects were materially affected by hedge structures during Uri.[20]
That single event reshaped how lenders and sponsors model merchant risk in Texas and beyond.
Bankability Threshold
In most U.S. markets, senior lenders usually cap merchant revenue at about 10–30% of total project revenue during the debt tenor. The rest generally needs support from PPAs, hedges, or other contracted offtake.[16][17] Full-merchant financing is rare and is usually limited to projects of 100–150 MW, with only a small group of banks willing to step in.[16]
For contracted projects, minimum DSCRs often land in the 1.20–1.30x range. More merchant exposure tends to mean lenders want extra cushion, lower leverage, or both.
The U.S. offshore wind sector gave a clear example of what happens when contracted pricing stops working. Avangrid and Connecticut utilities terminated the Park City Wind PPA in October 2023, with Avangrid explicitly stating the project was "unfinanceable" under the existing contract.[19] Across late 2023 and into 2024, multiple East Coast offshore wind developers canceled or tried to renegotiate offtake agreements as costs rose roughly 50% and fixed-price PPAs without inflation indexing became structurally unviable.[21][22][23][24][25][26] In that case, market risk wasn’t just a downside case in Excel. It stopped deals cold.
Mitigation Path
The clearest mitigation tool is a long-term PPA with a creditworthy offtaker. It turns uncertain merchant revenue into a steadier cash flow stream and gives lenders the contracted base they need to size debt. When full PPA coverage isn’t available, sponsors often lean on:
Virtual PPAs (VPPAs)
Fixed-volume hedges
Contracts for differences
For curtailment, the practical playbook is more operational. Sponsors can choose interconnection points with lower past congestion, or pair projects with battery storage or solar-plus-storage hybrid configurations to shift delivery out of oversupplied hours. Each of these steps can improve DSCR and support higher leverage. Market risk squeezes revenue; policy risk can alter the rules behind it.
3. Policy and Regulatory Risk
Cash Flow Channel
Policy and regulatory risk doesn’t change how the asset operates. It changes whether the project keeps the incentives, permits, and approvals baked into the model. In plain terms, this is a rules problem, not an equipment problem.
In the model, policy risk shows up through credits, compliance, and COD timing, not through operating output. The first pressure point is tax credit value. A 30% Investment Tax Credit (ITC) on a $200 million solar project can support about $60 million in tax equity.[38][41] If bonus credits like domestic content, energy community, or low-income adders are denied, that value can fall fast.[32][36][42] Production Tax Credits (PTCs) face a similar issue. Since they are earned per kilowatt-hour for up to 10 years, any rule change that shortens eligibility or tightens compliance cuts straight into the revenue stack.[37][38][39]
Permitting and interconnection delays create a second cash flow path. If a project can’t start construction on time or secure a grid connection, it may miss tax-credit deadlines, carry construction interest before revenue begins, and slip outside the placed-in-service window needed to keep eligibility.[41][43] By the end of 2024, about 10,300 projects totaling roughly 2,300 GW were sitting in U.S. interconnection queues, and newer cohorts were taking more than 4 years from request to commercial operation.[44][46]
Finance Model Impact
This risk lands in the model differently than adoption risk. Analysts usually run current-law, reduced-credit, and zero-credit cases.[34][40]
Permitting and interconnection issues are often modeled through delayed COD scenarios - often with 6 to 24 months of slippage - plus higher contingencies in EPC and development cost lines, later revenue start dates, and reworked debt amortization.[43] A 2025 IRS bulletin also confirmed that certain qualified interconnection costs can count toward ITC basis, and Energy Innovation estimated that this guidance could improve project economics for roughly 26–37 GW by lowering effective connection costs.[48][49][50]
Bankability Threshold
Lenders and tax equity investors tend to draw a hard line when policy uncertainty makes cash flows too hard to underwrite. Deals often stall when credit eligibility is unclear, when IRS or Treasury guidance on prevailing wage, apprenticeship, or domestic content is still unfinished, or when foreign entity of concern (FEOC) rules put the project’s supply chain or ownership structure at risk.[32][33][34][36] Import tariffs or trade remedies can also push capex higher or tighten supply enough to break cost and schedule assumptions.[31][41]
For tax equity, investors want a clear legal path to credits under current law, backed by tax counsel opinions from teams that know this terrain well, before they commit capital.[38][39] Projects also need to show they can meet prevailing wage and domestic content rules, or still work at the base 30% ITC rate without bonus adders.[32][33] In practice, many projects need to begin construction before the deadline or be placed in service by December 31, 2027, to keep eligibility under current federal rules.[45][47]
Mitigation Path
The best mitigation starts early. Locking in construction-start milestones through safe-harbor equipment purchases or physical work tests helps protect credit eligibility.[33][34][38] Early queue entry matters too. So do conservative interconnection cost assumptions backed by utility studies, which can reduce the odds that surprise upgrade costs blow a hole in the capital budget.[41][43]
On the compliance side, sponsors should build labor and domestic content costs into base-case capex instead of treating them like optional extras.[33][36] EPC contracts should also assign compliance duties clearly, with indemnities that deal with tax recapture risk if those rules are missed.[33][35]
Policy risk narrows the financing window. Delivery risk is where schedule and cost pressure turn that uncertainty into delay.
4. Delivery Risk
Where policy risk changes the rules, delivery risk tests whether a project can still reach COD on time and on budget. In plain terms, this is execution risk: does the project hit COD when planned, within budget, and at the expected level of performance? Policy risk reshapes the playing field. Delivery risk is about whether the team can finish the job.
Cash Flow Channel
The clearest damage shows up through COD timing. Every month of delay pushes revenue farther out, keeps the construction loan in place longer, and adds to IDC. For a 100 MW solar PV project, a 6-month COD delay can lower equity IRR by about 80–150 basis points. A 12-month delay can cut it by 170–300 basis points.[61] Delays can also set off PPA liquidated damages, push a project past tax deadlines, and lock up reserves for longer than planned.[52]
Capex overruns make the hit worse. A global review of 662 energy projects found actual costs of $1.358 trillion versus a budget of $812 billion, which works out to a 66% average overrun. More than three-fifths of those projects came in above their first budget.[62] In the U.S., interconnection costs are still all over the map. A quarter of projects pay more than 10 times what the lowest-cost quartile pays for grid connection.[55]
Finance Model Impact
In the model, delivery risk appears in familiar places: delayed debt draws, higher IDC, larger EPC and balance-of-plant costs, heavier contingency use, and later revenue start dates. Teams usually run 3- to 12-month COD delay scenarios and test whether DSCR still stays above minimum levels when construction costs climb and early-year cash flow gets squeezed.[52][53]
This is where the finance model stops being a spreadsheet exercise and starts acting like a stress test. Grid connection needs its own scenario set. Median interconnection timelines have stretched to 48 months in ERCOT and 80 months in CAISO.[62] If interconnection cost is treated as a fixed input instead of a range with a high-cost case, total capex can look too low and early returns can look better than they should.
Bankability Threshold
Lenders tend to stop when downside delivery cases break core covenants. For contracted renewables, the usual minimum DSCR sits around 1.20–1.30x. If delay and capex overrun cases push coverage below that floor, the deal can stall.[52][53] Interconnection risk adds another filter. Sunk costs from canceled projects average more than $2 million per solar project and $7.5 million per wind project.[63]
Lenders usually want to see four basics in place:
an executed interconnection agreement
a creditworthy EPC contractor
delay liquidated damages sized to the risk
Mitigation Path
Most mitigation here is contractual and structural. Fixed-price, date-certain EPC contracts with delay liquidated damages (DLDs) and performance bonds shift schedule and output risk to the contractor. That gives lenders a cleaner recovery path if execution slips.[53][2] Performance guarantees should link COD output to a clear minimum threshold, with compensation or remediation if the project comes in short.[54][3]
On the grid side, early queue entry and active work with transmission operators can shorten study timelines and bring upgrade costs into view before they turn into a financing shock.[51][57] Developers can also cut interconnection exposure by co-locating storage, sizing projects to fit local grid limits, or using grid-enhancing technologies to improve the odds of getting connected on time.[55][56]
These execution risks feed straight into capex, IDC, and COD timing assumptions in the finance model.
Where Each Risk Enters the Project Finance Model
In project finance, each risk shows up in a different part of the model. Technology adoption risk affects the revenue forecast and ramp-up assumptions. Market risk hits price and volume. Policy risk changes credits and compliance. Delivery risk lands in capex and schedule.
Recent industry data puts solar PV at about a 1.25x P50 DSCR, onshore wind at 1.30–1.40x, and battery storage at about 2.0x.[65] Those gaps don’t come from one issue alone. They reflect how lenders underwrite each asset class.
When adoption risk is high, lenders don’t just shrug and move on. They usually cut forecast revenue, stretch the assumed ramp-up period, and ask for larger debt service reserve accounts - often sized to 6–12 months of debt service.[66] They may also sculpt amortization to back-load principal repayment, add milestone-based disbursement conditions, or tighten cash sweep rules so sponsor distributions stay blocked until the project reaches a steady operating profile. In plain terms, a weak ramp-up case usually leads to lower leverage, tighter covenants, and bigger reserves.
That mapping helps lenders separate operating risk from price, policy, and execution risk.
Risk Type | Where It Appears in the Model | Downside Adjustment | Financing Terms Most Affected |
|---|---|---|---|
Technology Adoption | Revenue build, ramp-up curve, stabilization timeline | Slower take-up, lower base-case cash flow, delayed stabilization | DSCR, tenor, covenant headroom, reserve sizing |
Market Risk | Price and volume assumptions, merchant revenue tranche | Demand volatility, lower realized prices | Reserve accounts, DSCR, leverage limits, spread |
Policy & Regulatory | Tax credits, permits, tariffs, and compliance | Subsidy removal, permit delays | Cost of capital, political risk guarantees, revenue projections |
Delivery Risk | Capex budget, construction schedule, interest during construction, commissioning | Cost overruns, COD delay, completion delay | Capex contingencies, completion guarantees, EPC terms |
The distinction that sponsors sometimes miss is simple: adoption risk changes the shape of cash flow, not just the total revenue figure. If adoption comes in slowly in the early years - before the project stabilizes - DSCR can drop below covenant minimums even when the long-term market case still looks solid. That’s why these model inputs matter so much. They determine whether adoption risk can be priced into the deal or turns into a deal blocker.
Those distinctions drive the trade-offs in the next section.
Technology Adoption Risk vs. Other Risks: Pros and Cons
The core issue isn’t only which risk is biggest. It’s which risk lenders can price, insure, or shape through deal structure.
Each risk category behaves differently when you look at controllability, insurability, data visibility, and the odds that it kills a deal. Technology adoption risk is the most shaped by the sponsor’s choices, policy risk is the hardest to control, and delivery risk is the easiest to handle through contracts and insurance. Those differences flow straight into revenue assumptions, capex buffers, reserve levels, and leverage.
For novel technologies, standard insurance usually does not cover core performance risk. In more mature renewable sectors, OEM warranties and performance guarantees can cover part of that gap. But for advanced battery storage, green hydrogen, or direct air capture, that protection is often limited or missing altogether.[4][1][68][69] Delivery risk is much easier to insure through builder's risk and contractor all-risk policies. Market risk and policy risk are usually handled through contracts, hedging, and political risk products rather than standard insurance.[1][67][68]
Data depth also varies by risk type. Market risk comes with stronger public data. Delivery risk has better cost and schedule benchmarks. Technology adoption risk often lacks both.[67][68][69] When lenders face that kind of fog, they usually respond the same way: lower leverage, tighter terms, and more conservative cases.
The table below shows how these risks line up against the factors lenders care about most.
Risk Type | Controllability | Insurability | Data Transparency | Financing Impact |
|---|---|---|---|---|
Technology Adoption | Moderate; highest before COD | Low for novel tech; moderate for mature tech with OEM warranties | Low to moderate; limited commercial-scale operating data | High if TRL is below 8–9 or no performance guarantee exists |
Market Risk | Moderate; PPAs and offtake contracts reduce exposure | Low; usually managed with hedging and contracts | High; public price indices, forward curves, and demand data | Moderate; often manageable with strong offtake structure |
Policy & Regulatory | Low; sponsors can only shape exposure at the margins | Very low; specialty political risk products cover only narrow scenarios | Moderate; rules are documented, but future changes are hard to predict | High if subsidy frameworks are unstable or permits are uncertain |
Delivery Risk | High; EPC contracts, liquidated damages, and contingency budgets help | High; builder's risk and contractor all-risk policies are standard | High; cost and schedule benchmarks are widely available | Low to moderate; usually leads to tighter terms, not rejection |
One pattern stands out. Delivery risk is the easiest to manage across all four dimensions. Technology adoption risk and policy risk are more likely to stop a deal cold, but for different reasons: one is tied to whether the asset will work as promised, the other to whether the rules may shift midstream.
Red Flags That Push Technology Adoption Risk to Unfinanceable
Technology adoption risk isn’t all-or-nothing. Lenders can live with some uncertainty. What tends to break financeability is a stack of issues that leaves too many open questions at once.
TRL below 8–9 and no commercial-scale operating data.[70][71]
No performance guarantee that covers the debt tenor.[64][4][67]
Commercial insurance unavailable for critical performance risks, leaving lenders exposed to output shortfalls with no insurance backstop.[4][1][68]
Economics dependent on future cost reductions rather than current demonstrated performance.[1][68][69]
Single-vendor dependency with a small or financially weak technology provider, where long-term servicing, replacement parts, and technical support are uncertain.[67][68]
Once those red flags start piling up, the risk stops looking like something lenders can model and starts looking like something they may have to walk away from.
Conclusion
The main question in U.S. green project finance isn't which risk is biggest. It's which risks can be modeled, assigned, and reduced well enough to keep a deal financeable.
That puts adoption risk at the center of underwriting for newer technologies, while market risk and policy risk tend to lead for mature assets. Each risk hits a different part of the deal. Technology adoption shapes output and ramp-up. Market risk shapes price and volume. Policy risk shapes credits and timing. Delivery risk shapes capex and COD. At the underwriting level, the issue is simple: after using conservative assumptions, does the project still clear debt service?
Adoption risk becomes bankable when modeled performance stays inside DSCR limits, key technical downsides are pushed into EPC and OEM contracts, and revenue support is strong enough to carry cautious technical assumptions. If modeled output drops below covenant coverage and no contract picks up that downside, adoption risk stops being an operating issue and turns into a financing issue.
That cushion is often narrow. In the field, policy shifts can hit even well-known technologies hard, while public credit support can help carry early-stage technical risk across the line.
For investors, the practical move is to match the risk structure to the technology's stage of maturity. With proven technologies, credit analysis should stay focused on offtake strength and policy stability. With newer technologies, investors should push for strict technical due diligence, require strong risk transfer through EPC and OEM guarantees, and put more equity into the capital stack. Put plainly, adoption risk is asset-specific, market and policy risk are system-level, and delivery risk is execution-level.
FAQs
How do lenders judge whether adoption risk is still financeable?
Lenders decide whether technology adoption risk is financeable by balancing two things: how mature and reliable a technology is, and how likely it is to shake up the market. In plain terms, they want to know whether the tech works as promised - and whether that promise can hold up under pressure.
To get there, they lean on due diligence, independent reviews, and contractual protections. That means they don’t just take a developer’s word for it. They bring in outside experts, test assumptions, and build deal terms that help protect against weak performance.
Cost matters too. Lenders look for proof that the technology can compete on price, or that government incentives lower the hurdle enough to make adoption more likely. A tax credit, grant, or other public support can change the math in a big way, especially for newer systems trying to gain ground.
If the technology is still unproven, lenders usually ask for extra backstops. These may include guarantees or other credit enhancements that help cover performance shortfalls or borrower defaults. It’s a bit like putting guardrails on a winding road: the risk may still be there, but the downside is less exposed.
When does technology adoption risk become a deal blocker?
Technology adoption risk can kill a deal when a solution hasn’t shown enough market traction or maturity to draw private capital.
It can also stall funding when performance problems threaten projected cash flows. Think equipment degradation, weak capacity factors, or systems that don’t integrate cleanly with what’s already in place. If the technology falls short of expectations, investors often step back unless guarantees or insurance help cover the risk.
Which risk matters most for DSCR: technology, market, policy, or delivery?
For DSCR, the biggest risk is usually the one with the clearest impact on revenue and cash flow stability. In infrastructure and green finance, that often means policy and contract risk matters more than technology or delivery risk.
Regulatory decisions and concession terms can change revenue directly. Technology risk still matters, but it is often reduced through performance insurance or contract guarantees.
Related Blog Posts
Latest Articles
©2026
Narrative Change and Power Building: The Missing Half of Advocacy
Narrative change is the process of disrupting dominant narratives that normalize inequity and advancing new narratives from historically marginalized communities.
Funding Resilience Without Federal Grants
BRIC is unreliable and FEMA is shrinking. Here's how cities fund climate resilience with dedicated revenue, blended finance, and a coordinating authority.
The ESG Blind Spot: How AI Is Finding Risks in Companies Nobody Else Is Watching
Norway's sovereign wealth fund uses AI to screen 7,200 portfolio companies for forced labor and corruption within 24 hours. The real story is the emerging-market coverage gap that traditional ESG data vendors miss — and what it means for any company with a global supply chain.
FAQ
01
What does it really mean to “redefine profit”?
02
What makes Council Fire different?
03
Who does Council Fire work with?
04
What does working with Council Fire actually look like?
05
How does Council Fire help organizations turn big goals into action?
06
How does Council Fire define and measure success?
07
How does technology fit into Council Fire’s work?
Sep 9, 2026
Green Investment Risk Analysis: Technology Adoption
Sustainability Strategy
In This Article
How technology, market, policy and delivery risks affect cash flow, DSCR and the financeability of green projects—and lender mitigations.
Green Investment Risk Analysis: Technology Adoption
If you want to know what can kill a green project finance deal, start with cash flow. I’d boil this article down to one point: lenders care less about which risk sounds biggest and more about where it hits CFADS, DSCR, leverage, and timing.
Here’s the short version in plain English:
Technology adoption risk is about whether the asset performs as promised. It hits output, degradation, uptime, O&M, and replacement capex.
Market risk is about whether power sold earns the price the model expects. It hits merchant revenue, curtailment, and price exposure.
Policy and regulatory risk is about whether the rules, tax credits, permits, and interconnection path stay in place. It hits ITC/PTC value, compliance costs, and COD timing.
Delivery risk is about whether the project gets built on time and on budget. It hits capex, interest during construction, and revenue start date.
A few numbers show why this matters:
Solar PV degradation is often modeled around 0.5% to 1.0% per year
Offshore wind availability can sit around 90%–95%
Lender DSCR targets can range from about 1.1x to 2.0x
Merchant revenue is often capped by lenders at roughly 10%–30% of total revenue during debt tenor
A 6-month COD delay can cut equity IRR by about 80–150 basis points
For me, the key takeaway is simple: adoption risk is asset-level, market and policy risk are system-level, and delivery risk is execution-level. If output, timing, or credit support slip too far, the deal can move from financeable to stalled fast.
Green Investment Risk Analysis: 4 Key Risks in Project Finance
Financing the Green Transition: Risk, Capital, Banks and Investors
Quick comparison
Risk | Main source | Main hit to the model | Usual lender response |
|---|---|---|---|
Technology adoption | Asset performance | Revenue, O&M, replacement spend, ramp-up | Lower leverage, more reserves, tighter covenants |
Market | Power prices, curtailment, offtake terms | Revenue price and volume | More contracted revenue, lower merchant share |
Policy & regulatory | Tax credits, permits, compliance, trade rules | Credit value, costs, COD timing | Extra legal review, base-case downside runs |
Delivery | Construction, grid connection, schedule, cost | Capex, IDC, COD delay | Contingencies, EPC protections, delay cases |
If I were reading this for an investment screen, I’d ask one question first: after conservative downside cases, does the project still cover debt on time?
1. Technology Adoption Risk
Cash Flow Channel
Technology adoption risk usually shows up in revenue first. If equipment degrades faster than expected, goes offline without warning, or produces less power than planned, annual generation drops. When generation drops, revenue drops with it.
For solar PV, field evidence across roughly 2,000 data points points to a mean degradation rate of 0.8% per year and a median of 0.5% per year, with about 78% of observed systems degrading below 1% per year.[12] That gap matters over time. A project degrading at 1.0% per year instead of 0.5% delivers fewer total MWh across its life, and that lost output cuts the revenue attached to those MWh.
Offshore wind shows the same issue in a different form. Offshore wind farms run at 90–95% availability, compared with roughly 97% for onshore wind.[11][13] Lenders build that gap straight into their availability and yield views. In practice, these are the revenue swings they test first.
Finance Model Impact
The size of the downside matters, but so does where it lands in the model. Adoption risk flows through revenue, O&M, and replacement capex.
On the revenue side, analysts use P50/P90 energy yield curves and adjust them for higher degradation. They also run sensitivity cases, such as testing degradation at 0.5% versus 1.0% per year, to see what happens to DSCR and equity IRR.[5][3] That sounds technical, but the idea is simple: if output slips, can the project still cover debt and deliver the expected return?
O&M is another pressure point. Newer technologies tend to carry higher O&M budgets because failure modes are less clear and the labor pool is more specialized. A solid O&M contract can help a lot. Well-structured O&M contracts can reduce O&M costs by roughly 33%, which directly improves operating margins.[14]
Replacement capex can be even trickier because it does not arrive as a smooth annual cost. Battery energy storage systems, for example, may need pack replacements in years 10–12, and those have to be entered as discrete capital expenditure items in the model.[3][8] If the timing is off, or the cost is set too low, debt amortization can start to feel tight fast.
Bankability Threshold
A technology becomes bankable when lenders trust its cash flows enough to believe debt will be serviced through the loan term. At that point, adoption risk stops being just an operating concern and becomes a credit question.
This is what makes adoption risk harder to deal with than market or policy risk. It sits inside the asset itself. A lender cannot smooth that away just by backing more deals.
For conventional crystalline silicon PV, lender confidence is already in place. The sector has decades of field data, and manufacturer warranties often cap annual degradation at roughly 0.4–0.6% per year over 25 years.[10] Newer technologies, such as long-duration energy storage, face a tougher test. Lenders want independent proof of performance, including round-trip efficiency, cycle life, availability data, and safety records.[8][5]
Without that proof, the answer is often simple: pass on the deal or change the capital stack. In many cases, that means more equity and lower leverage. First-of-a-kind projects often see debt below 60% of capex, with the balance filled by more expensive equity.[15]
Mitigation Path
The clearest way to manage adoption risk is to move performance uncertainty to parties that are better able to take it on. Vendor warranties and long-term performance guarantees on output and degradation can reduce the haircuts lenders apply to base-case assumptions.[3][5] When those protections are not enough, blended finance tranches from development finance institutions or staged funding tied to performance milestones can help close the gap.[7][9][6]
There is also evidence that contract and operating design can change financing terms in a meaningful way. A PV risk framework that combines better EPC contracts, data-led O&M, and stronger production estimates has been shown to reduce debt interest rates by 1 percentage point and increase project IRR by up to 2 percentage points.[14]
That asset-level uncertainty is the core challenge here. It is why adoption risk is tougher to spread than market or policy risk.
2. Market Risk
Cash Flow Channel
If adoption risk sits inside the asset, market risk comes from outside it. A plant can perform exactly as planned and still bring in less cash than expected.
This risk cuts into revenue through price swings, softer offtake demand, price cannibalization, and curtailment. Power price volatility is the clearest path: when wholesale prices drop, energy revenue drops with them, especially for projects exposed to spot markets instead of fixed-price contracts. Weaker offtake demand can shrink contracted volumes, shorten contract terms, or force lower pricing in new agreements. That chips away at long-term revenue visibility before the project is even online.
Then there’s price cannibalization. When solar or wind output is high across the grid, market prices can fall at the same time. In plain terms, the project produces when everyone else does, and that flood of supply pushes down the price it earns. Capture Price Ratio (CPR) modeling shows solar PV CPRs of 85–97% in low-penetration grids, falling below 75% in high-penetration markets like California and Germany.[18][28]
Curtailment makes the problem worse. When transmission is congested or the grid has more supply than it can take, grid operators tell generators to stop producing. Those MWh don’t come back later. CAISO curtailed roughly 3.4 million MWh of solar and wind in 2024, a 29% increase over 2023, with solar accounting for about 93% of curtailed energy.[27][29][30] That directly cuts delivered generation and cash receipts.
Finance Model Impact
In a project finance model, market risk runs straight through the revenue waterfall. Analysts usually build P50, P75, and P90 price curves using third-party market consultant data, then stress-test the model for merchant exposure, curtailment rates, and basis risk between hub and node prices. The core question is simple: does the minimum DSCR still hold if prices fall or curtailment climbs?
The ERCOT market during Winter Storm Uri in February 2021 shows how ugly this can get when merchant exposure meets an extreme price shock. Spot prices jumped to $9,000/MWh for roughly three days, versus a more normal range of $20–$40/MWh.[20] Projects with fixed-volume hedges had to buy power at those peak prices to meet contract obligations. About one-third of projects were materially affected by hedge structures during Uri.[20]
That single event reshaped how lenders and sponsors model merchant risk in Texas and beyond.
Bankability Threshold
In most U.S. markets, senior lenders usually cap merchant revenue at about 10–30% of total project revenue during the debt tenor. The rest generally needs support from PPAs, hedges, or other contracted offtake.[16][17] Full-merchant financing is rare and is usually limited to projects of 100–150 MW, with only a small group of banks willing to step in.[16]
For contracted projects, minimum DSCRs often land in the 1.20–1.30x range. More merchant exposure tends to mean lenders want extra cushion, lower leverage, or both.
The U.S. offshore wind sector gave a clear example of what happens when contracted pricing stops working. Avangrid and Connecticut utilities terminated the Park City Wind PPA in October 2023, with Avangrid explicitly stating the project was "unfinanceable" under the existing contract.[19] Across late 2023 and into 2024, multiple East Coast offshore wind developers canceled or tried to renegotiate offtake agreements as costs rose roughly 50% and fixed-price PPAs without inflation indexing became structurally unviable.[21][22][23][24][25][26] In that case, market risk wasn’t just a downside case in Excel. It stopped deals cold.
Mitigation Path
The clearest mitigation tool is a long-term PPA with a creditworthy offtaker. It turns uncertain merchant revenue into a steadier cash flow stream and gives lenders the contracted base they need to size debt. When full PPA coverage isn’t available, sponsors often lean on:
Virtual PPAs (VPPAs)
Fixed-volume hedges
Contracts for differences
For curtailment, the practical playbook is more operational. Sponsors can choose interconnection points with lower past congestion, or pair projects with battery storage or solar-plus-storage hybrid configurations to shift delivery out of oversupplied hours. Each of these steps can improve DSCR and support higher leverage. Market risk squeezes revenue; policy risk can alter the rules behind it.
3. Policy and Regulatory Risk
Cash Flow Channel
Policy and regulatory risk doesn’t change how the asset operates. It changes whether the project keeps the incentives, permits, and approvals baked into the model. In plain terms, this is a rules problem, not an equipment problem.
In the model, policy risk shows up through credits, compliance, and COD timing, not through operating output. The first pressure point is tax credit value. A 30% Investment Tax Credit (ITC) on a $200 million solar project can support about $60 million in tax equity.[38][41] If bonus credits like domestic content, energy community, or low-income adders are denied, that value can fall fast.[32][36][42] Production Tax Credits (PTCs) face a similar issue. Since they are earned per kilowatt-hour for up to 10 years, any rule change that shortens eligibility or tightens compliance cuts straight into the revenue stack.[37][38][39]
Permitting and interconnection delays create a second cash flow path. If a project can’t start construction on time or secure a grid connection, it may miss tax-credit deadlines, carry construction interest before revenue begins, and slip outside the placed-in-service window needed to keep eligibility.[41][43] By the end of 2024, about 10,300 projects totaling roughly 2,300 GW were sitting in U.S. interconnection queues, and newer cohorts were taking more than 4 years from request to commercial operation.[44][46]
Finance Model Impact
This risk lands in the model differently than adoption risk. Analysts usually run current-law, reduced-credit, and zero-credit cases.[34][40]
Permitting and interconnection issues are often modeled through delayed COD scenarios - often with 6 to 24 months of slippage - plus higher contingencies in EPC and development cost lines, later revenue start dates, and reworked debt amortization.[43] A 2025 IRS bulletin also confirmed that certain qualified interconnection costs can count toward ITC basis, and Energy Innovation estimated that this guidance could improve project economics for roughly 26–37 GW by lowering effective connection costs.[48][49][50]
Bankability Threshold
Lenders and tax equity investors tend to draw a hard line when policy uncertainty makes cash flows too hard to underwrite. Deals often stall when credit eligibility is unclear, when IRS or Treasury guidance on prevailing wage, apprenticeship, or domestic content is still unfinished, or when foreign entity of concern (FEOC) rules put the project’s supply chain or ownership structure at risk.[32][33][34][36] Import tariffs or trade remedies can also push capex higher or tighten supply enough to break cost and schedule assumptions.[31][41]
For tax equity, investors want a clear legal path to credits under current law, backed by tax counsel opinions from teams that know this terrain well, before they commit capital.[38][39] Projects also need to show they can meet prevailing wage and domestic content rules, or still work at the base 30% ITC rate without bonus adders.[32][33] In practice, many projects need to begin construction before the deadline or be placed in service by December 31, 2027, to keep eligibility under current federal rules.[45][47]
Mitigation Path
The best mitigation starts early. Locking in construction-start milestones through safe-harbor equipment purchases or physical work tests helps protect credit eligibility.[33][34][38] Early queue entry matters too. So do conservative interconnection cost assumptions backed by utility studies, which can reduce the odds that surprise upgrade costs blow a hole in the capital budget.[41][43]
On the compliance side, sponsors should build labor and domestic content costs into base-case capex instead of treating them like optional extras.[33][36] EPC contracts should also assign compliance duties clearly, with indemnities that deal with tax recapture risk if those rules are missed.[33][35]
Policy risk narrows the financing window. Delivery risk is where schedule and cost pressure turn that uncertainty into delay.
4. Delivery Risk
Where policy risk changes the rules, delivery risk tests whether a project can still reach COD on time and on budget. In plain terms, this is execution risk: does the project hit COD when planned, within budget, and at the expected level of performance? Policy risk reshapes the playing field. Delivery risk is about whether the team can finish the job.
Cash Flow Channel
The clearest damage shows up through COD timing. Every month of delay pushes revenue farther out, keeps the construction loan in place longer, and adds to IDC. For a 100 MW solar PV project, a 6-month COD delay can lower equity IRR by about 80–150 basis points. A 12-month delay can cut it by 170–300 basis points.[61] Delays can also set off PPA liquidated damages, push a project past tax deadlines, and lock up reserves for longer than planned.[52]
Capex overruns make the hit worse. A global review of 662 energy projects found actual costs of $1.358 trillion versus a budget of $812 billion, which works out to a 66% average overrun. More than three-fifths of those projects came in above their first budget.[62] In the U.S., interconnection costs are still all over the map. A quarter of projects pay more than 10 times what the lowest-cost quartile pays for grid connection.[55]
Finance Model Impact
In the model, delivery risk appears in familiar places: delayed debt draws, higher IDC, larger EPC and balance-of-plant costs, heavier contingency use, and later revenue start dates. Teams usually run 3- to 12-month COD delay scenarios and test whether DSCR still stays above minimum levels when construction costs climb and early-year cash flow gets squeezed.[52][53]
This is where the finance model stops being a spreadsheet exercise and starts acting like a stress test. Grid connection needs its own scenario set. Median interconnection timelines have stretched to 48 months in ERCOT and 80 months in CAISO.[62] If interconnection cost is treated as a fixed input instead of a range with a high-cost case, total capex can look too low and early returns can look better than they should.
Bankability Threshold
Lenders tend to stop when downside delivery cases break core covenants. For contracted renewables, the usual minimum DSCR sits around 1.20–1.30x. If delay and capex overrun cases push coverage below that floor, the deal can stall.[52][53] Interconnection risk adds another filter. Sunk costs from canceled projects average more than $2 million per solar project and $7.5 million per wind project.[63]
Lenders usually want to see four basics in place:
an executed interconnection agreement
a creditworthy EPC contractor
delay liquidated damages sized to the risk
Mitigation Path
Most mitigation here is contractual and structural. Fixed-price, date-certain EPC contracts with delay liquidated damages (DLDs) and performance bonds shift schedule and output risk to the contractor. That gives lenders a cleaner recovery path if execution slips.[53][2] Performance guarantees should link COD output to a clear minimum threshold, with compensation or remediation if the project comes in short.[54][3]
On the grid side, early queue entry and active work with transmission operators can shorten study timelines and bring upgrade costs into view before they turn into a financing shock.[51][57] Developers can also cut interconnection exposure by co-locating storage, sizing projects to fit local grid limits, or using grid-enhancing technologies to improve the odds of getting connected on time.[55][56]
These execution risks feed straight into capex, IDC, and COD timing assumptions in the finance model.
Where Each Risk Enters the Project Finance Model
In project finance, each risk shows up in a different part of the model. Technology adoption risk affects the revenue forecast and ramp-up assumptions. Market risk hits price and volume. Policy risk changes credits and compliance. Delivery risk lands in capex and schedule.
Recent industry data puts solar PV at about a 1.25x P50 DSCR, onshore wind at 1.30–1.40x, and battery storage at about 2.0x.[65] Those gaps don’t come from one issue alone. They reflect how lenders underwrite each asset class.
When adoption risk is high, lenders don’t just shrug and move on. They usually cut forecast revenue, stretch the assumed ramp-up period, and ask for larger debt service reserve accounts - often sized to 6–12 months of debt service.[66] They may also sculpt amortization to back-load principal repayment, add milestone-based disbursement conditions, or tighten cash sweep rules so sponsor distributions stay blocked until the project reaches a steady operating profile. In plain terms, a weak ramp-up case usually leads to lower leverage, tighter covenants, and bigger reserves.
That mapping helps lenders separate operating risk from price, policy, and execution risk.
Risk Type | Where It Appears in the Model | Downside Adjustment | Financing Terms Most Affected |
|---|---|---|---|
Technology Adoption | Revenue build, ramp-up curve, stabilization timeline | Slower take-up, lower base-case cash flow, delayed stabilization | DSCR, tenor, covenant headroom, reserve sizing |
Market Risk | Price and volume assumptions, merchant revenue tranche | Demand volatility, lower realized prices | Reserve accounts, DSCR, leverage limits, spread |
Policy & Regulatory | Tax credits, permits, tariffs, and compliance | Subsidy removal, permit delays | Cost of capital, political risk guarantees, revenue projections |
Delivery Risk | Capex budget, construction schedule, interest during construction, commissioning | Cost overruns, COD delay, completion delay | Capex contingencies, completion guarantees, EPC terms |
The distinction that sponsors sometimes miss is simple: adoption risk changes the shape of cash flow, not just the total revenue figure. If adoption comes in slowly in the early years - before the project stabilizes - DSCR can drop below covenant minimums even when the long-term market case still looks solid. That’s why these model inputs matter so much. They determine whether adoption risk can be priced into the deal or turns into a deal blocker.
Those distinctions drive the trade-offs in the next section.
Technology Adoption Risk vs. Other Risks: Pros and Cons
The core issue isn’t only which risk is biggest. It’s which risk lenders can price, insure, or shape through deal structure.
Each risk category behaves differently when you look at controllability, insurability, data visibility, and the odds that it kills a deal. Technology adoption risk is the most shaped by the sponsor’s choices, policy risk is the hardest to control, and delivery risk is the easiest to handle through contracts and insurance. Those differences flow straight into revenue assumptions, capex buffers, reserve levels, and leverage.
For novel technologies, standard insurance usually does not cover core performance risk. In more mature renewable sectors, OEM warranties and performance guarantees can cover part of that gap. But for advanced battery storage, green hydrogen, or direct air capture, that protection is often limited or missing altogether.[4][1][68][69] Delivery risk is much easier to insure through builder's risk and contractor all-risk policies. Market risk and policy risk are usually handled through contracts, hedging, and political risk products rather than standard insurance.[1][67][68]
Data depth also varies by risk type. Market risk comes with stronger public data. Delivery risk has better cost and schedule benchmarks. Technology adoption risk often lacks both.[67][68][69] When lenders face that kind of fog, they usually respond the same way: lower leverage, tighter terms, and more conservative cases.
The table below shows how these risks line up against the factors lenders care about most.
Risk Type | Controllability | Insurability | Data Transparency | Financing Impact |
|---|---|---|---|---|
Technology Adoption | Moderate; highest before COD | Low for novel tech; moderate for mature tech with OEM warranties | Low to moderate; limited commercial-scale operating data | High if TRL is below 8–9 or no performance guarantee exists |
Market Risk | Moderate; PPAs and offtake contracts reduce exposure | Low; usually managed with hedging and contracts | High; public price indices, forward curves, and demand data | Moderate; often manageable with strong offtake structure |
Policy & Regulatory | Low; sponsors can only shape exposure at the margins | Very low; specialty political risk products cover only narrow scenarios | Moderate; rules are documented, but future changes are hard to predict | High if subsidy frameworks are unstable or permits are uncertain |
Delivery Risk | High; EPC contracts, liquidated damages, and contingency budgets help | High; builder's risk and contractor all-risk policies are standard | High; cost and schedule benchmarks are widely available | Low to moderate; usually leads to tighter terms, not rejection |
One pattern stands out. Delivery risk is the easiest to manage across all four dimensions. Technology adoption risk and policy risk are more likely to stop a deal cold, but for different reasons: one is tied to whether the asset will work as promised, the other to whether the rules may shift midstream.
Red Flags That Push Technology Adoption Risk to Unfinanceable
Technology adoption risk isn’t all-or-nothing. Lenders can live with some uncertainty. What tends to break financeability is a stack of issues that leaves too many open questions at once.
TRL below 8–9 and no commercial-scale operating data.[70][71]
No performance guarantee that covers the debt tenor.[64][4][67]
Commercial insurance unavailable for critical performance risks, leaving lenders exposed to output shortfalls with no insurance backstop.[4][1][68]
Economics dependent on future cost reductions rather than current demonstrated performance.[1][68][69]
Single-vendor dependency with a small or financially weak technology provider, where long-term servicing, replacement parts, and technical support are uncertain.[67][68]
Once those red flags start piling up, the risk stops looking like something lenders can model and starts looking like something they may have to walk away from.
Conclusion
The main question in U.S. green project finance isn't which risk is biggest. It's which risks can be modeled, assigned, and reduced well enough to keep a deal financeable.
That puts adoption risk at the center of underwriting for newer technologies, while market risk and policy risk tend to lead for mature assets. Each risk hits a different part of the deal. Technology adoption shapes output and ramp-up. Market risk shapes price and volume. Policy risk shapes credits and timing. Delivery risk shapes capex and COD. At the underwriting level, the issue is simple: after using conservative assumptions, does the project still clear debt service?
Adoption risk becomes bankable when modeled performance stays inside DSCR limits, key technical downsides are pushed into EPC and OEM contracts, and revenue support is strong enough to carry cautious technical assumptions. If modeled output drops below covenant coverage and no contract picks up that downside, adoption risk stops being an operating issue and turns into a financing issue.
That cushion is often narrow. In the field, policy shifts can hit even well-known technologies hard, while public credit support can help carry early-stage technical risk across the line.
For investors, the practical move is to match the risk structure to the technology's stage of maturity. With proven technologies, credit analysis should stay focused on offtake strength and policy stability. With newer technologies, investors should push for strict technical due diligence, require strong risk transfer through EPC and OEM guarantees, and put more equity into the capital stack. Put plainly, adoption risk is asset-specific, market and policy risk are system-level, and delivery risk is execution-level.
FAQs
How do lenders judge whether adoption risk is still financeable?
Lenders decide whether technology adoption risk is financeable by balancing two things: how mature and reliable a technology is, and how likely it is to shake up the market. In plain terms, they want to know whether the tech works as promised - and whether that promise can hold up under pressure.
To get there, they lean on due diligence, independent reviews, and contractual protections. That means they don’t just take a developer’s word for it. They bring in outside experts, test assumptions, and build deal terms that help protect against weak performance.
Cost matters too. Lenders look for proof that the technology can compete on price, or that government incentives lower the hurdle enough to make adoption more likely. A tax credit, grant, or other public support can change the math in a big way, especially for newer systems trying to gain ground.
If the technology is still unproven, lenders usually ask for extra backstops. These may include guarantees or other credit enhancements that help cover performance shortfalls or borrower defaults. It’s a bit like putting guardrails on a winding road: the risk may still be there, but the downside is less exposed.
When does technology adoption risk become a deal blocker?
Technology adoption risk can kill a deal when a solution hasn’t shown enough market traction or maturity to draw private capital.
It can also stall funding when performance problems threaten projected cash flows. Think equipment degradation, weak capacity factors, or systems that don’t integrate cleanly with what’s already in place. If the technology falls short of expectations, investors often step back unless guarantees or insurance help cover the risk.
Which risk matters most for DSCR: technology, market, policy, or delivery?
For DSCR, the biggest risk is usually the one with the clearest impact on revenue and cash flow stability. In infrastructure and green finance, that often means policy and contract risk matters more than technology or delivery risk.
Regulatory decisions and concession terms can change revenue directly. Technology risk still matters, but it is often reduced through performance insurance or contract guarantees.
Related Blog Posts
Latest Articles
©2026
Narrative Change and Power Building: The Missing Half of Advocacy
Narrative change is the process of disrupting dominant narratives that normalize inequity and advancing new narratives from historically marginalized communities.
Funding Resilience Without Federal Grants
BRIC is unreliable and FEMA is shrinking. Here's how cities fund climate resilience with dedicated revenue, blended finance, and a coordinating authority.
The ESG Blind Spot: How AI Is Finding Risks in Companies Nobody Else Is Watching
Norway's sovereign wealth fund uses AI to screen 7,200 portfolio companies for forced labor and corruption within 24 hours. The real story is the emerging-market coverage gap that traditional ESG data vendors miss — and what it means for any company with a global supply chain.
FAQ
What does it really mean to “redefine profit”?
What makes Council Fire different?
Who does Council Fire work with?
What does working with Council Fire actually look like?
How does Council Fire help organizations turn big goals into action?
How does Council Fire define and measure success?
How does technology fit into Council Fire’s work?