
Aug 13, 2026
7 Governance KPI Models for Joint Ventures
Governance
In This Article
Seven practical KPI models to spot JV governance issues early—structure, compliance, board flow, info quality, participation, trust, disputes.
7 Governance KPI Models for Joint Ventures
If you want a joint venture to stay on track, measure governance early - not after results slip. I’d boil this article down to seven KPI models that show where a JV is slowing down: structure and control, compliance and risk, board and committee flow, information quality, participation, trust, dispute handling, and shared value tracking.
Here’s the short version:
I’d use 5 to 8 KPIs, not a long list
I’d pair hard metrics like cycle time, closure rate, and attendance with survey scores on trust and confidence
I’d track warning signs such as:
slow approvals
old governance documents
late board packs
open audit items
low attendance
deadlocks
disputes that sit too long
I’d review them on a simple rhythm:
monthly for management teams
quarterly for governance groups
annually for the board
A few numbers from the article make the case. One study found a median JV governance score of 5.4/10, and just 9% were rated strong. Another found trust had a 0.54 link with alliance performance. In other words, weak governance often shows up before financial results turn bad.
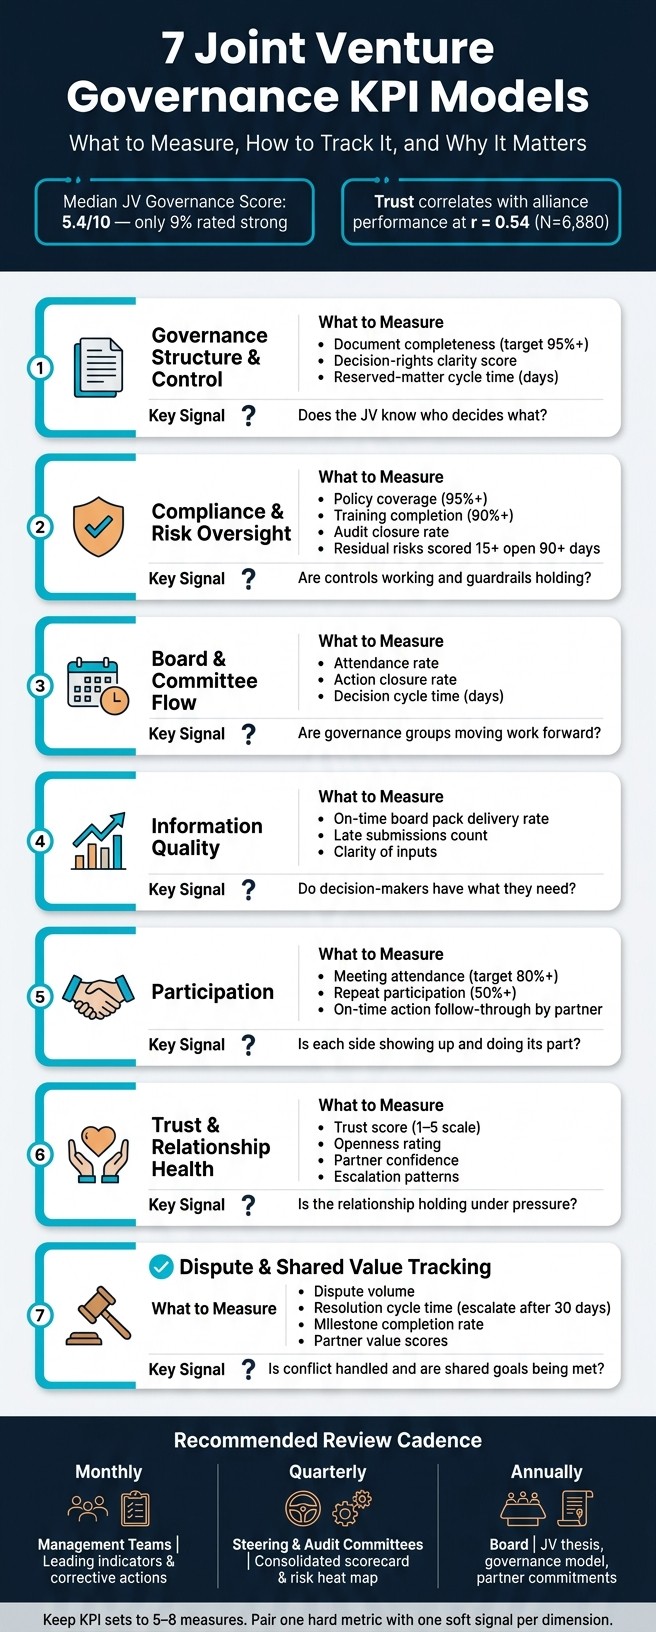
7 Joint Venture Governance KPI Models: What to Measure & Why
Quick Comparison
KPI model | What I’d measure | Main signal |
|---|---|---|
Structure and control | current documents, decision-rights clarity, reserved-matter cycle time | whether the JV knows who decides what |
Compliance and risk | policy coverage, training, audit closure, risk items open too long | whether controls are working |
Board and committee flow | attendance, action closure, decision time | whether governance groups are moving work |
Information quality | on-time board packs, late submissions, clarity of inputs | whether people have what they need to decide |
Participation | attendance, response rates, action follow-through by partner | whether each side is showing up and doing its part |
Trust and relationship health | trust score, openness, partner confidence, escalation patterns | whether the relationship is holding |
Dispute and shared value tracking | dispute volume, resolution time, milestone delivery, partner value scores | whether conflict is being handled and goals are being met |
What I like about this model set is simple: it turns governance into something you can see, review, and fix.
What Governance KPIs Need To Measure In Joint Ventures
JV governance issues tend to show up before the numbers on the income statement start looking bad. You see them in slow approvals, disputes that sit unresolved, commitments that slip, and partners who stop sharing information in a frank way.
To keep that from turning into a bigger problem, track seven core dimensions: compliance and risk oversight, board/committee effectiveness, information quality, participation, trust, dispute management, and shared value and sustainability outcomes. Each one points to a different way a partnership can work well - or quietly start to fray. The seven KPI models below turn those signals into scorecards a board can actually use.
The key is to match the metric to the signal you want to track. Use percentages for completion and compliance rates. Use counts for one-off events such as disputes or late submissions. Use cycle times to show how long decisions or resolutions take. Use closure rates to show whether actions get finished instead of just logged. For perception-based areas like trust, perceived fairness, and board confidence, 1 to 5 rating scales or survey-based indices usually tell you more than raw totals. Research on international joint ventures measures trust through survey items tied to openness and restraint in escalating conflict, which shows that these softer factors can still be tracked with rigor.[6] Hard metrics show process discipline. Survey metrics show relationship health.
A simple way to build the set is to pair each dimension with one hard KPI and one soft signal.
Governance Dimension | Quantitative Examples | Qualitative Examples |
|---|---|---|
Compliance and risk oversight | Audit findings closed, control breaches, incidents | Risk awareness, integrity culture |
Board/committee effectiveness | Attendance rate, decision cycle time, action closure | Deliberation quality, confidence in board judgment |
Information quality | Meeting packs distributed on time, late submissions | Completeness, clarity, timeliness of shared information |
Participation | Meeting attendance, response rates, submission timeliness | Engagement quality, perceived inclusion |
Trust and relationship health | Disputes escalated, time to resolution | Openness, perceived fairness, collaboration |
Dispute management | Disputes filed, escalation rate, resolution cycle time | Perceived fairness of process, partner confidence |
Shared value and sustainability outcomes | Milestone completion, cost savings, sustainability metrics | Partner satisfaction, perceived value creation |
Keep the KPI set to 5 to 8 measures. That’s usually enough to cover the main governance risks without burying the board in too much data. The first model starts with governance structure and control.
1. Governance Structure And Control
Governance structure often looks stronger on paper than it is in practice. One study of large JVs found a median score of 5.4/10, and only 9% were rated strong.[1][10] That gap matters. A board can have charters, approval matrices, and reserved-matter lists, yet still struggle when real decisions hit the table.
Two KPIs help make this visible: one for document control and one for decision rights. Start with document control. If the core governance documents are out of date, missing, or sitting in draft form, the rest of the structure is already on shaky ground. Then look at decision rights to see whether the setup works when people need to act.
Governance Structure Completeness Index measures the share of required governance documents that are current and approved. This includes the JV charter, committee charters, reserved-matter list, delegation of authority matrix, and accountability map. The score is:
approved current documents ÷ required documents × 100
The target is 95%+, reviewed quarterly.[7][8]
This KPI does more than check whether documents exist. It shows whether the operating rules are still current. That matters because stale governance documents can quietly cause delays, overlap, and finger-pointing.
The second KPI, Decision-Rights Clarity Score, tests whether people actually know who owns key decisions. It works as a short annual survey sent to senior managers and parent representatives. Each person gets a standard set of decisions - capital expenditure approvals, senior hires, and new market entry - and is asked to name the decision owner for each one. The KPI is the percentage of respondents who correctly assign at least 80% of scenarios to the right decision owner.[8]
That’s not a soft issue. A BCG survey found that one in three failed JVs can trace problems to boards that lacked clear decision rights, disciplined governance processes, or a commitment to act in the JV's best interests.[9] In plain English: when nobody knows who gets the call, the JV slows down or drifts.
It helps to pair that survey result with a hard operating measure: the average decision cycle time for reserved matters, tracked in days from proposal submission to final board resolution.[7][8][1] Put the two together and you get a clearer read on governance. One shows whether decision ownership is understood. The other shows whether that clarity leads to timely action.
Once structure and control are visible, the next test is whether compliance and risk oversight are working.
2. Compliance And Risk Oversight
Once decision rights are clear, the next question is simple: Is the JV still operating inside its guardrails? That’s where two KPI models help most - a compliance maturity index and a risk exposure and mitigation scorecard.
Compliance Maturity Index
This composite score tracks policy coverage, training completion, incidents, audit closure, and hotline use and closure rates. Each area is scored on a set scale - for example, a five-level range from "Initial" to "Optimized" - and then rolled into one index for quarterly review.
Aim for 95%+ policy coverage across antitrust, anti-corruption, privacy, and environmental rules. Annual training completion should top 90% for all staff and key contractors. Moderate-risk audit findings should close within 90 days, and high-risk issues should move faster.[11] The DOJ's guidance on effective compliance programs is a good benchmark for setting these thresholds.
Risk Exposure and Mitigation Scorecard
Track top risks - strategic, operational, financial, legal, and ESG - on a 1–5 likelihood × impact scale. That product gives the inherent risk score. Residual risk is what remains after controls are in place.
Report the share of top risks with full mitigation plans, along with the count of residual-risk items scored at 15+ that have stayed unresolved for 90+ days.[11] Any 4×4 risk should move to the next board agenda, along with mitigation options and estimated dollar exposure.[11]
This KPI only matters if it changes behavior. It should affect board agendas, assign clear owners, and set follow-up timing. When controls start to slip, the warning signs usually show up early: delayed escalation, open findings that sit too long, and patchy accountability across partners.
Together, these models shift compliance from hindsight to early warning. Next, measure whether partners are still working together well enough for governance to function.
3. Relational And Participation Health
Once compliance is in hand, the next check is simpler but no less serious: does the partnership still have the trust and day-to-day participation needed to keep moving? Relational and participation models help answer that. They show whether partners are still aligned, still engaged, and still willing to work side by side.
Relationship Health Scorecard
This scorecard tracks the health of the partnership across trust, communication, executive engagement, and commitment to shared goals. The link between these factors and JV performance is stronger than many teams assume. A meta-analysis of 64 empirical studies found that interorganizational trust was strongly related to alliance performance, with a corrected correlation of 0.54 across N = 6,880, and that communication between alliance partners showed a particularly strong positive association with trust, at 0.63 across N = 2,941.[17] That is not a vague, feel-good signal. It is an early sign of whether the JV can stay intact under pressure.
A practical approach is to score trust, commitment reliability, information sharing, and executive engagement each quarter on a 1–5 scale or by red/amber/green status. Any amber or red rating should come with a written rationale, a named owner, and a due date for corrective action.[15] That small step matters. It turns concern into something visible and trackable. In one business-alliance study, joint ventures averaged 4.0/5 for trust and 4.3/5 for success.[16]
Participation Index
If the relationship scorecard shows how people feel and how well the partnership is holding together, the participation index looks at what people actually do. It tracks observable behavior: attendance, authorized representation, repeat participation, and on-time action closure by partner.
Some scorecards use 80%+ attendance from key stakeholders at major milestones and a repeat participation rate above 50%.[13] Follow-through should be tracked through the on-time completion rate of governance action items by each partner, along with the number of open items past due by owner.[15]
These two models work well together because they flag problems that financial KPIs often miss:
loss of executive sponsorship
one side regularly sending unauthorized representatives
action items piling up with one partner
Weak participation is not just a morale problem. It turns into slower decisions and more friction across the JV. When those patterns stick around, decision flow tends to slow next.
4. Decision And Resolution Effectiveness
Decision and Resolution Scorecard
Once structure, compliance, and participation are working, the next pressure test is decision flow. When approvals drag on and disputes sit unresolved, governance is starting to break down.
A practical scorecard should focus on four metrics: decision cycle time, deadlock rate, authority clarity, and dispute-resolution cycle time. Track the average number of days needed to resolve material decisions, the share of material decisions that are deferred or deadlocked each quarter, an authority clarity score based on short partner surveys tied to escalated or disputed decisions, and the average number of days from dispute filing to resolution.[18][2][4] These metrics point to two things that matter most: faster decisions and faster resolution.
JV dispute resolution usually follows a tiered path. It starts with internal escalation, then moves to mediation, expert determination, or arbitration if needed. The scorecard should reflect that path by showing where disputes get resolved and where they stall.[5][20]
Set clear tripwires so problems don’t linger:
Escalate any dispute that remains unresolved after 30 days
Trigger a governance review if average decision time goes beyond 21 days[2][19]
One construction JV showed how much this can change outcomes. A structured conflict ladder and a dedicated governance manager cut resolution time and reduced parent escalations.[18][14]
Keep the scorecard tight - four to six metrics is enough - then roll them into a single JV dashboard.
Integrating Governance KPI Models Into a JV Monitoring System
Once the scorecards are set, the next step is to bring them into one monitoring system. Seven separate scorecards don’t give leaders more clarity. They create noise. The goal is a single architecture where each model feeds the right governance layer and lands with the right decision-maker.
By ownership, the JV board should hold the top layer: a tight scoreboard of outcome-level indicators tied to strategic value, major risks, and partner satisfaction.[3][21] The steering committee should own the driver metrics drawn from the scorecards above.[3][26] The audit and risk committee should focus on control indicators such as compliance scores, open audit findings, and risk heat maps.[21][25] Working groups and the PMO should maintain the granular, process-level data that feeds everything upstream.[19][26] To keep this clean, document each KPI’s owner, backup, cadence, and escalation path in a governance map.[23][24]
The review rhythm matters just as much as ownership. If the cadence is too loose, issues linger. If it’s too heavy, people tune out. A three-tier rhythm usually keeps the system working without flooding teams with meetings:
Review Type | Frequency | Led By | Focus |
|---|---|---|---|
Operational Review | Monthly | Working Groups + JV Management | Leading indicators and corrective actions |
Governance Review | Quarterly | Steering Committee + Audit/Risk Committee | Consolidated scorecard, risk heat map, conflict resolution outcomes |
Strategic Refresh | Annual | Board | JV thesis, governance model, parent commitments |
A shared data dictionary is the part many teams skip, and it’s often where problems start. Use one dictionary for all partners. Store each KPI definition in a central repository, including the numerator, denominator, time window, data source, and owner.[8][12] If a definition needs to change, route it through a formal approval process instead of letting it shift quietly between reporting cycles. Otherwise, the same metric starts showing different numbers in different rooms, and the board ends up arguing about the math instead of making decisions.
Dashboard design is another common weak spot. The board view should fit on one page and show the current value, variance to target, trend direction, and red/amber/green status for each metric.[21][3] Committees can go one layer deeper with trend strips and heat maps. Operational dashboards can carry more detail, but each view should still end with actions in flight and decisions requested.[21][22]
Escalation thresholds should be built in from day one. Set amber and red triggers for each model so material issues rise on their own, not because someone happened to spot them late.[27][28] When built this way, the dashboard does more than report performance. It shapes the agenda, pushes escalation when needed, and makes follow-up harder to dodge.
Conclusion
Taken together, these seven models turn governance into one monitoring system. JV governance starts to work in practice when partners track a small, agreed set of KPIs across governance structure, compliance and risk oversight, trust, participation, decision flow, conflict resolution, and shared value. The seven KPI models covered in this article give leadership teams a practical blueprint for moving governance from informal judgment calls to data-backed governance.
Research shows governance gaps are a major driver of JV underperformance [10]. Structured KPI models address that gap head-on by making governance visible, comparable, and actionable across reporting cycles.
These dashboards do more than flag risk early. When governance dashboards include relational and value-creation metrics alongside risk and compliance indicators, they bring those signals into one board-ready operating view. The result is a single system that links structure, control, relationships, decisions, and value creation, instead of repeating each metric type in isolation.
In sustainability and infrastructure JVs, the same scorecard logic can link partner behavior to climate, circularity, and resilience outcomes.
That is the practical test of governance maturity. Strong dashboards surface issues early and keep partners aligned on purpose. Start with a lean set of agreed indicators, review them quarterly, and tie them to board action. Over time, that discipline is what separates joint ventures that endure from those that fail to do so.
FAQs
How do I choose the right 5 to 8 JV governance KPIs?
Choose 5 to 8 governance KPIs that match your project goals and reflect what stakeholders care about. Use the SMART framework so each target is specific, measurable, achievable, relevant, and time-bound.
Aim for a balanced mix. Include hard numbers, such as compliance rates or emissions cuts, but also make room for softer signals like stakeholder satisfaction or trust. That mix gives you a better read on how things are going, not just on paper, but in practice.
Review your KPIs on a regular basis. Projects shift, stakeholder needs change, and priorities can move faster than expected. A metric that made sense six months ago may not tell you much today.
Which governance KPIs should a new joint venture track first?
Start with governance KPIs that bring day-to-day clarity, clear ownership, and a solid base of trust. Put compliance rate and policy alignment at the top of the list so you can confirm partners are meeting legal requirements and working within the same rules.
It also helps to watch decision-making timelines, conflict resolution speed, and partner satisfaction or Net Promoter Scores. Those measures give you an early read on efficiency, transparency, and the overall health of the relationship.
How can trust and relationship health be measured objectively in a JV?
Use a balanced framework that blends surveys with behavioral data. Surveys can track partner satisfaction, confidence, and perceived reliability through tools like Partner NPS or Likert scales.
Pair that with objective signals. Look at participation in strategic sessions, response times, conflict resolution time, and interaction quality on a 1–5 scale. Independent third-party reviews can also help spot blind spots and cut internal bias.
Related Blog Posts
Latest Articles
©2025

Narrative Change and Power Building: The Missing Half of Advocacy
Narrative change is the process of disrupting dominant narratives that normalize inequity and advancing new narratives from historically marginalized communities.

Funding Resilience Without Federal Grants
BRIC is unreliable and FEMA is shrinking. Here's how cities fund climate resilience with dedicated revenue, blended finance, and a coordinating authority.

The ESG Blind Spot: How AI Is Finding Risks in Companies Nobody Else Is Watching
Norway's sovereign wealth fund uses AI to screen 7,200 portfolio companies for forced labor and corruption within 24 hours. The real story is the emerging-market coverage gap that traditional ESG data vendors miss — and what it means for any company with a global supply chain.
Narrative Change and Power Building: The Missing Half of Advocacy
Narrative change is the process of disrupting dominant narratives that normalize inequity and advancing new narratives from historically marginalized communities.
Funding Resilience Without Federal Grants
BRIC is unreliable and FEMA is shrinking. Here's how cities fund climate resilience with dedicated revenue, blended finance, and a coordinating authority.
The ESG Blind Spot: How AI Is Finding Risks in Companies Nobody Else Is Watching
Norway's sovereign wealth fund uses AI to screen 7,200 portfolio companies for forced labor and corruption within 24 hours. The real story is the emerging-market coverage gap that traditional ESG data vendors miss — and what it means for any company with a global supply chain.
FAQ
01
What does it really mean to “redefine profit”?
02
What makes Council Fire different?
03
Who does Council Fire work with?
04
What does working with Council Fire actually look like?
05
How does Council Fire help organizations turn big goals into action?
06
How does Council Fire define and measure success?
Aug 13, 2026
7 Governance KPI Models for Joint Ventures
Governance
In This Article
Seven practical KPI models to spot JV governance issues early—structure, compliance, board flow, info quality, participation, trust, disputes.
7 Governance KPI Models for Joint Ventures
If you want a joint venture to stay on track, measure governance early - not after results slip. I’d boil this article down to seven KPI models that show where a JV is slowing down: structure and control, compliance and risk, board and committee flow, information quality, participation, trust, dispute handling, and shared value tracking.
Here’s the short version:
I’d use 5 to 8 KPIs, not a long list
I’d pair hard metrics like cycle time, closure rate, and attendance with survey scores on trust and confidence
I’d track warning signs such as:
slow approvals
old governance documents
late board packs
open audit items
low attendance
deadlocks
disputes that sit too long
I’d review them on a simple rhythm:
monthly for management teams
quarterly for governance groups
annually for the board
A few numbers from the article make the case. One study found a median JV governance score of 5.4/10, and just 9% were rated strong. Another found trust had a 0.54 link with alliance performance. In other words, weak governance often shows up before financial results turn bad.
7 Joint Venture Governance KPI Models: What to Measure & Why
Quick Comparison
KPI model | What I’d measure | Main signal |
|---|---|---|
Structure and control | current documents, decision-rights clarity, reserved-matter cycle time | whether the JV knows who decides what |
Compliance and risk | policy coverage, training, audit closure, risk items open too long | whether controls are working |
Board and committee flow | attendance, action closure, decision time | whether governance groups are moving work |
Information quality | on-time board packs, late submissions, clarity of inputs | whether people have what they need to decide |
Participation | attendance, response rates, action follow-through by partner | whether each side is showing up and doing its part |
Trust and relationship health | trust score, openness, partner confidence, escalation patterns | whether the relationship is holding |
Dispute and shared value tracking | dispute volume, resolution time, milestone delivery, partner value scores | whether conflict is being handled and goals are being met |
What I like about this model set is simple: it turns governance into something you can see, review, and fix.
What Governance KPIs Need To Measure In Joint Ventures
JV governance issues tend to show up before the numbers on the income statement start looking bad. You see them in slow approvals, disputes that sit unresolved, commitments that slip, and partners who stop sharing information in a frank way.
To keep that from turning into a bigger problem, track seven core dimensions: compliance and risk oversight, board/committee effectiveness, information quality, participation, trust, dispute management, and shared value and sustainability outcomes. Each one points to a different way a partnership can work well - or quietly start to fray. The seven KPI models below turn those signals into scorecards a board can actually use.
The key is to match the metric to the signal you want to track. Use percentages for completion and compliance rates. Use counts for one-off events such as disputes or late submissions. Use cycle times to show how long decisions or resolutions take. Use closure rates to show whether actions get finished instead of just logged. For perception-based areas like trust, perceived fairness, and board confidence, 1 to 5 rating scales or survey-based indices usually tell you more than raw totals. Research on international joint ventures measures trust through survey items tied to openness and restraint in escalating conflict, which shows that these softer factors can still be tracked with rigor.[6] Hard metrics show process discipline. Survey metrics show relationship health.
A simple way to build the set is to pair each dimension with one hard KPI and one soft signal.
Governance Dimension | Quantitative Examples | Qualitative Examples |
|---|---|---|
Compliance and risk oversight | Audit findings closed, control breaches, incidents | Risk awareness, integrity culture |
Board/committee effectiveness | Attendance rate, decision cycle time, action closure | Deliberation quality, confidence in board judgment |
Information quality | Meeting packs distributed on time, late submissions | Completeness, clarity, timeliness of shared information |
Participation | Meeting attendance, response rates, submission timeliness | Engagement quality, perceived inclusion |
Trust and relationship health | Disputes escalated, time to resolution | Openness, perceived fairness, collaboration |
Dispute management | Disputes filed, escalation rate, resolution cycle time | Perceived fairness of process, partner confidence |
Shared value and sustainability outcomes | Milestone completion, cost savings, sustainability metrics | Partner satisfaction, perceived value creation |
Keep the KPI set to 5 to 8 measures. That’s usually enough to cover the main governance risks without burying the board in too much data. The first model starts with governance structure and control.
1. Governance Structure And Control
Governance structure often looks stronger on paper than it is in practice. One study of large JVs found a median score of 5.4/10, and only 9% were rated strong.[1][10] That gap matters. A board can have charters, approval matrices, and reserved-matter lists, yet still struggle when real decisions hit the table.
Two KPIs help make this visible: one for document control and one for decision rights. Start with document control. If the core governance documents are out of date, missing, or sitting in draft form, the rest of the structure is already on shaky ground. Then look at decision rights to see whether the setup works when people need to act.
Governance Structure Completeness Index measures the share of required governance documents that are current and approved. This includes the JV charter, committee charters, reserved-matter list, delegation of authority matrix, and accountability map. The score is:
approved current documents ÷ required documents × 100
The target is 95%+, reviewed quarterly.[7][8]
This KPI does more than check whether documents exist. It shows whether the operating rules are still current. That matters because stale governance documents can quietly cause delays, overlap, and finger-pointing.
The second KPI, Decision-Rights Clarity Score, tests whether people actually know who owns key decisions. It works as a short annual survey sent to senior managers and parent representatives. Each person gets a standard set of decisions - capital expenditure approvals, senior hires, and new market entry - and is asked to name the decision owner for each one. The KPI is the percentage of respondents who correctly assign at least 80% of scenarios to the right decision owner.[8]
That’s not a soft issue. A BCG survey found that one in three failed JVs can trace problems to boards that lacked clear decision rights, disciplined governance processes, or a commitment to act in the JV's best interests.[9] In plain English: when nobody knows who gets the call, the JV slows down or drifts.
It helps to pair that survey result with a hard operating measure: the average decision cycle time for reserved matters, tracked in days from proposal submission to final board resolution.[7][8][1] Put the two together and you get a clearer read on governance. One shows whether decision ownership is understood. The other shows whether that clarity leads to timely action.
Once structure and control are visible, the next test is whether compliance and risk oversight are working.
2. Compliance And Risk Oversight
Once decision rights are clear, the next question is simple: Is the JV still operating inside its guardrails? That’s where two KPI models help most - a compliance maturity index and a risk exposure and mitigation scorecard.
Compliance Maturity Index
This composite score tracks policy coverage, training completion, incidents, audit closure, and hotline use and closure rates. Each area is scored on a set scale - for example, a five-level range from "Initial" to "Optimized" - and then rolled into one index for quarterly review.
Aim for 95%+ policy coverage across antitrust, anti-corruption, privacy, and environmental rules. Annual training completion should top 90% for all staff and key contractors. Moderate-risk audit findings should close within 90 days, and high-risk issues should move faster.[11] The DOJ's guidance on effective compliance programs is a good benchmark for setting these thresholds.
Risk Exposure and Mitigation Scorecard
Track top risks - strategic, operational, financial, legal, and ESG - on a 1–5 likelihood × impact scale. That product gives the inherent risk score. Residual risk is what remains after controls are in place.
Report the share of top risks with full mitigation plans, along with the count of residual-risk items scored at 15+ that have stayed unresolved for 90+ days.[11] Any 4×4 risk should move to the next board agenda, along with mitigation options and estimated dollar exposure.[11]
This KPI only matters if it changes behavior. It should affect board agendas, assign clear owners, and set follow-up timing. When controls start to slip, the warning signs usually show up early: delayed escalation, open findings that sit too long, and patchy accountability across partners.
Together, these models shift compliance from hindsight to early warning. Next, measure whether partners are still working together well enough for governance to function.
3. Relational And Participation Health
Once compliance is in hand, the next check is simpler but no less serious: does the partnership still have the trust and day-to-day participation needed to keep moving? Relational and participation models help answer that. They show whether partners are still aligned, still engaged, and still willing to work side by side.
Relationship Health Scorecard
This scorecard tracks the health of the partnership across trust, communication, executive engagement, and commitment to shared goals. The link between these factors and JV performance is stronger than many teams assume. A meta-analysis of 64 empirical studies found that interorganizational trust was strongly related to alliance performance, with a corrected correlation of 0.54 across N = 6,880, and that communication between alliance partners showed a particularly strong positive association with trust, at 0.63 across N = 2,941.[17] That is not a vague, feel-good signal. It is an early sign of whether the JV can stay intact under pressure.
A practical approach is to score trust, commitment reliability, information sharing, and executive engagement each quarter on a 1–5 scale or by red/amber/green status. Any amber or red rating should come with a written rationale, a named owner, and a due date for corrective action.[15] That small step matters. It turns concern into something visible and trackable. In one business-alliance study, joint ventures averaged 4.0/5 for trust and 4.3/5 for success.[16]
Participation Index
If the relationship scorecard shows how people feel and how well the partnership is holding together, the participation index looks at what people actually do. It tracks observable behavior: attendance, authorized representation, repeat participation, and on-time action closure by partner.
Some scorecards use 80%+ attendance from key stakeholders at major milestones and a repeat participation rate above 50%.[13] Follow-through should be tracked through the on-time completion rate of governance action items by each partner, along with the number of open items past due by owner.[15]
These two models work well together because they flag problems that financial KPIs often miss:
loss of executive sponsorship
one side regularly sending unauthorized representatives
action items piling up with one partner
Weak participation is not just a morale problem. It turns into slower decisions and more friction across the JV. When those patterns stick around, decision flow tends to slow next.
4. Decision And Resolution Effectiveness
Decision and Resolution Scorecard
Once structure, compliance, and participation are working, the next pressure test is decision flow. When approvals drag on and disputes sit unresolved, governance is starting to break down.
A practical scorecard should focus on four metrics: decision cycle time, deadlock rate, authority clarity, and dispute-resolution cycle time. Track the average number of days needed to resolve material decisions, the share of material decisions that are deferred or deadlocked each quarter, an authority clarity score based on short partner surveys tied to escalated or disputed decisions, and the average number of days from dispute filing to resolution.[18][2][4] These metrics point to two things that matter most: faster decisions and faster resolution.
JV dispute resolution usually follows a tiered path. It starts with internal escalation, then moves to mediation, expert determination, or arbitration if needed. The scorecard should reflect that path by showing where disputes get resolved and where they stall.[5][20]
Set clear tripwires so problems don’t linger:
Escalate any dispute that remains unresolved after 30 days
Trigger a governance review if average decision time goes beyond 21 days[2][19]
One construction JV showed how much this can change outcomes. A structured conflict ladder and a dedicated governance manager cut resolution time and reduced parent escalations.[18][14]
Keep the scorecard tight - four to six metrics is enough - then roll them into a single JV dashboard.
Integrating Governance KPI Models Into a JV Monitoring System
Once the scorecards are set, the next step is to bring them into one monitoring system. Seven separate scorecards don’t give leaders more clarity. They create noise. The goal is a single architecture where each model feeds the right governance layer and lands with the right decision-maker.
By ownership, the JV board should hold the top layer: a tight scoreboard of outcome-level indicators tied to strategic value, major risks, and partner satisfaction.[3][21] The steering committee should own the driver metrics drawn from the scorecards above.[3][26] The audit and risk committee should focus on control indicators such as compliance scores, open audit findings, and risk heat maps.[21][25] Working groups and the PMO should maintain the granular, process-level data that feeds everything upstream.[19][26] To keep this clean, document each KPI’s owner, backup, cadence, and escalation path in a governance map.[23][24]
The review rhythm matters just as much as ownership. If the cadence is too loose, issues linger. If it’s too heavy, people tune out. A three-tier rhythm usually keeps the system working without flooding teams with meetings:
Review Type | Frequency | Led By | Focus |
|---|---|---|---|
Operational Review | Monthly | Working Groups + JV Management | Leading indicators and corrective actions |
Governance Review | Quarterly | Steering Committee + Audit/Risk Committee | Consolidated scorecard, risk heat map, conflict resolution outcomes |
Strategic Refresh | Annual | Board | JV thesis, governance model, parent commitments |
A shared data dictionary is the part many teams skip, and it’s often where problems start. Use one dictionary for all partners. Store each KPI definition in a central repository, including the numerator, denominator, time window, data source, and owner.[8][12] If a definition needs to change, route it through a formal approval process instead of letting it shift quietly between reporting cycles. Otherwise, the same metric starts showing different numbers in different rooms, and the board ends up arguing about the math instead of making decisions.
Dashboard design is another common weak spot. The board view should fit on one page and show the current value, variance to target, trend direction, and red/amber/green status for each metric.[21][3] Committees can go one layer deeper with trend strips and heat maps. Operational dashboards can carry more detail, but each view should still end with actions in flight and decisions requested.[21][22]
Escalation thresholds should be built in from day one. Set amber and red triggers for each model so material issues rise on their own, not because someone happened to spot them late.[27][28] When built this way, the dashboard does more than report performance. It shapes the agenda, pushes escalation when needed, and makes follow-up harder to dodge.
Conclusion
Taken together, these seven models turn governance into one monitoring system. JV governance starts to work in practice when partners track a small, agreed set of KPIs across governance structure, compliance and risk oversight, trust, participation, decision flow, conflict resolution, and shared value. The seven KPI models covered in this article give leadership teams a practical blueprint for moving governance from informal judgment calls to data-backed governance.
Research shows governance gaps are a major driver of JV underperformance [10]. Structured KPI models address that gap head-on by making governance visible, comparable, and actionable across reporting cycles.
These dashboards do more than flag risk early. When governance dashboards include relational and value-creation metrics alongside risk and compliance indicators, they bring those signals into one board-ready operating view. The result is a single system that links structure, control, relationships, decisions, and value creation, instead of repeating each metric type in isolation.
In sustainability and infrastructure JVs, the same scorecard logic can link partner behavior to climate, circularity, and resilience outcomes.
That is the practical test of governance maturity. Strong dashboards surface issues early and keep partners aligned on purpose. Start with a lean set of agreed indicators, review them quarterly, and tie them to board action. Over time, that discipline is what separates joint ventures that endure from those that fail to do so.
FAQs
How do I choose the right 5 to 8 JV governance KPIs?
Choose 5 to 8 governance KPIs that match your project goals and reflect what stakeholders care about. Use the SMART framework so each target is specific, measurable, achievable, relevant, and time-bound.
Aim for a balanced mix. Include hard numbers, such as compliance rates or emissions cuts, but also make room for softer signals like stakeholder satisfaction or trust. That mix gives you a better read on how things are going, not just on paper, but in practice.
Review your KPIs on a regular basis. Projects shift, stakeholder needs change, and priorities can move faster than expected. A metric that made sense six months ago may not tell you much today.
Which governance KPIs should a new joint venture track first?
Start with governance KPIs that bring day-to-day clarity, clear ownership, and a solid base of trust. Put compliance rate and policy alignment at the top of the list so you can confirm partners are meeting legal requirements and working within the same rules.
It also helps to watch decision-making timelines, conflict resolution speed, and partner satisfaction or Net Promoter Scores. Those measures give you an early read on efficiency, transparency, and the overall health of the relationship.
How can trust and relationship health be measured objectively in a JV?
Use a balanced framework that blends surveys with behavioral data. Surveys can track partner satisfaction, confidence, and perceived reliability through tools like Partner NPS or Likert scales.
Pair that with objective signals. Look at participation in strategic sessions, response times, conflict resolution time, and interaction quality on a 1–5 scale. Independent third-party reviews can also help spot blind spots and cut internal bias.
Related Blog Posts
Latest Articles
©2025
Narrative Change and Power Building: The Missing Half of Advocacy
Narrative change is the process of disrupting dominant narratives that normalize inequity and advancing new narratives from historically marginalized communities.
Funding Resilience Without Federal Grants
BRIC is unreliable and FEMA is shrinking. Here's how cities fund climate resilience with dedicated revenue, blended finance, and a coordinating authority.
The ESG Blind Spot: How AI Is Finding Risks in Companies Nobody Else Is Watching
Norway's sovereign wealth fund uses AI to screen 7,200 portfolio companies for forced labor and corruption within 24 hours. The real story is the emerging-market coverage gap that traditional ESG data vendors miss — and what it means for any company with a global supply chain.
FAQ
01
What does it really mean to “redefine profit”?
02
What makes Council Fire different?
03
Who does Council Fire work with?
04
What does working with Council Fire actually look like?
05
How does Council Fire help organizations turn big goals into action?
06
How does Council Fire define and measure success?
Aug 13, 2026
7 Governance KPI Models for Joint Ventures
Governance
In This Article
Seven practical KPI models to spot JV governance issues early—structure, compliance, board flow, info quality, participation, trust, disputes.
7 Governance KPI Models for Joint Ventures
If you want a joint venture to stay on track, measure governance early - not after results slip. I’d boil this article down to seven KPI models that show where a JV is slowing down: structure and control, compliance and risk, board and committee flow, information quality, participation, trust, dispute handling, and shared value tracking.
Here’s the short version:
I’d use 5 to 8 KPIs, not a long list
I’d pair hard metrics like cycle time, closure rate, and attendance with survey scores on trust and confidence
I’d track warning signs such as:
slow approvals
old governance documents
late board packs
open audit items
low attendance
deadlocks
disputes that sit too long
I’d review them on a simple rhythm:
monthly for management teams
quarterly for governance groups
annually for the board
A few numbers from the article make the case. One study found a median JV governance score of 5.4/10, and just 9% were rated strong. Another found trust had a 0.54 link with alliance performance. In other words, weak governance often shows up before financial results turn bad.
7 Joint Venture Governance KPI Models: What to Measure & Why
Quick Comparison
KPI model | What I’d measure | Main signal |
|---|---|---|
Structure and control | current documents, decision-rights clarity, reserved-matter cycle time | whether the JV knows who decides what |
Compliance and risk | policy coverage, training, audit closure, risk items open too long | whether controls are working |
Board and committee flow | attendance, action closure, decision time | whether governance groups are moving work |
Information quality | on-time board packs, late submissions, clarity of inputs | whether people have what they need to decide |
Participation | attendance, response rates, action follow-through by partner | whether each side is showing up and doing its part |
Trust and relationship health | trust score, openness, partner confidence, escalation patterns | whether the relationship is holding |
Dispute and shared value tracking | dispute volume, resolution time, milestone delivery, partner value scores | whether conflict is being handled and goals are being met |
What I like about this model set is simple: it turns governance into something you can see, review, and fix.
What Governance KPIs Need To Measure In Joint Ventures
JV governance issues tend to show up before the numbers on the income statement start looking bad. You see them in slow approvals, disputes that sit unresolved, commitments that slip, and partners who stop sharing information in a frank way.
To keep that from turning into a bigger problem, track seven core dimensions: compliance and risk oversight, board/committee effectiveness, information quality, participation, trust, dispute management, and shared value and sustainability outcomes. Each one points to a different way a partnership can work well - or quietly start to fray. The seven KPI models below turn those signals into scorecards a board can actually use.
The key is to match the metric to the signal you want to track. Use percentages for completion and compliance rates. Use counts for one-off events such as disputes or late submissions. Use cycle times to show how long decisions or resolutions take. Use closure rates to show whether actions get finished instead of just logged. For perception-based areas like trust, perceived fairness, and board confidence, 1 to 5 rating scales or survey-based indices usually tell you more than raw totals. Research on international joint ventures measures trust through survey items tied to openness and restraint in escalating conflict, which shows that these softer factors can still be tracked with rigor.[6] Hard metrics show process discipline. Survey metrics show relationship health.
A simple way to build the set is to pair each dimension with one hard KPI and one soft signal.
Governance Dimension | Quantitative Examples | Qualitative Examples |
|---|---|---|
Compliance and risk oversight | Audit findings closed, control breaches, incidents | Risk awareness, integrity culture |
Board/committee effectiveness | Attendance rate, decision cycle time, action closure | Deliberation quality, confidence in board judgment |
Information quality | Meeting packs distributed on time, late submissions | Completeness, clarity, timeliness of shared information |
Participation | Meeting attendance, response rates, submission timeliness | Engagement quality, perceived inclusion |
Trust and relationship health | Disputes escalated, time to resolution | Openness, perceived fairness, collaboration |
Dispute management | Disputes filed, escalation rate, resolution cycle time | Perceived fairness of process, partner confidence |
Shared value and sustainability outcomes | Milestone completion, cost savings, sustainability metrics | Partner satisfaction, perceived value creation |
Keep the KPI set to 5 to 8 measures. That’s usually enough to cover the main governance risks without burying the board in too much data. The first model starts with governance structure and control.
1. Governance Structure And Control
Governance structure often looks stronger on paper than it is in practice. One study of large JVs found a median score of 5.4/10, and only 9% were rated strong.[1][10] That gap matters. A board can have charters, approval matrices, and reserved-matter lists, yet still struggle when real decisions hit the table.
Two KPIs help make this visible: one for document control and one for decision rights. Start with document control. If the core governance documents are out of date, missing, or sitting in draft form, the rest of the structure is already on shaky ground. Then look at decision rights to see whether the setup works when people need to act.
Governance Structure Completeness Index measures the share of required governance documents that are current and approved. This includes the JV charter, committee charters, reserved-matter list, delegation of authority matrix, and accountability map. The score is:
approved current documents ÷ required documents × 100
The target is 95%+, reviewed quarterly.[7][8]
This KPI does more than check whether documents exist. It shows whether the operating rules are still current. That matters because stale governance documents can quietly cause delays, overlap, and finger-pointing.
The second KPI, Decision-Rights Clarity Score, tests whether people actually know who owns key decisions. It works as a short annual survey sent to senior managers and parent representatives. Each person gets a standard set of decisions - capital expenditure approvals, senior hires, and new market entry - and is asked to name the decision owner for each one. The KPI is the percentage of respondents who correctly assign at least 80% of scenarios to the right decision owner.[8]
That’s not a soft issue. A BCG survey found that one in three failed JVs can trace problems to boards that lacked clear decision rights, disciplined governance processes, or a commitment to act in the JV's best interests.[9] In plain English: when nobody knows who gets the call, the JV slows down or drifts.
It helps to pair that survey result with a hard operating measure: the average decision cycle time for reserved matters, tracked in days from proposal submission to final board resolution.[7][8][1] Put the two together and you get a clearer read on governance. One shows whether decision ownership is understood. The other shows whether that clarity leads to timely action.
Once structure and control are visible, the next test is whether compliance and risk oversight are working.
2. Compliance And Risk Oversight
Once decision rights are clear, the next question is simple: Is the JV still operating inside its guardrails? That’s where two KPI models help most - a compliance maturity index and a risk exposure and mitigation scorecard.
Compliance Maturity Index
This composite score tracks policy coverage, training completion, incidents, audit closure, and hotline use and closure rates. Each area is scored on a set scale - for example, a five-level range from "Initial" to "Optimized" - and then rolled into one index for quarterly review.
Aim for 95%+ policy coverage across antitrust, anti-corruption, privacy, and environmental rules. Annual training completion should top 90% for all staff and key contractors. Moderate-risk audit findings should close within 90 days, and high-risk issues should move faster.[11] The DOJ's guidance on effective compliance programs is a good benchmark for setting these thresholds.
Risk Exposure and Mitigation Scorecard
Track top risks - strategic, operational, financial, legal, and ESG - on a 1–5 likelihood × impact scale. That product gives the inherent risk score. Residual risk is what remains after controls are in place.
Report the share of top risks with full mitigation plans, along with the count of residual-risk items scored at 15+ that have stayed unresolved for 90+ days.[11] Any 4×4 risk should move to the next board agenda, along with mitigation options and estimated dollar exposure.[11]
This KPI only matters if it changes behavior. It should affect board agendas, assign clear owners, and set follow-up timing. When controls start to slip, the warning signs usually show up early: delayed escalation, open findings that sit too long, and patchy accountability across partners.
Together, these models shift compliance from hindsight to early warning. Next, measure whether partners are still working together well enough for governance to function.
3. Relational And Participation Health
Once compliance is in hand, the next check is simpler but no less serious: does the partnership still have the trust and day-to-day participation needed to keep moving? Relational and participation models help answer that. They show whether partners are still aligned, still engaged, and still willing to work side by side.
Relationship Health Scorecard
This scorecard tracks the health of the partnership across trust, communication, executive engagement, and commitment to shared goals. The link between these factors and JV performance is stronger than many teams assume. A meta-analysis of 64 empirical studies found that interorganizational trust was strongly related to alliance performance, with a corrected correlation of 0.54 across N = 6,880, and that communication between alliance partners showed a particularly strong positive association with trust, at 0.63 across N = 2,941.[17] That is not a vague, feel-good signal. It is an early sign of whether the JV can stay intact under pressure.
A practical approach is to score trust, commitment reliability, information sharing, and executive engagement each quarter on a 1–5 scale or by red/amber/green status. Any amber or red rating should come with a written rationale, a named owner, and a due date for corrective action.[15] That small step matters. It turns concern into something visible and trackable. In one business-alliance study, joint ventures averaged 4.0/5 for trust and 4.3/5 for success.[16]
Participation Index
If the relationship scorecard shows how people feel and how well the partnership is holding together, the participation index looks at what people actually do. It tracks observable behavior: attendance, authorized representation, repeat participation, and on-time action closure by partner.
Some scorecards use 80%+ attendance from key stakeholders at major milestones and a repeat participation rate above 50%.[13] Follow-through should be tracked through the on-time completion rate of governance action items by each partner, along with the number of open items past due by owner.[15]
These two models work well together because they flag problems that financial KPIs often miss:
loss of executive sponsorship
one side regularly sending unauthorized representatives
action items piling up with one partner
Weak participation is not just a morale problem. It turns into slower decisions and more friction across the JV. When those patterns stick around, decision flow tends to slow next.
4. Decision And Resolution Effectiveness
Decision and Resolution Scorecard
Once structure, compliance, and participation are working, the next pressure test is decision flow. When approvals drag on and disputes sit unresolved, governance is starting to break down.
A practical scorecard should focus on four metrics: decision cycle time, deadlock rate, authority clarity, and dispute-resolution cycle time. Track the average number of days needed to resolve material decisions, the share of material decisions that are deferred or deadlocked each quarter, an authority clarity score based on short partner surveys tied to escalated or disputed decisions, and the average number of days from dispute filing to resolution.[18][2][4] These metrics point to two things that matter most: faster decisions and faster resolution.
JV dispute resolution usually follows a tiered path. It starts with internal escalation, then moves to mediation, expert determination, or arbitration if needed. The scorecard should reflect that path by showing where disputes get resolved and where they stall.[5][20]
Set clear tripwires so problems don’t linger:
Escalate any dispute that remains unresolved after 30 days
Trigger a governance review if average decision time goes beyond 21 days[2][19]
One construction JV showed how much this can change outcomes. A structured conflict ladder and a dedicated governance manager cut resolution time and reduced parent escalations.[18][14]
Keep the scorecard tight - four to six metrics is enough - then roll them into a single JV dashboard.
Integrating Governance KPI Models Into a JV Monitoring System
Once the scorecards are set, the next step is to bring them into one monitoring system. Seven separate scorecards don’t give leaders more clarity. They create noise. The goal is a single architecture where each model feeds the right governance layer and lands with the right decision-maker.
By ownership, the JV board should hold the top layer: a tight scoreboard of outcome-level indicators tied to strategic value, major risks, and partner satisfaction.[3][21] The steering committee should own the driver metrics drawn from the scorecards above.[3][26] The audit and risk committee should focus on control indicators such as compliance scores, open audit findings, and risk heat maps.[21][25] Working groups and the PMO should maintain the granular, process-level data that feeds everything upstream.[19][26] To keep this clean, document each KPI’s owner, backup, cadence, and escalation path in a governance map.[23][24]
The review rhythm matters just as much as ownership. If the cadence is too loose, issues linger. If it’s too heavy, people tune out. A three-tier rhythm usually keeps the system working without flooding teams with meetings:
Review Type | Frequency | Led By | Focus |
|---|---|---|---|
Operational Review | Monthly | Working Groups + JV Management | Leading indicators and corrective actions |
Governance Review | Quarterly | Steering Committee + Audit/Risk Committee | Consolidated scorecard, risk heat map, conflict resolution outcomes |
Strategic Refresh | Annual | Board | JV thesis, governance model, parent commitments |
A shared data dictionary is the part many teams skip, and it’s often where problems start. Use one dictionary for all partners. Store each KPI definition in a central repository, including the numerator, denominator, time window, data source, and owner.[8][12] If a definition needs to change, route it through a formal approval process instead of letting it shift quietly between reporting cycles. Otherwise, the same metric starts showing different numbers in different rooms, and the board ends up arguing about the math instead of making decisions.
Dashboard design is another common weak spot. The board view should fit on one page and show the current value, variance to target, trend direction, and red/amber/green status for each metric.[21][3] Committees can go one layer deeper with trend strips and heat maps. Operational dashboards can carry more detail, but each view should still end with actions in flight and decisions requested.[21][22]
Escalation thresholds should be built in from day one. Set amber and red triggers for each model so material issues rise on their own, not because someone happened to spot them late.[27][28] When built this way, the dashboard does more than report performance. It shapes the agenda, pushes escalation when needed, and makes follow-up harder to dodge.
Conclusion
Taken together, these seven models turn governance into one monitoring system. JV governance starts to work in practice when partners track a small, agreed set of KPIs across governance structure, compliance and risk oversight, trust, participation, decision flow, conflict resolution, and shared value. The seven KPI models covered in this article give leadership teams a practical blueprint for moving governance from informal judgment calls to data-backed governance.
Research shows governance gaps are a major driver of JV underperformance [10]. Structured KPI models address that gap head-on by making governance visible, comparable, and actionable across reporting cycles.
These dashboards do more than flag risk early. When governance dashboards include relational and value-creation metrics alongside risk and compliance indicators, they bring those signals into one board-ready operating view. The result is a single system that links structure, control, relationships, decisions, and value creation, instead of repeating each metric type in isolation.
In sustainability and infrastructure JVs, the same scorecard logic can link partner behavior to climate, circularity, and resilience outcomes.
That is the practical test of governance maturity. Strong dashboards surface issues early and keep partners aligned on purpose. Start with a lean set of agreed indicators, review them quarterly, and tie them to board action. Over time, that discipline is what separates joint ventures that endure from those that fail to do so.
FAQs
How do I choose the right 5 to 8 JV governance KPIs?
Choose 5 to 8 governance KPIs that match your project goals and reflect what stakeholders care about. Use the SMART framework so each target is specific, measurable, achievable, relevant, and time-bound.
Aim for a balanced mix. Include hard numbers, such as compliance rates or emissions cuts, but also make room for softer signals like stakeholder satisfaction or trust. That mix gives you a better read on how things are going, not just on paper, but in practice.
Review your KPIs on a regular basis. Projects shift, stakeholder needs change, and priorities can move faster than expected. A metric that made sense six months ago may not tell you much today.
Which governance KPIs should a new joint venture track first?
Start with governance KPIs that bring day-to-day clarity, clear ownership, and a solid base of trust. Put compliance rate and policy alignment at the top of the list so you can confirm partners are meeting legal requirements and working within the same rules.
It also helps to watch decision-making timelines, conflict resolution speed, and partner satisfaction or Net Promoter Scores. Those measures give you an early read on efficiency, transparency, and the overall health of the relationship.
How can trust and relationship health be measured objectively in a JV?
Use a balanced framework that blends surveys with behavioral data. Surveys can track partner satisfaction, confidence, and perceived reliability through tools like Partner NPS or Likert scales.
Pair that with objective signals. Look at participation in strategic sessions, response times, conflict resolution time, and interaction quality on a 1–5 scale. Independent third-party reviews can also help spot blind spots and cut internal bias.
Related Blog Posts
Latest Articles
©2025
Narrative Change and Power Building: The Missing Half of Advocacy
Narrative change is the process of disrupting dominant narratives that normalize inequity and advancing new narratives from historically marginalized communities.
Funding Resilience Without Federal Grants
BRIC is unreliable and FEMA is shrinking. Here's how cities fund climate resilience with dedicated revenue, blended finance, and a coordinating authority.
The ESG Blind Spot: How AI Is Finding Risks in Companies Nobody Else Is Watching
Norway's sovereign wealth fund uses AI to screen 7,200 portfolio companies for forced labor and corruption within 24 hours. The real story is the emerging-market coverage gap that traditional ESG data vendors miss — and what it means for any company with a global supply chain.
FAQ
What does it really mean to “redefine profit”?
What makes Council Fire different?
Who does Council Fire work with?
What does working with Council Fire actually look like?
How does Council Fire help organizations turn big goals into action?
How does Council Fire define and measure success?