
Jul 6, 2026
Frameworks for Measuring Co-Creation in Supply Chains
Sustainability Strategy
In This Article
Set shared goals, pick 5–8 joint KPIs, align governance by decision level, and review quarterly to track co-creation across partners.
Frameworks for Measuring Co-Creation in Supply Chains
Most supply chain scorecards miss the part that matters most: what partners produce together. If you want to measure co-creation, I’d keep it simple: define the shared goal, pick a small set of joint metrics, sort them by decision level, and review them on a set cycle.
Here’s the article in plain English:
Standard KPIs are too narrow. Cost, delivery, and lead time show results, but they miss shared planning, trust, learning, and joint problem-solving.
A shared framework gives partners one scorecard language. The article points to four main options: the Seven Elements Model, Six Constituents Model, Collaborative Balanced Scorecard, and SCI Hierarchy.
Joint metrics should mix hard numbers with relationship signals. Examples include shared cost savings, co-developed solutions, supplier participation, trust, and partner satisfaction.
You do not need to rebuild your system. I’d add joint KPIs to current scorecards, then link them to stakeholder and community outcomes through a Theory of Change.
Governance matters as much as the metric list. The article groups metrics across three levels - strategic, managerial, and day-to-day work - so each one ties to the right decision.
Review on a fixed rhythm. Quarterly dashboards and annual reviews help partners check progress, fix weak spots, and update KPIs as the relationship changes.
Use both numbers and discussion. Dashboards show what changed; interviews and debriefs help explain why.
What I’d take away: the best path is not more data. It is a shared measurement system built around joint outcomes, clear ownership, and regular learning.
Framework | Main use | What it measures best |
|---|---|---|
Seven Elements Model | Relationship quality | Information sharing, goal alignment, joint learning |
Six Constituents Model | Supply chain structure | Processes, systems, network setup, collaboration levels |
Collaborative Balanced Scorecard | Business value from partnership | Joint KPIs, shared gains, common performance targets |
SCI Hierarchy | Integration maturity | Visibility, information exchange, degree of integration |
Theory of Change / Collective Impact | Community and stakeholder results | How joint actions link to social and local outcomes |
If I were setting this up in a U.S. supply chain today, I’d start with 5 to 8 shared metrics, map each one to an owner, and review them every quarter with all key partners in the room.
Shared Measurement Frameworks for Multi-Partner Supply Chains
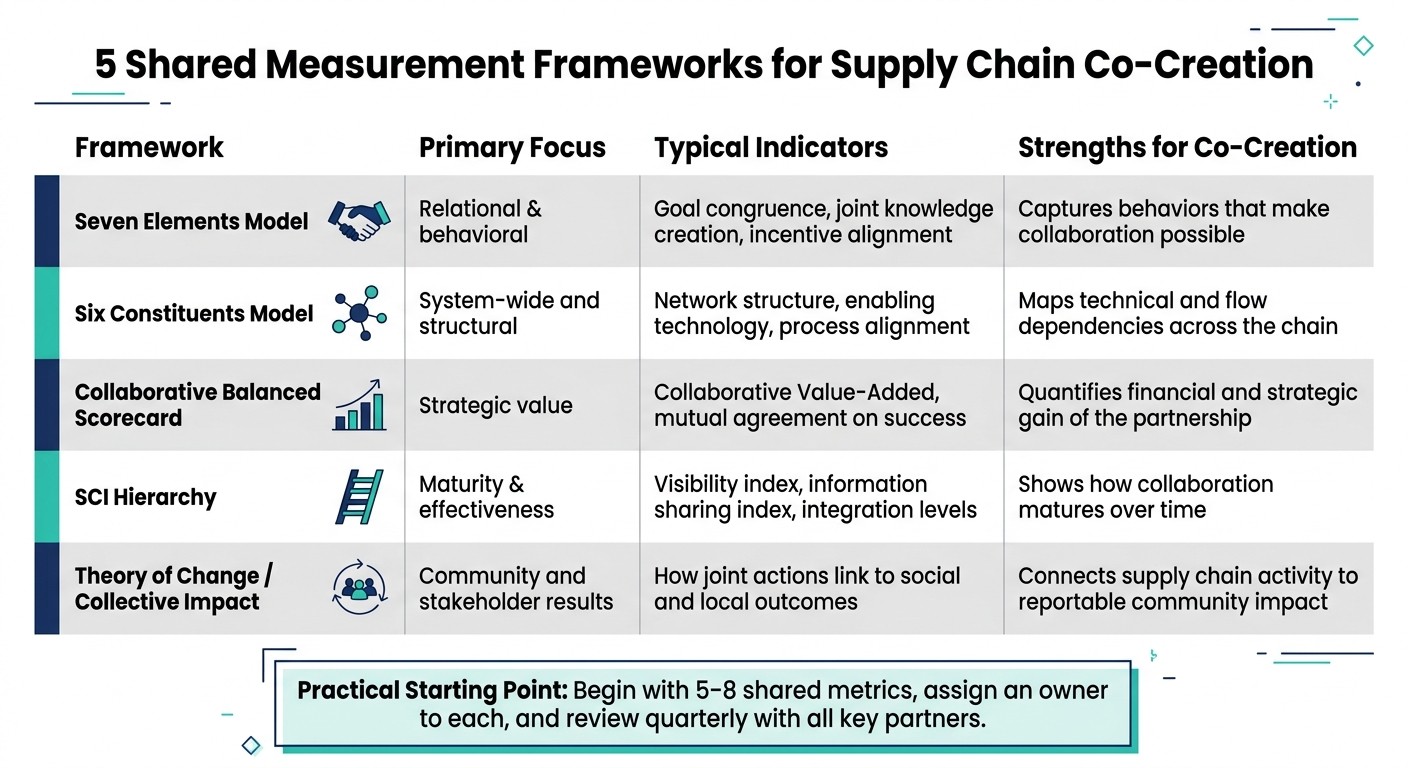
5 Shared Measurement Frameworks for Supply Chain Co-Creation
The hard part is not the amount of data. It’s getting partners to agree on the same indicators. That’s where shared measurement frameworks help. They turn collaboration from a loose idea into something teams can track, discuss, and improve together. Just as important, they give supply chain partners a common language for joint results.
Applying Collaboration Science to Supply Chain Partnerships
Collaboration science gives supply chain teams a useful way to think about measurement. Cao, Vonderembse, Zhang, and Ragu-Nathan define collaboration through seven elements: information sharing, goal congruence, decision synchronization, incentive alignment, resource sharing, collaborative communication, and joint knowledge creation [4].
This matters because process measures show more than output. Decision synchronization and joint knowledge creation reveal how partners actually work together, not just what they move through the chain [4][6]. A shipment can arrive on time while the partnership behind it is strained. These measures help surface that difference.
Using Shared Measurement to Build a Common Indicator Set
Once partners agree on how collaboration functions, the next move is deciding what to measure. A shared framework makes that step far easier. The Collaborative Balanced Scorecard (CBSC) extends the traditional balanced scorecard to quantify Collaborative Value-Added between two or more partners by arranging a common set of attributes and mutual agreement on performance measures [3].
In day-to-day use, a joint indicator set might track:
Co-developed solutions per year
Shared cost savings
Supplier participation rates
Research on the natural forest products industry points to four common collaboration practices that are worth tracking: joint sales forecasting, exchange of basic information, joint planning, and joint delivery improvement [7]. Those measures help teams see whether collaboration is happening in routine work, not just in quarterly reviews.
Governance is just as important as the metrics. The Six Constituents Model pulls together stakeholders, business strategy, processes, enabling technology, network structure, and levels of collaboration [6]. It also suggests organizing collaboration across three levels:
Strategic: capital investment and network restructuring
Managerial: forecasting and resource control
Operational: routine scheduling and stock control [6]
That structure keeps measures tied to the right decisions. A strategic issue should not be judged by an operational metric alone, and routine execution problems should not be buried in high-level reporting.
Comparison Table: Collaboration and Shared Measurement Frameworks
Framework | Primary Focus | Typical Indicators | Strengths for Co-Creation |
|---|---|---|---|
Seven Elements Model [4] | Relational & behavioral | Goal congruence, joint knowledge creation, incentive alignment | Captures the behaviors that make collaboration possible |
Six Constituents Model [6] | System-wide and structural | Network structure, enabling technology, process alignment (SCOR) | Maps technical and flow dependencies across the chain |
Collaborative BSC [3] | Strategic value | Collaborative Value-Added, mutual agreement on what success means | Quantifies the financial and strategic gain of the partnership |
SCI Hierarchy [5] | Maturity & effectiveness | Visibility index, information sharing index, integration levels | Shows how collaboration matures over time |
The next step is fitting these shared indicators into existing scorecards and sustainability reporting systems.
Extending Supply Chain and Sustainability Frameworks to Capture Co-Created Value
Once partners agree on shared indicators, the next move is to build them into the tools teams already use: scorecards, sustainability reports, and supplier systems.
Adding Joint KPIs to Existing Supply Chain Scorecards
Most organizations already have scorecards, reporting routines, and supplier platforms in place. The goal is not to start over. It’s to extend those systems so they track joint value, not just what each party does on its own.
That means adding relationship-level measures such as shared investment, joint asset use, and the time it takes to co-develop new solutions. The Collaborative Balanced Scorecard adds a Collaborative Value-Added layer without requiring a full rebuild of the scorecard [3]. If a team needs something simpler, the Decision Matrix Method (DMM) offers a lighter option by weighting co-creation indicators on a 1–10 scale [2]. It blends qualitative inputs like trust and service quality with quantitative measures like cost and delivery performance.
From there, scorecard metrics should pass through a materiality lens so the partnership focuses on outcomes that matter to stakeholders, not just numbers that are easy to collect.
Linking Materiality, Stakeholder Value, and Community Outcomes
These joint metrics become more useful when they feed into materiality-based sustainability reporting. Picking the right co-creation metrics matters just as much as the mechanics of adding them. The strongest approach is to anchor metric selection in materiality, especially impact materiality - how the partnership affects society and the environment.
A Theory of Change helps make that link visible. It connects a joint activity, such as shared training, to a reportable outcome, such as community resilience [9].
Comparison Table: Supply Chain and Sustainability Frameworks
Use business-performance frameworks for supplier partnerships, and use impact frameworks for collaborations centered on community outcomes.
Framework | Co-Creation Outcomes Captured | Data Requirements | Best Fit |
|---|---|---|---|
Collective Impact (CI) [9] | Large-scale social impact, common agenda alignment | Shared measurement systems, continuous communication | Public-private initiatives, community programs |
Collaborative Balanced Scorecard (BSC) [3] | Mutual business performance, Collaborative Value-Added | Joint KPIs, financial and operational data | Strategic supplier-buyer partnerships |
Community Capital (CC) [9] | Changes in natural, social, human, and cultural assets | Context-specific community asset mapping | Community-focused resilience programs |
Emissions reduction, waste minimization, green innovation | Environmental performance data, integration metrics | Sustainability scorecards, manufacturing partnerships | |
Decision Matrix Method (DMM) [2] | Quantified stakeholder value - financial and service-related | Weighted scores for specific indicators (1–10 scale) | SMEs, strategic supplier-buyer assessments |
When a partnership shapes both day-to-day operations and community results, it makes sense to pair a business-performance framework with an impact framework. The next piece is setting governance, reporting cadence, and learning loops.
Building a Measurement and Learning System That Works in Practice
Designing a Shared Theory of Change and Indicator Mix
Once partners agree on shared metrics, they still need a plain, usable way to run the work. A shared Theory of Change helps connect inputs, joint activities, outputs, and outcomes. That map matters because it turns a list of metrics into something more useful: joint decisions.
At the center of that map is goal congruence. Partners need the same picture of success. Just as important, incentives need to line up so risk and reward push the partnership in the same direction. From there, the indicator mix should balance hard operating measures with relationship measures. That means tracking operational KPIs such as joint delivery improvement and replenishment systems, while also watching relational signals such as trust, partner satisfaction, and learning quality.
A validated 16-item scale points to three core dimensions: process development, information sharing, and interaction [1]. Those three areas give teams a solid reference point when they build a measurement system.
Once the indicator mix is set, each metric should be tied to the right decision level. Metrics should sit across three levels:
Strategic metrics cover capital investment and network restructuring decisions.
Managerial metrics track forecasting and resource planning.
Operational metrics handle routine work such as production scheduling and stock control [6].
Labeling strategic, managerial, and operational metrics separately keeps ownership clear and cuts down on confusion when decisions need to be made.
Setting Data Governance, Reporting Cadence, and Learning Loops
Measurement falls apart fast when no one knows who owns the data or when anyone is supposed to review it. Governance sets the rules: who owns the data, who checks it, and who takes action. A simple three-tier model works well here, with operational systems for routine data, management dashboards for planning, and executive reviews for capital and network decisions [6].
For U.S.-based supply chain teams, a practical rhythm is quarterly dashboards for managerial control and fiscal-year reporting for strategic review [6]. Annual reviews are the right time to revisit joint KPIs, adjust shared investments, and decide whether to scale or restructure specific initiatives.
Dashboards alone won't tell the whole story. Pair them with debriefs or interviews to surface trust, conflict, and learning that the numbers miss [10]. Quantitative data shows what changed. Qualitative insight helps explain why.
Comparison Table: Categories of Co-Creation Metrics
Metric Category | Advantages | Limitations | Data Difficulty | Best Use Case |
|---|---|---|---|---|
Joint KPIs | Clear operational alignment; directly linked to cost savings and productivity | May overlook relational health or long-term co-created value | Low to Medium | Routine operational optimization and cost reduction |
Sustainability & Shared Value | Links supply chain efficiency to environmental and social impact; supports resource sharing and circular economy integration | Can become an administrative burden if not tied to core strategy | Medium to High | ESG reporting, circular economy initiatives, and community-impact programs |
Relational Indicators | Captures trust, commitment, and reciprocity; predicts long-term partnership stability | Highly subjective; difficult to quantify without surveys or interviews | High | Strategic alliances, high-innovation partnerships, and co-development programs |
Conclusion: A Practical Path to Measuring Co-Creation at Scale
Measuring co-creation is hard for a simple reason: standard KPIs are built to track efficiency, not shared trust, information flow, or joint problem-solving. Yet those are the things that make co-creation work. Because co-creation relies on partner resources working together, no single operating metric can show the full picture. The practical move is to build a shared system that brings together joint metrics, governance, and learning.
In practice, teams can begin with a shared theory of change and a small set of indicators. A three-part lens - process development, information sharing, and interaction - gives organizations a solid place to start when shaping co-creation metrics. From there, the work becomes more manageable: extend existing scorecards to reflect collaborative value-added attributes, combine quantitative dashboards with regular learning loops, and tier metrics across strategic, managerial, and operational levels. That gives teams a working system without forcing them to rebuild everything from zero.
That step from strategy to shared metrics is where Council Fire's systems-thinking approach can help. For organizations turning sustainability goals into supply-chain metrics, a systems-thinking partner like Council Fire can help align joint indicators, reporting, and action.
Key Points Leaders Should Carry Forward
Four principles stand out from everything covered in this article:
Define co-creation before choosing metrics. Shared language between partners helps stop measurement drift later.
Start with a small shared set covering process, information, and relationships.
Adapt existing scorecards first. Extending a Balanced Scorecard to capture collaborative value-added attributes is a practical starting point [3].
Build regular learning cycles so the system shifts as partnerships change.
Co-creation measurement is a practice that gets better as partners build trust, share data, and learn. The organizations that do this well treat measurement not as a reporting task, but as a tool for better joint decisions - quarter after quarter.
FAQs
How do I choose the right framework?
Choose a framework that fits your organization’s technology setup, market position, and role in the supply chain. It also needs to line up with your current stage of collaboration, so you can track the benefits that matter most right now.
A good framework should give you a clear structure and use shared metrics across supply chain members. It should also cover core areas such as process development, information sharing, and day-to-day interaction.
What should my first shared KPIs be?
Start with shared KPIs tied to common goals and mutual gains, not siloed company results.
Focus on how the entire supply chain performs. That includes measures like total cost reduction, faster delivery times, and stronger response to customer demand. The point is simple: pick metrics every partner can use to judge how the collaboration is improving the supply chain as a whole, not just one firm’s numbers.
How do we measure trust objectively?
Measuring trust in supply chains with a single score sounds neat, but it rarely matches how trust works in practice. Trust is layered. It shifts by context, by partner, and by the systems around the relationship.
A better way to look at it is through a risk-based framework that tests trust from several angles. Instead of asking whether trust simply exists, ask whether a relationship is risky, risk-worthy, or not risky. That judgment should rest on a mix of partner characteristics, rational factors, and the institutional security systems that sit behind the relationship.
Related Blog Posts
Latest Articles
©2025

Narrative Change and Power Building: The Missing Half of Advocacy
Narrative change is the process of disrupting dominant narratives that normalize inequity and advancing new narratives from historically marginalized communities.

Funding Resilience Without Federal Grants
BRIC is unreliable and FEMA is shrinking. Here's how cities fund climate resilience with dedicated revenue, blended finance, and a coordinating authority.

The ESG Blind Spot: How AI Is Finding Risks in Companies Nobody Else Is Watching
Norway's sovereign wealth fund uses AI to screen 7,200 portfolio companies for forced labor and corruption within 24 hours. The real story is the emerging-market coverage gap that traditional ESG data vendors miss — and what it means for any company with a global supply chain.
Narrative Change and Power Building: The Missing Half of Advocacy
Narrative change is the process of disrupting dominant narratives that normalize inequity and advancing new narratives from historically marginalized communities.
Funding Resilience Without Federal Grants
BRIC is unreliable and FEMA is shrinking. Here's how cities fund climate resilience with dedicated revenue, blended finance, and a coordinating authority.
The ESG Blind Spot: How AI Is Finding Risks in Companies Nobody Else Is Watching
Norway's sovereign wealth fund uses AI to screen 7,200 portfolio companies for forced labor and corruption within 24 hours. The real story is the emerging-market coverage gap that traditional ESG data vendors miss — and what it means for any company with a global supply chain.
FAQ
01
What does it really mean to “redefine profit”?
02
What makes Council Fire different?
03
Who does Council Fire work with?
04
What does working with Council Fire actually look like?
05
How does Council Fire help organizations turn big goals into action?
06
How does Council Fire define and measure success?
Jul 6, 2026
Frameworks for Measuring Co-Creation in Supply Chains
Sustainability Strategy
In This Article
Set shared goals, pick 5–8 joint KPIs, align governance by decision level, and review quarterly to track co-creation across partners.
Frameworks for Measuring Co-Creation in Supply Chains
Most supply chain scorecards miss the part that matters most: what partners produce together. If you want to measure co-creation, I’d keep it simple: define the shared goal, pick a small set of joint metrics, sort them by decision level, and review them on a set cycle.
Here’s the article in plain English:
Standard KPIs are too narrow. Cost, delivery, and lead time show results, but they miss shared planning, trust, learning, and joint problem-solving.
A shared framework gives partners one scorecard language. The article points to four main options: the Seven Elements Model, Six Constituents Model, Collaborative Balanced Scorecard, and SCI Hierarchy.
Joint metrics should mix hard numbers with relationship signals. Examples include shared cost savings, co-developed solutions, supplier participation, trust, and partner satisfaction.
You do not need to rebuild your system. I’d add joint KPIs to current scorecards, then link them to stakeholder and community outcomes through a Theory of Change.
Governance matters as much as the metric list. The article groups metrics across three levels - strategic, managerial, and day-to-day work - so each one ties to the right decision.
Review on a fixed rhythm. Quarterly dashboards and annual reviews help partners check progress, fix weak spots, and update KPIs as the relationship changes.
Use both numbers and discussion. Dashboards show what changed; interviews and debriefs help explain why.
What I’d take away: the best path is not more data. It is a shared measurement system built around joint outcomes, clear ownership, and regular learning.
Framework | Main use | What it measures best |
|---|---|---|
Seven Elements Model | Relationship quality | Information sharing, goal alignment, joint learning |
Six Constituents Model | Supply chain structure | Processes, systems, network setup, collaboration levels |
Collaborative Balanced Scorecard | Business value from partnership | Joint KPIs, shared gains, common performance targets |
SCI Hierarchy | Integration maturity | Visibility, information exchange, degree of integration |
Theory of Change / Collective Impact | Community and stakeholder results | How joint actions link to social and local outcomes |
If I were setting this up in a U.S. supply chain today, I’d start with 5 to 8 shared metrics, map each one to an owner, and review them every quarter with all key partners in the room.
Shared Measurement Frameworks for Multi-Partner Supply Chains
5 Shared Measurement Frameworks for Supply Chain Co-Creation
The hard part is not the amount of data. It’s getting partners to agree on the same indicators. That’s where shared measurement frameworks help. They turn collaboration from a loose idea into something teams can track, discuss, and improve together. Just as important, they give supply chain partners a common language for joint results.
Applying Collaboration Science to Supply Chain Partnerships
Collaboration science gives supply chain teams a useful way to think about measurement. Cao, Vonderembse, Zhang, and Ragu-Nathan define collaboration through seven elements: information sharing, goal congruence, decision synchronization, incentive alignment, resource sharing, collaborative communication, and joint knowledge creation [4].
This matters because process measures show more than output. Decision synchronization and joint knowledge creation reveal how partners actually work together, not just what they move through the chain [4][6]. A shipment can arrive on time while the partnership behind it is strained. These measures help surface that difference.
Using Shared Measurement to Build a Common Indicator Set
Once partners agree on how collaboration functions, the next move is deciding what to measure. A shared framework makes that step far easier. The Collaborative Balanced Scorecard (CBSC) extends the traditional balanced scorecard to quantify Collaborative Value-Added between two or more partners by arranging a common set of attributes and mutual agreement on performance measures [3].
In day-to-day use, a joint indicator set might track:
Co-developed solutions per year
Shared cost savings
Supplier participation rates
Research on the natural forest products industry points to four common collaboration practices that are worth tracking: joint sales forecasting, exchange of basic information, joint planning, and joint delivery improvement [7]. Those measures help teams see whether collaboration is happening in routine work, not just in quarterly reviews.
Governance is just as important as the metrics. The Six Constituents Model pulls together stakeholders, business strategy, processes, enabling technology, network structure, and levels of collaboration [6]. It also suggests organizing collaboration across three levels:
Strategic: capital investment and network restructuring
Managerial: forecasting and resource control
Operational: routine scheduling and stock control [6]
That structure keeps measures tied to the right decisions. A strategic issue should not be judged by an operational metric alone, and routine execution problems should not be buried in high-level reporting.
Comparison Table: Collaboration and Shared Measurement Frameworks
Framework | Primary Focus | Typical Indicators | Strengths for Co-Creation |
|---|---|---|---|
Seven Elements Model [4] | Relational & behavioral | Goal congruence, joint knowledge creation, incentive alignment | Captures the behaviors that make collaboration possible |
Six Constituents Model [6] | System-wide and structural | Network structure, enabling technology, process alignment (SCOR) | Maps technical and flow dependencies across the chain |
Collaborative BSC [3] | Strategic value | Collaborative Value-Added, mutual agreement on what success means | Quantifies the financial and strategic gain of the partnership |
SCI Hierarchy [5] | Maturity & effectiveness | Visibility index, information sharing index, integration levels | Shows how collaboration matures over time |
The next step is fitting these shared indicators into existing scorecards and sustainability reporting systems.
Extending Supply Chain and Sustainability Frameworks to Capture Co-Created Value
Once partners agree on shared indicators, the next move is to build them into the tools teams already use: scorecards, sustainability reports, and supplier systems.
Adding Joint KPIs to Existing Supply Chain Scorecards
Most organizations already have scorecards, reporting routines, and supplier platforms in place. The goal is not to start over. It’s to extend those systems so they track joint value, not just what each party does on its own.
That means adding relationship-level measures such as shared investment, joint asset use, and the time it takes to co-develop new solutions. The Collaborative Balanced Scorecard adds a Collaborative Value-Added layer without requiring a full rebuild of the scorecard [3]. If a team needs something simpler, the Decision Matrix Method (DMM) offers a lighter option by weighting co-creation indicators on a 1–10 scale [2]. It blends qualitative inputs like trust and service quality with quantitative measures like cost and delivery performance.
From there, scorecard metrics should pass through a materiality lens so the partnership focuses on outcomes that matter to stakeholders, not just numbers that are easy to collect.
Linking Materiality, Stakeholder Value, and Community Outcomes
These joint metrics become more useful when they feed into materiality-based sustainability reporting. Picking the right co-creation metrics matters just as much as the mechanics of adding them. The strongest approach is to anchor metric selection in materiality, especially impact materiality - how the partnership affects society and the environment.
A Theory of Change helps make that link visible. It connects a joint activity, such as shared training, to a reportable outcome, such as community resilience [9].
Comparison Table: Supply Chain and Sustainability Frameworks
Use business-performance frameworks for supplier partnerships, and use impact frameworks for collaborations centered on community outcomes.
Framework | Co-Creation Outcomes Captured | Data Requirements | Best Fit |
|---|---|---|---|
Collective Impact (CI) [9] | Large-scale social impact, common agenda alignment | Shared measurement systems, continuous communication | Public-private initiatives, community programs |
Collaborative Balanced Scorecard (BSC) [3] | Mutual business performance, Collaborative Value-Added | Joint KPIs, financial and operational data | Strategic supplier-buyer partnerships |
Community Capital (CC) [9] | Changes in natural, social, human, and cultural assets | Context-specific community asset mapping | Community-focused resilience programs |
Emissions reduction, waste minimization, green innovation | Environmental performance data, integration metrics | Sustainability scorecards, manufacturing partnerships | |
Decision Matrix Method (DMM) [2] | Quantified stakeholder value - financial and service-related | Weighted scores for specific indicators (1–10 scale) | SMEs, strategic supplier-buyer assessments |
When a partnership shapes both day-to-day operations and community results, it makes sense to pair a business-performance framework with an impact framework. The next piece is setting governance, reporting cadence, and learning loops.
Building a Measurement and Learning System That Works in Practice
Designing a Shared Theory of Change and Indicator Mix
Once partners agree on shared metrics, they still need a plain, usable way to run the work. A shared Theory of Change helps connect inputs, joint activities, outputs, and outcomes. That map matters because it turns a list of metrics into something more useful: joint decisions.
At the center of that map is goal congruence. Partners need the same picture of success. Just as important, incentives need to line up so risk and reward push the partnership in the same direction. From there, the indicator mix should balance hard operating measures with relationship measures. That means tracking operational KPIs such as joint delivery improvement and replenishment systems, while also watching relational signals such as trust, partner satisfaction, and learning quality.
A validated 16-item scale points to three core dimensions: process development, information sharing, and interaction [1]. Those three areas give teams a solid reference point when they build a measurement system.
Once the indicator mix is set, each metric should be tied to the right decision level. Metrics should sit across three levels:
Strategic metrics cover capital investment and network restructuring decisions.
Managerial metrics track forecasting and resource planning.
Operational metrics handle routine work such as production scheduling and stock control [6].
Labeling strategic, managerial, and operational metrics separately keeps ownership clear and cuts down on confusion when decisions need to be made.
Setting Data Governance, Reporting Cadence, and Learning Loops
Measurement falls apart fast when no one knows who owns the data or when anyone is supposed to review it. Governance sets the rules: who owns the data, who checks it, and who takes action. A simple three-tier model works well here, with operational systems for routine data, management dashboards for planning, and executive reviews for capital and network decisions [6].
For U.S.-based supply chain teams, a practical rhythm is quarterly dashboards for managerial control and fiscal-year reporting for strategic review [6]. Annual reviews are the right time to revisit joint KPIs, adjust shared investments, and decide whether to scale or restructure specific initiatives.
Dashboards alone won't tell the whole story. Pair them with debriefs or interviews to surface trust, conflict, and learning that the numbers miss [10]. Quantitative data shows what changed. Qualitative insight helps explain why.
Comparison Table: Categories of Co-Creation Metrics
Metric Category | Advantages | Limitations | Data Difficulty | Best Use Case |
|---|---|---|---|---|
Joint KPIs | Clear operational alignment; directly linked to cost savings and productivity | May overlook relational health or long-term co-created value | Low to Medium | Routine operational optimization and cost reduction |
Sustainability & Shared Value | Links supply chain efficiency to environmental and social impact; supports resource sharing and circular economy integration | Can become an administrative burden if not tied to core strategy | Medium to High | ESG reporting, circular economy initiatives, and community-impact programs |
Relational Indicators | Captures trust, commitment, and reciprocity; predicts long-term partnership stability | Highly subjective; difficult to quantify without surveys or interviews | High | Strategic alliances, high-innovation partnerships, and co-development programs |
Conclusion: A Practical Path to Measuring Co-Creation at Scale
Measuring co-creation is hard for a simple reason: standard KPIs are built to track efficiency, not shared trust, information flow, or joint problem-solving. Yet those are the things that make co-creation work. Because co-creation relies on partner resources working together, no single operating metric can show the full picture. The practical move is to build a shared system that brings together joint metrics, governance, and learning.
In practice, teams can begin with a shared theory of change and a small set of indicators. A three-part lens - process development, information sharing, and interaction - gives organizations a solid place to start when shaping co-creation metrics. From there, the work becomes more manageable: extend existing scorecards to reflect collaborative value-added attributes, combine quantitative dashboards with regular learning loops, and tier metrics across strategic, managerial, and operational levels. That gives teams a working system without forcing them to rebuild everything from zero.
That step from strategy to shared metrics is where Council Fire's systems-thinking approach can help. For organizations turning sustainability goals into supply-chain metrics, a systems-thinking partner like Council Fire can help align joint indicators, reporting, and action.
Key Points Leaders Should Carry Forward
Four principles stand out from everything covered in this article:
Define co-creation before choosing metrics. Shared language between partners helps stop measurement drift later.
Start with a small shared set covering process, information, and relationships.
Adapt existing scorecards first. Extending a Balanced Scorecard to capture collaborative value-added attributes is a practical starting point [3].
Build regular learning cycles so the system shifts as partnerships change.
Co-creation measurement is a practice that gets better as partners build trust, share data, and learn. The organizations that do this well treat measurement not as a reporting task, but as a tool for better joint decisions - quarter after quarter.
FAQs
How do I choose the right framework?
Choose a framework that fits your organization’s technology setup, market position, and role in the supply chain. It also needs to line up with your current stage of collaboration, so you can track the benefits that matter most right now.
A good framework should give you a clear structure and use shared metrics across supply chain members. It should also cover core areas such as process development, information sharing, and day-to-day interaction.
What should my first shared KPIs be?
Start with shared KPIs tied to common goals and mutual gains, not siloed company results.
Focus on how the entire supply chain performs. That includes measures like total cost reduction, faster delivery times, and stronger response to customer demand. The point is simple: pick metrics every partner can use to judge how the collaboration is improving the supply chain as a whole, not just one firm’s numbers.
How do we measure trust objectively?
Measuring trust in supply chains with a single score sounds neat, but it rarely matches how trust works in practice. Trust is layered. It shifts by context, by partner, and by the systems around the relationship.
A better way to look at it is through a risk-based framework that tests trust from several angles. Instead of asking whether trust simply exists, ask whether a relationship is risky, risk-worthy, or not risky. That judgment should rest on a mix of partner characteristics, rational factors, and the institutional security systems that sit behind the relationship.
Related Blog Posts
Latest Articles
©2025
Narrative Change and Power Building: The Missing Half of Advocacy
Narrative change is the process of disrupting dominant narratives that normalize inequity and advancing new narratives from historically marginalized communities.
Funding Resilience Without Federal Grants
BRIC is unreliable and FEMA is shrinking. Here's how cities fund climate resilience with dedicated revenue, blended finance, and a coordinating authority.
The ESG Blind Spot: How AI Is Finding Risks in Companies Nobody Else Is Watching
Norway's sovereign wealth fund uses AI to screen 7,200 portfolio companies for forced labor and corruption within 24 hours. The real story is the emerging-market coverage gap that traditional ESG data vendors miss — and what it means for any company with a global supply chain.
FAQ
01
What does it really mean to “redefine profit”?
02
What makes Council Fire different?
03
Who does Council Fire work with?
04
What does working with Council Fire actually look like?
05
How does Council Fire help organizations turn big goals into action?
06
How does Council Fire define and measure success?
Jul 6, 2026
Frameworks for Measuring Co-Creation in Supply Chains
Sustainability Strategy
In This Article
Set shared goals, pick 5–8 joint KPIs, align governance by decision level, and review quarterly to track co-creation across partners.
Frameworks for Measuring Co-Creation in Supply Chains
Most supply chain scorecards miss the part that matters most: what partners produce together. If you want to measure co-creation, I’d keep it simple: define the shared goal, pick a small set of joint metrics, sort them by decision level, and review them on a set cycle.
Here’s the article in plain English:
Standard KPIs are too narrow. Cost, delivery, and lead time show results, but they miss shared planning, trust, learning, and joint problem-solving.
A shared framework gives partners one scorecard language. The article points to four main options: the Seven Elements Model, Six Constituents Model, Collaborative Balanced Scorecard, and SCI Hierarchy.
Joint metrics should mix hard numbers with relationship signals. Examples include shared cost savings, co-developed solutions, supplier participation, trust, and partner satisfaction.
You do not need to rebuild your system. I’d add joint KPIs to current scorecards, then link them to stakeholder and community outcomes through a Theory of Change.
Governance matters as much as the metric list. The article groups metrics across three levels - strategic, managerial, and day-to-day work - so each one ties to the right decision.
Review on a fixed rhythm. Quarterly dashboards and annual reviews help partners check progress, fix weak spots, and update KPIs as the relationship changes.
Use both numbers and discussion. Dashboards show what changed; interviews and debriefs help explain why.
What I’d take away: the best path is not more data. It is a shared measurement system built around joint outcomes, clear ownership, and regular learning.
Framework | Main use | What it measures best |
|---|---|---|
Seven Elements Model | Relationship quality | Information sharing, goal alignment, joint learning |
Six Constituents Model | Supply chain structure | Processes, systems, network setup, collaboration levels |
Collaborative Balanced Scorecard | Business value from partnership | Joint KPIs, shared gains, common performance targets |
SCI Hierarchy | Integration maturity | Visibility, information exchange, degree of integration |
Theory of Change / Collective Impact | Community and stakeholder results | How joint actions link to social and local outcomes |
If I were setting this up in a U.S. supply chain today, I’d start with 5 to 8 shared metrics, map each one to an owner, and review them every quarter with all key partners in the room.
Shared Measurement Frameworks for Multi-Partner Supply Chains
5 Shared Measurement Frameworks for Supply Chain Co-Creation
The hard part is not the amount of data. It’s getting partners to agree on the same indicators. That’s where shared measurement frameworks help. They turn collaboration from a loose idea into something teams can track, discuss, and improve together. Just as important, they give supply chain partners a common language for joint results.
Applying Collaboration Science to Supply Chain Partnerships
Collaboration science gives supply chain teams a useful way to think about measurement. Cao, Vonderembse, Zhang, and Ragu-Nathan define collaboration through seven elements: information sharing, goal congruence, decision synchronization, incentive alignment, resource sharing, collaborative communication, and joint knowledge creation [4].
This matters because process measures show more than output. Decision synchronization and joint knowledge creation reveal how partners actually work together, not just what they move through the chain [4][6]. A shipment can arrive on time while the partnership behind it is strained. These measures help surface that difference.
Using Shared Measurement to Build a Common Indicator Set
Once partners agree on how collaboration functions, the next move is deciding what to measure. A shared framework makes that step far easier. The Collaborative Balanced Scorecard (CBSC) extends the traditional balanced scorecard to quantify Collaborative Value-Added between two or more partners by arranging a common set of attributes and mutual agreement on performance measures [3].
In day-to-day use, a joint indicator set might track:
Co-developed solutions per year
Shared cost savings
Supplier participation rates
Research on the natural forest products industry points to four common collaboration practices that are worth tracking: joint sales forecasting, exchange of basic information, joint planning, and joint delivery improvement [7]. Those measures help teams see whether collaboration is happening in routine work, not just in quarterly reviews.
Governance is just as important as the metrics. The Six Constituents Model pulls together stakeholders, business strategy, processes, enabling technology, network structure, and levels of collaboration [6]. It also suggests organizing collaboration across three levels:
Strategic: capital investment and network restructuring
Managerial: forecasting and resource control
Operational: routine scheduling and stock control [6]
That structure keeps measures tied to the right decisions. A strategic issue should not be judged by an operational metric alone, and routine execution problems should not be buried in high-level reporting.
Comparison Table: Collaboration and Shared Measurement Frameworks
Framework | Primary Focus | Typical Indicators | Strengths for Co-Creation |
|---|---|---|---|
Seven Elements Model [4] | Relational & behavioral | Goal congruence, joint knowledge creation, incentive alignment | Captures the behaviors that make collaboration possible |
Six Constituents Model [6] | System-wide and structural | Network structure, enabling technology, process alignment (SCOR) | Maps technical and flow dependencies across the chain |
Collaborative BSC [3] | Strategic value | Collaborative Value-Added, mutual agreement on what success means | Quantifies the financial and strategic gain of the partnership |
SCI Hierarchy [5] | Maturity & effectiveness | Visibility index, information sharing index, integration levels | Shows how collaboration matures over time |
The next step is fitting these shared indicators into existing scorecards and sustainability reporting systems.
Extending Supply Chain and Sustainability Frameworks to Capture Co-Created Value
Once partners agree on shared indicators, the next move is to build them into the tools teams already use: scorecards, sustainability reports, and supplier systems.
Adding Joint KPIs to Existing Supply Chain Scorecards
Most organizations already have scorecards, reporting routines, and supplier platforms in place. The goal is not to start over. It’s to extend those systems so they track joint value, not just what each party does on its own.
That means adding relationship-level measures such as shared investment, joint asset use, and the time it takes to co-develop new solutions. The Collaborative Balanced Scorecard adds a Collaborative Value-Added layer without requiring a full rebuild of the scorecard [3]. If a team needs something simpler, the Decision Matrix Method (DMM) offers a lighter option by weighting co-creation indicators on a 1–10 scale [2]. It blends qualitative inputs like trust and service quality with quantitative measures like cost and delivery performance.
From there, scorecard metrics should pass through a materiality lens so the partnership focuses on outcomes that matter to stakeholders, not just numbers that are easy to collect.
Linking Materiality, Stakeholder Value, and Community Outcomes
These joint metrics become more useful when they feed into materiality-based sustainability reporting. Picking the right co-creation metrics matters just as much as the mechanics of adding them. The strongest approach is to anchor metric selection in materiality, especially impact materiality - how the partnership affects society and the environment.
A Theory of Change helps make that link visible. It connects a joint activity, such as shared training, to a reportable outcome, such as community resilience [9].
Comparison Table: Supply Chain and Sustainability Frameworks
Use business-performance frameworks for supplier partnerships, and use impact frameworks for collaborations centered on community outcomes.
Framework | Co-Creation Outcomes Captured | Data Requirements | Best Fit |
|---|---|---|---|
Collective Impact (CI) [9] | Large-scale social impact, common agenda alignment | Shared measurement systems, continuous communication | Public-private initiatives, community programs |
Collaborative Balanced Scorecard (BSC) [3] | Mutual business performance, Collaborative Value-Added | Joint KPIs, financial and operational data | Strategic supplier-buyer partnerships |
Community Capital (CC) [9] | Changes in natural, social, human, and cultural assets | Context-specific community asset mapping | Community-focused resilience programs |
Emissions reduction, waste minimization, green innovation | Environmental performance data, integration metrics | Sustainability scorecards, manufacturing partnerships | |
Decision Matrix Method (DMM) [2] | Quantified stakeholder value - financial and service-related | Weighted scores for specific indicators (1–10 scale) | SMEs, strategic supplier-buyer assessments |
When a partnership shapes both day-to-day operations and community results, it makes sense to pair a business-performance framework with an impact framework. The next piece is setting governance, reporting cadence, and learning loops.
Building a Measurement and Learning System That Works in Practice
Designing a Shared Theory of Change and Indicator Mix
Once partners agree on shared metrics, they still need a plain, usable way to run the work. A shared Theory of Change helps connect inputs, joint activities, outputs, and outcomes. That map matters because it turns a list of metrics into something more useful: joint decisions.
At the center of that map is goal congruence. Partners need the same picture of success. Just as important, incentives need to line up so risk and reward push the partnership in the same direction. From there, the indicator mix should balance hard operating measures with relationship measures. That means tracking operational KPIs such as joint delivery improvement and replenishment systems, while also watching relational signals such as trust, partner satisfaction, and learning quality.
A validated 16-item scale points to three core dimensions: process development, information sharing, and interaction [1]. Those three areas give teams a solid reference point when they build a measurement system.
Once the indicator mix is set, each metric should be tied to the right decision level. Metrics should sit across three levels:
Strategic metrics cover capital investment and network restructuring decisions.
Managerial metrics track forecasting and resource planning.
Operational metrics handle routine work such as production scheduling and stock control [6].
Labeling strategic, managerial, and operational metrics separately keeps ownership clear and cuts down on confusion when decisions need to be made.
Setting Data Governance, Reporting Cadence, and Learning Loops
Measurement falls apart fast when no one knows who owns the data or when anyone is supposed to review it. Governance sets the rules: who owns the data, who checks it, and who takes action. A simple three-tier model works well here, with operational systems for routine data, management dashboards for planning, and executive reviews for capital and network decisions [6].
For U.S.-based supply chain teams, a practical rhythm is quarterly dashboards for managerial control and fiscal-year reporting for strategic review [6]. Annual reviews are the right time to revisit joint KPIs, adjust shared investments, and decide whether to scale or restructure specific initiatives.
Dashboards alone won't tell the whole story. Pair them with debriefs or interviews to surface trust, conflict, and learning that the numbers miss [10]. Quantitative data shows what changed. Qualitative insight helps explain why.
Comparison Table: Categories of Co-Creation Metrics
Metric Category | Advantages | Limitations | Data Difficulty | Best Use Case |
|---|---|---|---|---|
Joint KPIs | Clear operational alignment; directly linked to cost savings and productivity | May overlook relational health or long-term co-created value | Low to Medium | Routine operational optimization and cost reduction |
Sustainability & Shared Value | Links supply chain efficiency to environmental and social impact; supports resource sharing and circular economy integration | Can become an administrative burden if not tied to core strategy | Medium to High | ESG reporting, circular economy initiatives, and community-impact programs |
Relational Indicators | Captures trust, commitment, and reciprocity; predicts long-term partnership stability | Highly subjective; difficult to quantify without surveys or interviews | High | Strategic alliances, high-innovation partnerships, and co-development programs |
Conclusion: A Practical Path to Measuring Co-Creation at Scale
Measuring co-creation is hard for a simple reason: standard KPIs are built to track efficiency, not shared trust, information flow, or joint problem-solving. Yet those are the things that make co-creation work. Because co-creation relies on partner resources working together, no single operating metric can show the full picture. The practical move is to build a shared system that brings together joint metrics, governance, and learning.
In practice, teams can begin with a shared theory of change and a small set of indicators. A three-part lens - process development, information sharing, and interaction - gives organizations a solid place to start when shaping co-creation metrics. From there, the work becomes more manageable: extend existing scorecards to reflect collaborative value-added attributes, combine quantitative dashboards with regular learning loops, and tier metrics across strategic, managerial, and operational levels. That gives teams a working system without forcing them to rebuild everything from zero.
That step from strategy to shared metrics is where Council Fire's systems-thinking approach can help. For organizations turning sustainability goals into supply-chain metrics, a systems-thinking partner like Council Fire can help align joint indicators, reporting, and action.
Key Points Leaders Should Carry Forward
Four principles stand out from everything covered in this article:
Define co-creation before choosing metrics. Shared language between partners helps stop measurement drift later.
Start with a small shared set covering process, information, and relationships.
Adapt existing scorecards first. Extending a Balanced Scorecard to capture collaborative value-added attributes is a practical starting point [3].
Build regular learning cycles so the system shifts as partnerships change.
Co-creation measurement is a practice that gets better as partners build trust, share data, and learn. The organizations that do this well treat measurement not as a reporting task, but as a tool for better joint decisions - quarter after quarter.
FAQs
How do I choose the right framework?
Choose a framework that fits your organization’s technology setup, market position, and role in the supply chain. It also needs to line up with your current stage of collaboration, so you can track the benefits that matter most right now.
A good framework should give you a clear structure and use shared metrics across supply chain members. It should also cover core areas such as process development, information sharing, and day-to-day interaction.
What should my first shared KPIs be?
Start with shared KPIs tied to common goals and mutual gains, not siloed company results.
Focus on how the entire supply chain performs. That includes measures like total cost reduction, faster delivery times, and stronger response to customer demand. The point is simple: pick metrics every partner can use to judge how the collaboration is improving the supply chain as a whole, not just one firm’s numbers.
How do we measure trust objectively?
Measuring trust in supply chains with a single score sounds neat, but it rarely matches how trust works in practice. Trust is layered. It shifts by context, by partner, and by the systems around the relationship.
A better way to look at it is through a risk-based framework that tests trust from several angles. Instead of asking whether trust simply exists, ask whether a relationship is risky, risk-worthy, or not risky. That judgment should rest on a mix of partner characteristics, rational factors, and the institutional security systems that sit behind the relationship.
Related Blog Posts
Latest Articles
©2025
Narrative Change and Power Building: The Missing Half of Advocacy
Narrative change is the process of disrupting dominant narratives that normalize inequity and advancing new narratives from historically marginalized communities.
Funding Resilience Without Federal Grants
BRIC is unreliable and FEMA is shrinking. Here's how cities fund climate resilience with dedicated revenue, blended finance, and a coordinating authority.
The ESG Blind Spot: How AI Is Finding Risks in Companies Nobody Else Is Watching
Norway's sovereign wealth fund uses AI to screen 7,200 portfolio companies for forced labor and corruption within 24 hours. The real story is the emerging-market coverage gap that traditional ESG data vendors miss — and what it means for any company with a global supply chain.
FAQ
What does it really mean to “redefine profit”?
What makes Council Fire different?
Who does Council Fire work with?
What does working with Council Fire actually look like?
How does Council Fire help organizations turn big goals into action?
How does Council Fire define and measure success?