
Oct 12, 2026 · 9 min read
Governance
In This Article
Eight cases compare how governance equity metrics track who decides, resource flows, and whether findings changed decisions.
On this page
- Measuring inequality and quantifying the progressivity of public policy - Deborah Hardoon, Oxfam
- Local Government: Department Accountability, Development, and Housing
- Nonprofit and Cross-Sector Work: Funding and Community Voice
- Economic Development and Conservation: Benefits, Burdens, and Accountability
- Conclusion: Use Equity Findings to Guide Decisions
- FAQs
8 Case Studies on Governance Equity Metrics
We measure governance equity by asking who decides, where resources go, and what changes - not just who participates. Across these eight cases, we separate tracked activity, policy changes, and community results. To apply the lessons, start with a baseline, name a data owner, and track results by group.
The numbers show why that distinction matters: Cleveland reported funding rates of 56% for white-led organizations versus 47% for Black- and Brown-led organizations before process changes. Its reported gap later disappeared, but that does not prove the changes caused it.
We examine eight approaches:
Las Vegas: Tracking department equity plans, rather than resident results.
Seattle: Connecting community input with development funding and neighborhood measures.
Chicago: Reviewing housing tax-credit allocations and proposed reforms.
Greater Cleveland: Comparing grant awards across leadership groups.
Magnolia Community Initiative: Giving residents a role in choosing what gets measured.
Broward County: Involving residents as research partners and co-designers.
Prosper Portland: Tracking development spending, contracting, and workforce measures.
Western Australia: Designing conservation governance indicators, alongside separate research on community decision power.
Our guiding test is simple: <u>Did the findings change a decision, and what happened next?</u> Participation, policy adoption, and improved outcomes are different claims. We keep those claims separate so you can see what each case supports - and what still needs checking.
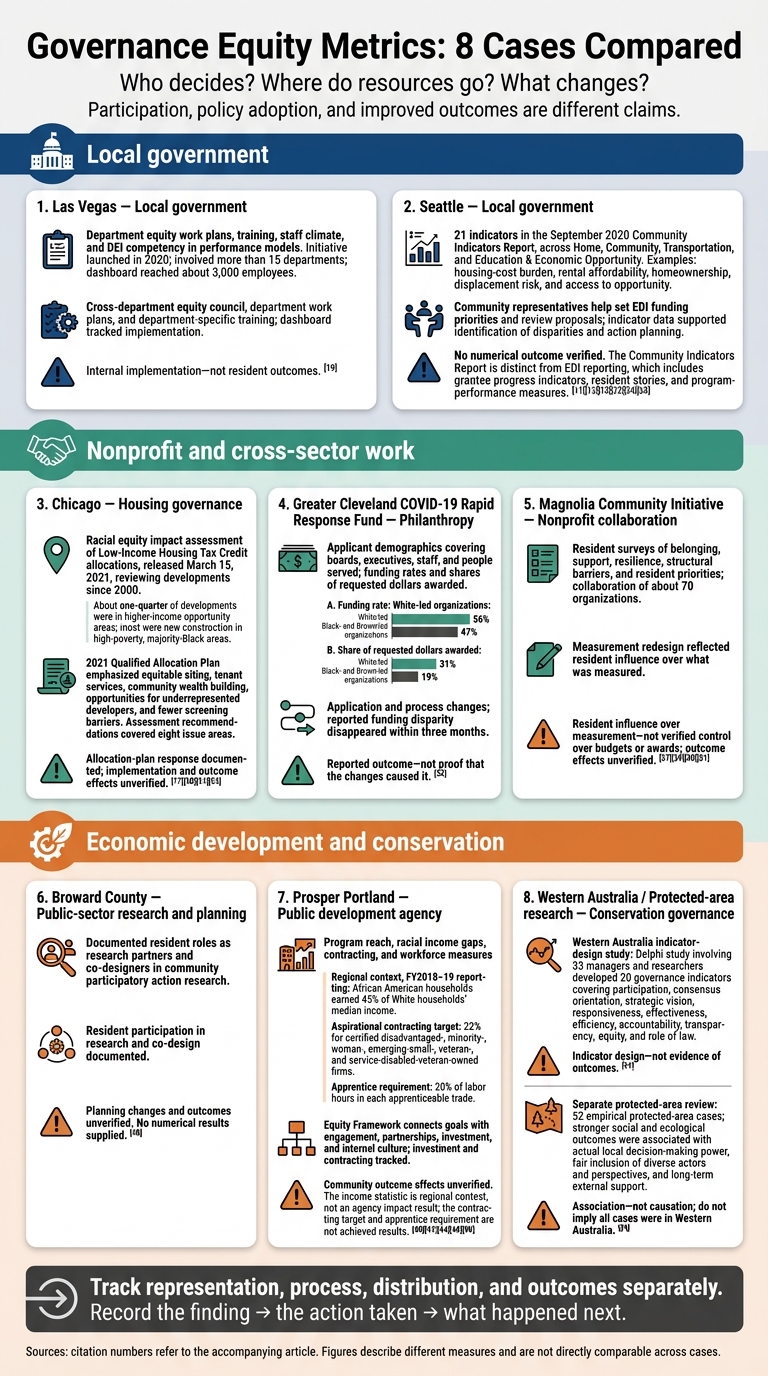
Governance Equity Metrics: 8 Cases Compared
Measuring inequality and quantifying the progressivity of public policy - Deborah Hardoon, Oxfam
sbb-itb-8baf5f1
Local Government: Department Accountability, Development, and Housing
These cases show how local governments move from tracking internal work to measuring community conditions and changing policy.
1. Las Vegas: Tracking Department Equity Plans
In 2020, Las Vegas launched a city health-equity initiative backed by the mayor and City Council. It created a cross-department equity council, department work plans, and department-specific training across more than 15 departments. A dashboard reached about 3,000 employees and tracked internal implementation - not resident outcomes. Measures covered work-plan progress, training, staff climate, and DEI competency in performance models.[9]
Name an official responsible for results, then pair this internal tracking with service access, wait times, and complaints, broken down by population and neighborhood.[9]
2. Seattle: Measuring Community-Led Development
Community representatives help set funding priorities and review proposals for Seattle’s Equitable Development Initiative (EDI). EDI connects budgets, policies, and investments to equity goals by reviewing priorities, community impact, and feasibility.[7][14]
Seattle’s September 2020 Community Indicators Report tracked 21 indicators across Home, Community, Transportation, and Education & Economic Opportunity. These included housing-cost burden, rental affordability, homeownership, displacement risk, and access to opportunity.[5][6] The data helped decision-makers and community partners spot disparities and direct action. This report differs from EDI reporting, which combines grantee progress indicators, resident stories, and program-performance measures.[6][12]
Give residents a role in interpreting the numbers and testing whether funded projects reduce displacement. Chicago takes this work into housing allocation rules.
3. Chicago: Assessing Equity in Housing Tax Credits
On March 15, 2021, Chicago’s Department of Housing released a racial equity impact assessment of its Low-Income Housing Tax Credit allocation process. Its review of developments since 2000 found that most were new construction in high-poverty, majority-Black areas. About one-quarter were in higher-income opportunity areas.[10] That finding exposed a tradeoff: meeting housing needs can still reinforce segregation unless allocations also improve access to schools, safe streets, healthy food, and other opportunity resources.[11]
Chicago’s 2021 Qualified Allocation Plan response emphasized equitable siting, tenant services, community wealth building, and more opportunities for Black and other historically underrepresented developers. It also called for fewer screening barriers tied to arrest or conviction records, evictions, and low or nonexistent credit scores.[11][13] Treat the assessment’s recommendations across eight issue areas as proposed reforms until implementation records confirm they were carried out.[8]
Track whether funded homes were built, remained affordable, supported housing stability, and improved access to opportunity.
Nonprofit and Cross-Sector Work: Funding and Community Voice
These cases move from public-sector accountability to grantmaking and community voice. Equity metrics help assess who influences funding decisions and planning.
4. Greater Cleveland COVID-19 Rapid Response Fund: Measuring Grantmaking Equity
The Greater Cleveland COVID-19 Rapid Response Fund revised its applications to collect demographic data on boards, executives, staff, and people served. This made the application a governance tool, shaping how funders compared applicants.[19]
Across the first seven grant cycles, white-led organizations had a 56% funding rate, compared with 47% for Black- and Brown-led organizations. White-led organizations also received 31% of requested dollars, versus 19% for Black- and Brown-led organizations. After changes to the process, the reported funding disparity disappeared within three months. That was a reported outcome - not proof that the changes caused it.[19]
Beyond grants, the same approach can assess whether residents shape what gets measured, not just what gets funded.
5. Magnolia Community Initiative: Measuring Resident Priorities
Los Angeles’s Magnolia Community Initiative (MCI) brought together about 70 organizations focused on children’s education, health, economic stability, and safe, nurturing parenting support. Through resident surveys and a redesign process, MCI measured belonging, support, resilience, structural barriers, and resident priorities.[15][16][17][18]
The redesign shows resident influence over measurement, but it does not verify resident control over budgets or awards.[17][18] The distinction is between helping frame the questions and simply being invited to answer them.
6. Broward County: Resident Participation in Research and Planning
The Children’s Services Council of Broward County documents community participatory action research in which residents serve as research partners and co-designers.[20]
To distinguish participation from policy change, track who sets research questions, gathers data, validates findings, and follows up on commitments.
Economic Development and Conservation: Benefits, Burdens, and Accountability
7. Prosper Portland: Measuring Development Results by Community
Prosper Portland’s Equity Framework connects the agency’s goals with community engagement, partnerships, investment, and internal culture to create equitable opportunities and impacts.[21] Its FY2018–19 reporting highlighted a regional income gap: African American households earned 45% of White households’ median income. Program-reach data helped distinguish agency activity from broader economic trends.[23]
The agency’s construction and workforce policy sets a 22% aspirational contracting target for certified disadvantaged-, minority-, woman-, emerging-small-, veteran-, and service-disabled-veteran-owned firms. It also requires apprentices to perform 20% of labor hours in each apprenticeable trade.[25]
Assessing the framework means reporting business participation, contracting, employment, and income by race, ethnicity, and geography wherever those breakdowns are available.[22][24] Keep fiscal years, baselines, and denominators consistent. Contracting dollars are not contract counts, and a business address does not tell you who received the benefit.
Track benefits alongside displacement and affordability risks. More investment does not, by itself, mean more equitable development. Conservation governance calls for the same scrutiny: document who decides, who benefits, and who bears the costs.
8. Western Australia: Assessing Governance Through Participation
In conservation, participation matters only if it changes decisions and how burdens are shared. A Western Australia Delphi study involving 33 managers and researchers developed 20 governance indicators covering participation, consensus orientation, strategic vision, responsiveness, effectiveness, efficiency, accountability, transparency, equity, and rule of law. Treat this study as indicator design - not evidence of outcomes.[26]
Use those indicators to document whose input shapes decisions, who receives conservation benefits, who bears restrictions or enforcement burdens, and how institutions respond to complaints. A separate review of 52 empirical protected-area cases found stronger social and ecological outcomes when local stakeholders received actual decision-making power, diverse actors and perspectives were fairly included, and external support lasted over the long term.[27]
Conclusion: Use Equity Findings to Guide Decisions
Track representation, process, distribution, and outcomes separately. Metrics matter when they inform a decision and lead to a visible response. Record the finding, the action taken, and what happened next.
Compare Measures, Decisions, and Changes
Use this comparison to check the evidence - not rank institutions. State gaps plainly. The table distinguishes metrics that shaped decisions from those that only recorded activity.
| Setting and institutional type | Governance question | Equity dimension | Measures and sources | Decision and documented response | Transferable lesson |
|---|---|---|---|---|---|
| Las Vegas - local government | Do departments implement equity plans? | Process; accountability | Dashboard tracking work plans, training, staff climate, and DEI competency[9] | Tracked department implementation, not resident outcomes | Pair internal tracking with resident service measures |
| Seattle - local government | Do community priorities inform development? | Process; distribution | Citywide and neighborhood indicators; community engagement[29] | Linked citywide indicators to neighborhood action planning; no numerical outcome verified[29] | Connect broad indicators to local decisions |
| Chicago - housing governance | Who benefits from housing tax credits? | Distribution; outcomes | Racial equity impact assessment of LIHTC allocations[10] | Revised Qualified Allocation Plan; implementation and outcome effects unverified[11][13] | Separate allocation reforms from housing outcomes |
| Greater Cleveland COVID-19 Rapid Response Fund - philanthropy | Is grantmaking equitable across leadership groups? | Representation; distribution | Applicant demographics, funding rates, and shares of requested dollars awarded[19] | Changed the application process; reported funding disparity disappeared within three months, without verified causation[19] | Compare both award rates and funding amounts |
| Magnolia Community Initiative - nonprofit collaboration | Do residents shape measurement? | Representation; process | Resident surveys of belonging, support, resilience, barriers, and priorities[15][16][17][18] | Redesign reflected resident influence over measurement; budget authority and outcome effects unverified[17][18] | Record which resident priorities change plans |
| Broward County - public-sector research and planning | Can residents influence research? | Representation; process | Documented resident roles as research partners and co-designers[20] | Participatory research documented; planning changes and outcomes unverified | Track influence beyond attendance |
| Prosper Portland - public development agency | Who benefits from development? | Distribution; outcomes | Program reach, racial income gaps, contracting targets, and apprentice labor-hour requirements[23][25] | Investment and contracting tracked; community outcome effects unverified | Compare group-level results across consistent periods |
| Protected areas - conservation governance | Do communities hold decision power and rights? | Representation; process; distribution; outcomes | Governance indicator design and review of 52 empirical cases[26][27][28] | Local power-sharing, fair participation, sustained support, and devolved rights linked to stronger outcomes - association, not causation[27][28] | Assess authority, not participation alone |
Use these patterns to identify the next decision, assign an owner, and set a reporting cycle.
Make Equity Metrics Part of Routine Decisions
Start with the affected communities and the decision at hand: a funding round, procurement process, housing allocation, infrastructure project, or conservation rule. Set quantitative and qualitative baselines for each group. Pay community members to help choose and interpret indicators.
Assign each measure an owner, target, reporting date, and escalation rule. Publish recommendations, responses, and explanations for missed targets.
Budget for staff time, translation, accessibility, and data management. Protect confidentiality and suppress small cells where needed. When samples are too small for reliable percentages, use interviews instead. After each decision cycle, ask what changed. Revise measures that reward activity without meaningful influence.
Use Equity Metrics in Sustainability Planning
These metrics can also guide climate resilience, housing, infrastructure, and conservation work. Council Fire can help turn them into sustainability decisions across climate resilience, circular economy, and regenerative infrastructure. That role does not imply involvement in or verification of any case outcome.
FAQs
Which equity metrics should we prioritize first?
Start by auditing who holds decision-making power over budgets, hiring, and organizational strategy to set a baseline [1]. Then choose 3 to 5 mission-aligned outcome metrics to keep your impact focused [2][3]. Track concrete outcomes, such as climate risk disclosures, community well-being, and social benefits [4].
Break down data by race, gender, and geography to identify disparities and measure how much influence underrepresented groups have over key outcomes [2][1].
How can we tell whether reforms caused equity gains?
Track process and outcome metrics by demographic group over time. Compare before-and-after results to see whether disparities shrink. Set review dates, identify who makes decisions, and require equity impact reviews while there’s still time to change proposals, budgets, and capital projects.
Use transparent dashboards and independently verified monitoring, reporting, and verification (MRV). Update metrics each review cycle to help determine whether reforms - not just changes in reporting - account for equity gains. [1][2][3]
How do we verify residents have real decision-making power?
Pair governance with monitoring, reporting, and verification checks. Let residents validate or reject draft metrics and measurement methods, give frontline representatives committee voting rights, publish transparent dashboards or annual reports, and keep data traceable and independently verified.
Check whether residents have real decision-making power by tracking how often their proposals receive formal responses and lead to policy actions - not just attendance or the amount of feedback collected [1][2][3].



FAQ