
Sep 2, 2026
Financial Planning For Net-Zero: Guide
Sustainability Strategy
In This Article
Turn net-zero targets into funded budgets: set baselines, run scenarios, rank abatement by cost, and embed CAPEX in IFRS S2.
Financial Planning For Net-Zero: Guide
Net-zero plans fail when they stay outside the budget. I’d treat net-zero as a finance issue first: set a base year, define Scope 1, 2, and key Scope 3 limits, build 5-year targets, test carbon-price and physical-risk scenarios, rank projects by cost per ton and return, and track funded work in board and management reports.
Here’s the short version:
Money drives progress: Net zero by 2050 may need about $9.2 trillion per year in global physical-asset spending.
Targets need rules: I’d set a base year with complete data, clear GHG boundaries, and written reset rules for major structural changes.
Use finance metrics: Focus on marginal abatement cost, internal carbon price, climate-adjusted IRR/payback, and climate VaR.
Run scenarios: Test at least a low-warming path and a higher-warming path across revenue, OPEX, CAPEX, asset value, and cost of capital.
Fund the right projects: Start with efficiency, then electrification and other direct cuts. Keep offsets for residual emissions.
Tie plans to reporting: Link budgets, forecasts, board oversight, and IFRS S1/S2 disclosure to the same numbers.
A few figures stand out. Firms with solid transition plans may lower cost of capital by 39 to 85 basis points. Many abatement moves under $50 per metric ton can be zero or negative cost. And global flood damage to capital stock could move from about $35 billion per year today to $140 billion by 2050.
If I were building a net-zero plan, I’d keep one rule in front of me: if it isn’t funded, timed, owned, and reported, it isn’t a plan.
This guide shows how to turn a climate target into a budgeted path with clear metrics, scenario tests, capital choices, and board-level follow-through.
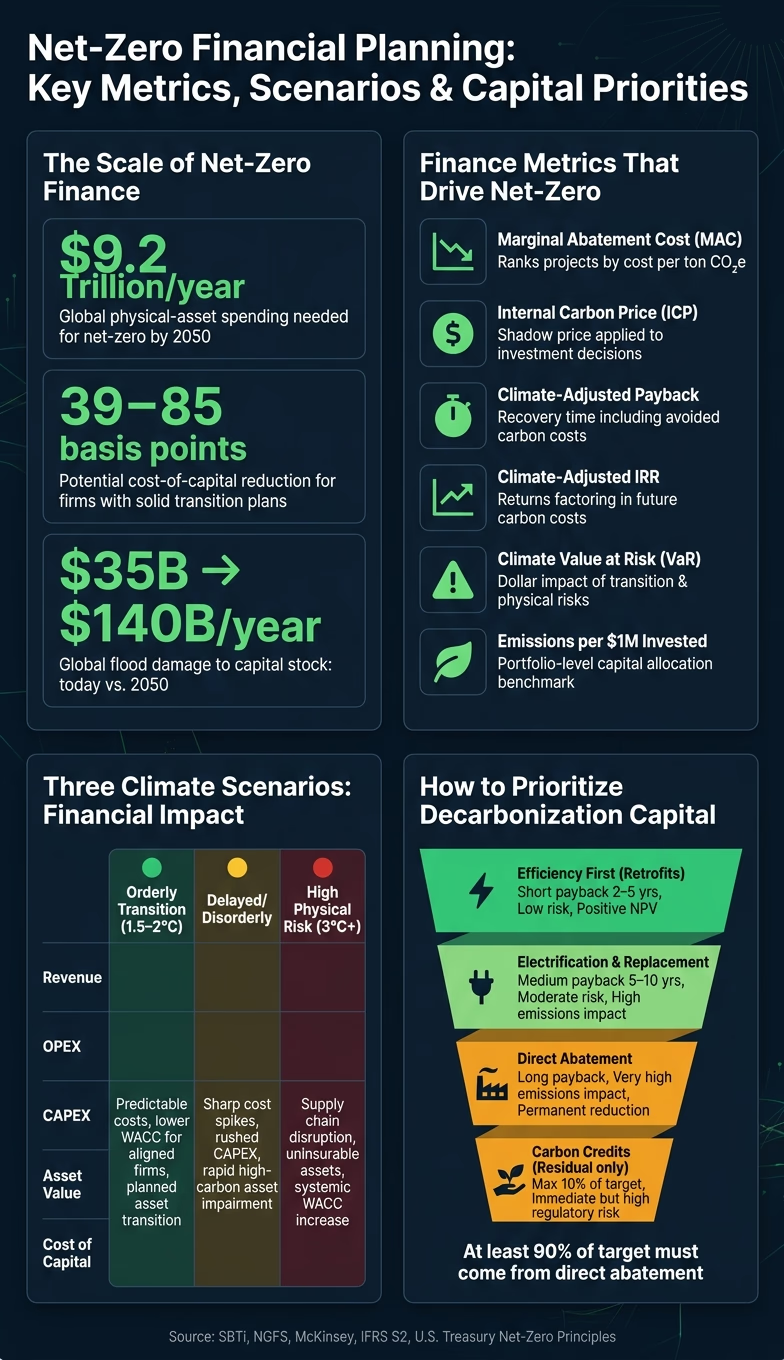
Net-Zero Financial Planning: Key Metrics, Scenarios & Capital Priorities
Interview. Cash and Carbon: Making efficient financial moves to net-zero
Define net-zero targets as financial objectives
A net-zero pledge starts to matter when finance turns it into an emissions path, a capital plan, and yearly milestones that sit inside the budget. Until then, it’s just intent on paper.
Set boundaries, interim targets, and decision rules
Three moves set the financial base.
First, choose a baseline year. In most cases, that should be the latest 12-month period with complete, dependable data. For SBTi-aligned targets, base years should be no earlier than 2015 [12]. Use at least 12 months of complete Scope 1 and Scope 2 data, with material Scope 3 sources included where relevant [10][11]. It also helps to note unusual events - plant shutdowns, one-time acquisitions, or other one-off shifts - so later comparisons stay honest and finance can measure results against budget assumptions.
Second, set emissions inventory boundaries under the GHG Protocol - operational control, financial control, or equity share. Those boundaries should cover at least 95% of Scope 1 and 2 emissions [6][12].
Third, set interim targets at about five-year intervals. The U.S. Treasury's Principles for Net-Zero Financing & Investment call for interim targets for 2030 or sooner, then every five years or less [2].
Use both absolute and intensity targets. That matters because growth, acquisitions, and divestitures can blur the picture if you rely on only one lens. Finance teams should also set written decision rules for when a baseline can be recalibrated. The rule is simple: material structural changes count, but organic growth does not [4].
Once those target boundaries are locked in, finance needs metrics it can actually use in capital planning.
Choose metrics finance teams can use
The next step is to pick metrics that tie emissions performance to budget and investment choices. These tools help teams rank projects, apply a carbon cost, and test asset risk.
Metric | What it measures | Financial use |
|---|---|---|
Marginal abatement cost (MAC) | Cost per metric ton CO2e avoided by a specific project | CAPEX prioritization; MAC curves rank projects from lowest to highest cost per ton |
Internal carbon price (ICP) | Shadow price applied to projected emissions in investment decisions | CAPEX approvals, procurement, product pricing |
Payback period (climate-adjusted) | Time to recover investment, including avoided carbon costs and regulatory risk | Project screening alongside standard payback thresholds |
IRR (climate-adjusted) | Return on investment factoring in future carbon costs and green financing benefits | Capital budgeting; compare against hurdle rates |
Climate value at risk (Climate VaR) | Estimated impact of transition and physical risks on asset values and cash flows | Balance-sheet resilience; informs asset write-downs and debt covenants |
Emissions reduced per $1 million invested | Emissions reduced per dollar invested | Portfolio-level capital allocation; benchmarking across business units |
MAC curves show which projects cut the most emissions for each dollar spent. Used early, they help finance sort through options before the budget gets locked. Many abatement measures below $50 per metric ton are zero or negative cost, especially LED retrofits, HVAC upgrades, and process optimization. McKinsey's U.S. abatement analysis estimates that 40–45% of achievable reductions - roughly 1.3 to 2.0 gigatons CO2e in 2030 scenarios - fall into this category [7].
Internal carbon pricing turns that curve into something a capital budgeting process can act on. Microsoft offers a clear example. Its price started at $5–$10 per metric ton CO2e in 2012 and rose to $100 per metric ton for Scope 3 air travel by FY 2022–23 to reflect higher mitigation costs, including sustainable aviation fuels [5][8].
On the risk side, Climate VaR translates climate exposure into balance-sheet terms. It shows how transition risk and physical risk can reduce asset value and cash flow [9]. Putting that exposure in dollar terms gives boards and CFOs a direct reason to move faster on decarbonization spend - not as a side program, but as a way to protect enterprise value.
Use scenario planning to test financial resilience
Once you have the metrics, the next step is to pressure-test them. Scenario planning helps finance teams see whether today's numbers still make sense under plausible climate futures. In plain terms, that means modeling how different climate paths could hit revenue, costs, asset values, and capital needs before those pressures show up in reported results.
Build transition and physical risk scenarios
Start with a materiality assessment. Map which climate risks could affect your financial statements and core metrics. Transition risks - carbon pricing, rule changes, tech shifts, and demand swings - tend to matter most for budgeting. Physical risks - floods, hurricanes, wildfires, and chronic heat - hit hardest when you're dealing with long-lived assets and infrastructure.
A common place to begin is the NGFS (Network for Greening the Financial System) framework, which sorts climate pathways into three families: orderly transition, delayed or disorderly transition, and high-physical-risk pathway [14][15][16].
Orderly transition: Early, predictable policy action limits warming to around 1.5–2°C. Both transition and physical risks stay fairly contained.
Delayed/disorderly transition: Policy shows up late and fast, pushing carbon prices higher and creating rule volatility.
High-physical-risk pathway: Limited policy action leads to 3°C+ warming, with more severe floods, storms, and heat stress.
TCFD-style guidance, now reflected in IFRS S2, calls for at least one scenario at or below 2°C and at least one higher-warming scenario [21][22]. Use time horizons that line up with how the business already plans: short term (0–3 years) for budgets, medium term (3–10 years) for strategic plans, and long term (10–30+ years) for infrastructure and asset-life decisions [13][17]. For each scenario, spell out the assumptions behind policy, carbon prices, tech costs, demand, insurance, and physical hazard severity.
Quantify business and financial impacts
The real work starts when you translate each scenario into revenue, cost, asset, and capital effects. Every pathway puts pressure on the income statement and balance sheet in a different way.
Financial metric | Orderly transition | Delayed transition | High-physical-risk pathway |
|---|---|---|---|
Revenue | Growth in low-carbon segments; stable pass-through | Sudden demand shocks; market share volatility | Disruption from physical supply chain failures |
OPEX | Predictable carbon cost increases; efficiency gains offset some impact | Sharp spikes in energy and carbon costs | High maintenance costs; extreme insurance premiums |
CAPEX | Higher near-term spend on low-carbon technology | Expensive, rushed "catch-up" investments | High spend on physical hardening and asset relocation |
Asset value | Planned transition; minimal stranding | Rapid impairment of high-carbon assets | Physical loss of assets; uninsurable properties |
Cost of capital | Lower WACC for well-aligned firms | Higher risk premiums due to policy uncertainty | High WACC from systemic physical risk exposure |
These outputs give finance something concrete to act on: re-rank projects, adjust hurdle rates, and flag assets that may need adaptation or early retirement.
The dollar impact can be large. McKinsey estimates statistically expected damage to capital stock from riverine flooding could rise from roughly $35 billion per year globally today to $140 billion by 2050 [18][19][20]. That kind of shift can't sit in a side memo. It has to feed into planning.
For stranded-asset risk, use IAS 36 impairment testing with scenario-adjusted cash flows. A U.S. energy company, for example, might find that certain gas-fired assets recover their carrying value only under a delayed transition pathway. Under an orderly pathway, falling dispatch and rising carbon prices may eat away at returns well before the asset's planned retirement date.
Apply scenario results to planning decisions
The clearest use case is stress-testing the annual budget and rolling forecasts. Take the carbon price, energy cost, and insurance assumptions from each scenario and run them through your current cost models. That's where this stops being a climate exercise and starts becoming a finance exercise.
At the portfolio level, scenario-based discount rates, cash-flow projections, and risk premiums can help spot assets at impairment risk. Projects that only work under a delayed-transition case - where carbon costs stay low for another decade - may look fine on paper but carry hidden downside. Flagging those projects early gives finance room to either reprice them with a climate-adjusted IRR or shift capital toward investments that hold up across more than one scenario.
Use scenario results to re-rank projects, adjust hurdle rates, and set adaptation triggers for high-risk assets. That turns risk awareness into day-to-day budget and forecast decisions.
Allocate capital and build a transition plan
Scenario results matter only when they change where the money goes. That means using scenario outputs to rank projects, set hurdle rates, and decide which funding source fits each move.
Prioritize low-carbon and resilience investments
Start by cutting demand. Lower total energy use before spending on new supply. Building upgrades, HVAC improvements, and process optimization shrink the capacity - and cost - of everything that comes next, including electrification and renewable energy procurement.
After that, finance teams can sort competing projects with a screening framework that blends financial thresholds with emissions and resilience metrics. In practice, that means putting 2–3 year payback efficiency upgrades at the front of the line, then phasing in fleet electrification and retrofits that need more upfront capital but can deliver deeper emissions cuts over 10–15 years. [27][28]
Internal carbon pricing gives finance teams a plain way to make low-carbon projects show up in standard capital approval reviews. Apply a $50–$100 per metric ton shadow price, and increase it as policy risk grows, to each project's lifetime emissions. Then rework NPV and IRR using that added cost. [25][26] IFRS S2 also says that companies using internal carbon prices must disclose the exact price per metric ton and how that price is used in investment decisions. [25]
Use this comparison to sort investment choices by finance impact:
Investment Choice | NPV Impact | Emissions Impact | Payback Period | Risk Profile |
|---|---|---|---|---|
Retrofit (Efficiency) | Positive | Moderate | Short (2–5 years) | Low; proven technology |
Replace (Electrification) | Moderate | High | Medium (5–10 years) | Moderate; grid dependency |
Direct Abatement | Variable | Very High | Long | Low; permanent reduction |
Carbon Credits | Negative | Low (offset only) | Immediate | High; regulatory and reputational |
Offsets should stay in a small, controlled role. Use them only for residual emissions that remain after direct abatement. Set a rule that at least 90% of the target must come from direct abatement, with credits held back for hard-to-abate residual emissions. [24][25][27]
Structure the transition plan for finance and operations
A plan needs more than a target year and a slide deck. It has to connect governance, a verified emissions baseline across Scope 1, 2, and relevant Scope 3, named decarbonization levers with cost-per-ton estimates, dated milestones for 2025, 2030, and 2040, funding sources, key dependencies such as grid decarbonization or permitting timelines, and a clear approach to residual emissions. [24][27][28]
Each piece should land somewhere in the financial plan. Decarbonization levers turn into CAPEX and OPEX schedules. Milestones shape the long-range plan. Funding sources - internal cash, green bonds, sustainability-linked loans, tax credits and incentives, or public-private partnerships - change leverage ratios and interest coverage. [23][27] Sustainability-linked loans go a step further by tying borrowing costs to climate KPIs. That makes clear planning and reporting a financial issue, not just a disclosure task. [30]
IFRS S2 guidance notes that entities may need to disclose planned climate-related capital expenditure in absolute terms and as a share of total capital expenditure, with time horizons that line up with stated targets. [24]
Operationalize implementation across stakeholders
Even a solid transition plan can stall if it sits in a sustainability spreadsheet and nowhere else. Execution depends on teams working from the same playbook: procurement choosing suppliers based on lifecycle carbon cost, not only unit price; business unit leaders owning their part of the emissions baseline; and ERM frameworks updated to include transition and physical climate risks alongside standard financial risks. [27][28]
This is where plans often bog down. Coordinating across business units, communities, suppliers, and public partners - and making sure each group has a reason to act - is usually the hard part. [3][29][31] If no one owns a milestone, the plan stays theoretical. Give finance, operations, procurement, and ERM named owners so every milestone has both a budget holder and a deadline.
Link plans to reporting, governance, and next steps
A net-zero financial plan has to hold up under investor, board, and regulatory scrutiny. That means it can't sit off to the side as a strategy document. It has to connect straight into the disclosure frameworks stakeholders already use.
Once a transition plan is funded, those same assumptions need to carry through into reporting and board oversight.
Align financial planning with IFRS S2, IFRS S1, and TCFD-style disclosure
IFRS S2 aligns with TCFD's four pillars, while IFRS S1 requires companies to disclose sustainability-related risks and opportunities that could affect cash flow, access to finance, or cost of capital in a way that matches the financial statements.[1][32][34][35][40]
Use the table below to connect each part of the plan to the matching disclosure requirement and the metric used for internal control.
Net-Zero Plan Component | IFRS S2 / TCFD Pillar | Internal Planning Metric |
|---|---|---|
Governance | Governance | Board-approved transition budget vs. actual spend |
Strategy | Strategy | % of CAPEX allocated to low-carbon projects |
Scenario Analysis | Strategy | Documented scenario assumptions and financial sensitivity |
Risk Management | Risk Management | Value-at-Risk from climate scenarios |
Scope 1, 2, and 3 Emissions | Metrics & Targets | Absolute emissions vs. baseline; annual reduction achieved |
Transition Plan | Strategy | Budgeted vs. actual decarbonization CAPEX |
Carbon Credits | Metrics & Targets | Volume, cost per ton CO₂e, and credit type (removal vs. avoidance) |
One item that often gets thin treatment is carbon credit assumptions. IFRS S2 requires companies to disclose the extent and conditions of any reliance on credits to meet targets, including quality criteria and how those credits are reflected in the transition plan.[24][33][37][38] Finance teams should model credit pricing and availability, then clearly separate direct emissions cuts from offsets in disclosure.
Track progress through management reporting
The disclosure map above should do more than support annual compliance. It should shape monthly and quarterly management reporting too.
Climate metrics need to run on the same reporting cadence as the rest of the business. Monthly tracking should cover operational emissions and energy intensity. Quarterly reviews should show CAPEX deployed, progress against interim targets, and variance from plan. Annual cycles should pull that work into budget updates, long-range forecasts, and IFRS S1/S2 disclosures.[36][39]
Dashboards should put emissions data next to cost savings, capital deployed, and risk exposure. That line matters. When reporting mixes up what is planned with what is funded, progress often looks better on paper than it does in practice. If a quarterly review shows a project slipping, run a gap-to-target review and act on it by:
Reallocating capital
Addressing external bottlenecks through policy engagement
Intervening with suppliers
Board reporting works best when it uses the same terms as enterprise performance management: margin, cash flow, capital efficiency, and risk. Board packets should show whether funded projects are closing the gap to targets. Assigning climate oversight to an existing committee - audit, risk, or a dedicated sustainability committee - and folding it into standard board packets helps keep climate from turning into a side conversation.[36][39][41] Tying part of executive compensation to Scope 1 and Scope 2 reduction milestones can also keep accountability in place.[36][39]
When reporting, governance, and capital planning all run on the same numbers, net-zero shifts from aspiration to day-to-day execution.
Conclusion: The finance-led path to net-zero
Net-zero progress comes from execution discipline, not ambition. The organizations making headway are the ones where net-zero shows up in budgets, board packets, management dashboards, and disclosure reports - not just in sustainability commitments. Finance is the operating system for net-zero because it determines what gets funded, tracked, adjusted, and reported. That is the finance-led path to net-zero.
FAQs
How do I choose a net-zero baseline year?
Choose a year that reflects your organization’s normal emissions profile. Skip years shaped by unusual events, such as major acquisitions, divestitures, or disruptions like the COVID-19 pandemic.
Your baseline year should reflect a stable period of operations and give you a solid starting point for tracking future cuts across Scope 1, 2, and 3 emissions.
What should go into a climate scenario analysis?
A climate scenario analysis should test your strategy against at least two future paths: an orderly transition in the 1.5°C to 2°C range and a high-warming scenario of 3°C+. It should also account for disorderly transitions, especially those triggered by delayed policy action.
The point is simple: move climate risk out of the abstract and into business terms. That means translating physical and transition risks into financial effects on revenue, operating costs, asset values, and capital needs.
Be explicit about the variables shaping each scenario. These often include:
Carbon prices
Energy mix
Policy timing
Local climate risks
Just as important, document your assumptions and limitations clearly. If a scenario depends on a certain policy rollout, fuel mix, or regional hazard pattern, say so plainly. That makes the analysis easier to interpret - and far more useful when leaders have to make calls under uncertainty.
How much should we rely on carbon offsets?
Use carbon offsets with restraint. If you're working toward net-zero, don't lean on carbon credits to hit near-term targets. Science-based guidance does not count those credits as part of near-term emissions cuts.
For long-term residual emissions, neutralize only with permanent carbon dioxide removals (CDR), not avoidance offsets. In plain terms, cut your own emissions first. Then use credits as supplemental climate finance - not as a substitute for direct reductions.
Related Blog Posts
Latest Articles
©2026

Narrative Change and Power Building: The Missing Half of Advocacy
Narrative change is the process of disrupting dominant narratives that normalize inequity and advancing new narratives from historically marginalized communities.

Funding Resilience Without Federal Grants
BRIC is unreliable and FEMA is shrinking. Here's how cities fund climate resilience with dedicated revenue, blended finance, and a coordinating authority.

The ESG Blind Spot: How AI Is Finding Risks in Companies Nobody Else Is Watching
Norway's sovereign wealth fund uses AI to screen 7,200 portfolio companies for forced labor and corruption within 24 hours. The real story is the emerging-market coverage gap that traditional ESG data vendors miss — and what it means for any company with a global supply chain.
Narrative Change and Power Building: The Missing Half of Advocacy
Narrative change is the process of disrupting dominant narratives that normalize inequity and advancing new narratives from historically marginalized communities.
Funding Resilience Without Federal Grants
BRIC is unreliable and FEMA is shrinking. Here's how cities fund climate resilience with dedicated revenue, blended finance, and a coordinating authority.
The ESG Blind Spot: How AI Is Finding Risks in Companies Nobody Else Is Watching
Norway's sovereign wealth fund uses AI to screen 7,200 portfolio companies for forced labor and corruption within 24 hours. The real story is the emerging-market coverage gap that traditional ESG data vendors miss — and what it means for any company with a global supply chain.
FAQ
01
What does it really mean to “redefine profit”?
02
What makes Council Fire different?
03
Who does Council Fire work with?
04
What does working with Council Fire actually look like?
05
How does Council Fire help organizations turn big goals into action?
06
How does Council Fire define and measure success?
07
How does technology fit into Council Fire’s work?
Sep 2, 2026
Financial Planning For Net-Zero: Guide
Sustainability Strategy
In This Article
Turn net-zero targets into funded budgets: set baselines, run scenarios, rank abatement by cost, and embed CAPEX in IFRS S2.
Financial Planning For Net-Zero: Guide
Net-zero plans fail when they stay outside the budget. I’d treat net-zero as a finance issue first: set a base year, define Scope 1, 2, and key Scope 3 limits, build 5-year targets, test carbon-price and physical-risk scenarios, rank projects by cost per ton and return, and track funded work in board and management reports.
Here’s the short version:
Money drives progress: Net zero by 2050 may need about $9.2 trillion per year in global physical-asset spending.
Targets need rules: I’d set a base year with complete data, clear GHG boundaries, and written reset rules for major structural changes.
Use finance metrics: Focus on marginal abatement cost, internal carbon price, climate-adjusted IRR/payback, and climate VaR.
Run scenarios: Test at least a low-warming path and a higher-warming path across revenue, OPEX, CAPEX, asset value, and cost of capital.
Fund the right projects: Start with efficiency, then electrification and other direct cuts. Keep offsets for residual emissions.
Tie plans to reporting: Link budgets, forecasts, board oversight, and IFRS S1/S2 disclosure to the same numbers.
A few figures stand out. Firms with solid transition plans may lower cost of capital by 39 to 85 basis points. Many abatement moves under $50 per metric ton can be zero or negative cost. And global flood damage to capital stock could move from about $35 billion per year today to $140 billion by 2050.
If I were building a net-zero plan, I’d keep one rule in front of me: if it isn’t funded, timed, owned, and reported, it isn’t a plan.
This guide shows how to turn a climate target into a budgeted path with clear metrics, scenario tests, capital choices, and board-level follow-through.
Net-Zero Financial Planning: Key Metrics, Scenarios & Capital Priorities
Interview. Cash and Carbon: Making efficient financial moves to net-zero
Define net-zero targets as financial objectives
A net-zero pledge starts to matter when finance turns it into an emissions path, a capital plan, and yearly milestones that sit inside the budget. Until then, it’s just intent on paper.
Set boundaries, interim targets, and decision rules
Three moves set the financial base.
First, choose a baseline year. In most cases, that should be the latest 12-month period with complete, dependable data. For SBTi-aligned targets, base years should be no earlier than 2015 [12]. Use at least 12 months of complete Scope 1 and Scope 2 data, with material Scope 3 sources included where relevant [10][11]. It also helps to note unusual events - plant shutdowns, one-time acquisitions, or other one-off shifts - so later comparisons stay honest and finance can measure results against budget assumptions.
Second, set emissions inventory boundaries under the GHG Protocol - operational control, financial control, or equity share. Those boundaries should cover at least 95% of Scope 1 and 2 emissions [6][12].
Third, set interim targets at about five-year intervals. The U.S. Treasury's Principles for Net-Zero Financing & Investment call for interim targets for 2030 or sooner, then every five years or less [2].
Use both absolute and intensity targets. That matters because growth, acquisitions, and divestitures can blur the picture if you rely on only one lens. Finance teams should also set written decision rules for when a baseline can be recalibrated. The rule is simple: material structural changes count, but organic growth does not [4].
Once those target boundaries are locked in, finance needs metrics it can actually use in capital planning.
Choose metrics finance teams can use
The next step is to pick metrics that tie emissions performance to budget and investment choices. These tools help teams rank projects, apply a carbon cost, and test asset risk.
Metric | What it measures | Financial use |
|---|---|---|
Marginal abatement cost (MAC) | Cost per metric ton CO2e avoided by a specific project | CAPEX prioritization; MAC curves rank projects from lowest to highest cost per ton |
Internal carbon price (ICP) | Shadow price applied to projected emissions in investment decisions | CAPEX approvals, procurement, product pricing |
Payback period (climate-adjusted) | Time to recover investment, including avoided carbon costs and regulatory risk | Project screening alongside standard payback thresholds |
IRR (climate-adjusted) | Return on investment factoring in future carbon costs and green financing benefits | Capital budgeting; compare against hurdle rates |
Climate value at risk (Climate VaR) | Estimated impact of transition and physical risks on asset values and cash flows | Balance-sheet resilience; informs asset write-downs and debt covenants |
Emissions reduced per $1 million invested | Emissions reduced per dollar invested | Portfolio-level capital allocation; benchmarking across business units |
MAC curves show which projects cut the most emissions for each dollar spent. Used early, they help finance sort through options before the budget gets locked. Many abatement measures below $50 per metric ton are zero or negative cost, especially LED retrofits, HVAC upgrades, and process optimization. McKinsey's U.S. abatement analysis estimates that 40–45% of achievable reductions - roughly 1.3 to 2.0 gigatons CO2e in 2030 scenarios - fall into this category [7].
Internal carbon pricing turns that curve into something a capital budgeting process can act on. Microsoft offers a clear example. Its price started at $5–$10 per metric ton CO2e in 2012 and rose to $100 per metric ton for Scope 3 air travel by FY 2022–23 to reflect higher mitigation costs, including sustainable aviation fuels [5][8].
On the risk side, Climate VaR translates climate exposure into balance-sheet terms. It shows how transition risk and physical risk can reduce asset value and cash flow [9]. Putting that exposure in dollar terms gives boards and CFOs a direct reason to move faster on decarbonization spend - not as a side program, but as a way to protect enterprise value.
Use scenario planning to test financial resilience
Once you have the metrics, the next step is to pressure-test them. Scenario planning helps finance teams see whether today's numbers still make sense under plausible climate futures. In plain terms, that means modeling how different climate paths could hit revenue, costs, asset values, and capital needs before those pressures show up in reported results.
Build transition and physical risk scenarios
Start with a materiality assessment. Map which climate risks could affect your financial statements and core metrics. Transition risks - carbon pricing, rule changes, tech shifts, and demand swings - tend to matter most for budgeting. Physical risks - floods, hurricanes, wildfires, and chronic heat - hit hardest when you're dealing with long-lived assets and infrastructure.
A common place to begin is the NGFS (Network for Greening the Financial System) framework, which sorts climate pathways into three families: orderly transition, delayed or disorderly transition, and high-physical-risk pathway [14][15][16].
Orderly transition: Early, predictable policy action limits warming to around 1.5–2°C. Both transition and physical risks stay fairly contained.
Delayed/disorderly transition: Policy shows up late and fast, pushing carbon prices higher and creating rule volatility.
High-physical-risk pathway: Limited policy action leads to 3°C+ warming, with more severe floods, storms, and heat stress.
TCFD-style guidance, now reflected in IFRS S2, calls for at least one scenario at or below 2°C and at least one higher-warming scenario [21][22]. Use time horizons that line up with how the business already plans: short term (0–3 years) for budgets, medium term (3–10 years) for strategic plans, and long term (10–30+ years) for infrastructure and asset-life decisions [13][17]. For each scenario, spell out the assumptions behind policy, carbon prices, tech costs, demand, insurance, and physical hazard severity.
Quantify business and financial impacts
The real work starts when you translate each scenario into revenue, cost, asset, and capital effects. Every pathway puts pressure on the income statement and balance sheet in a different way.
Financial metric | Orderly transition | Delayed transition | High-physical-risk pathway |
|---|---|---|---|
Revenue | Growth in low-carbon segments; stable pass-through | Sudden demand shocks; market share volatility | Disruption from physical supply chain failures |
OPEX | Predictable carbon cost increases; efficiency gains offset some impact | Sharp spikes in energy and carbon costs | High maintenance costs; extreme insurance premiums |
CAPEX | Higher near-term spend on low-carbon technology | Expensive, rushed "catch-up" investments | High spend on physical hardening and asset relocation |
Asset value | Planned transition; minimal stranding | Rapid impairment of high-carbon assets | Physical loss of assets; uninsurable properties |
Cost of capital | Lower WACC for well-aligned firms | Higher risk premiums due to policy uncertainty | High WACC from systemic physical risk exposure |
These outputs give finance something concrete to act on: re-rank projects, adjust hurdle rates, and flag assets that may need adaptation or early retirement.
The dollar impact can be large. McKinsey estimates statistically expected damage to capital stock from riverine flooding could rise from roughly $35 billion per year globally today to $140 billion by 2050 [18][19][20]. That kind of shift can't sit in a side memo. It has to feed into planning.
For stranded-asset risk, use IAS 36 impairment testing with scenario-adjusted cash flows. A U.S. energy company, for example, might find that certain gas-fired assets recover their carrying value only under a delayed transition pathway. Under an orderly pathway, falling dispatch and rising carbon prices may eat away at returns well before the asset's planned retirement date.
Apply scenario results to planning decisions
The clearest use case is stress-testing the annual budget and rolling forecasts. Take the carbon price, energy cost, and insurance assumptions from each scenario and run them through your current cost models. That's where this stops being a climate exercise and starts becoming a finance exercise.
At the portfolio level, scenario-based discount rates, cash-flow projections, and risk premiums can help spot assets at impairment risk. Projects that only work under a delayed-transition case - where carbon costs stay low for another decade - may look fine on paper but carry hidden downside. Flagging those projects early gives finance room to either reprice them with a climate-adjusted IRR or shift capital toward investments that hold up across more than one scenario.
Use scenario results to re-rank projects, adjust hurdle rates, and set adaptation triggers for high-risk assets. That turns risk awareness into day-to-day budget and forecast decisions.
Allocate capital and build a transition plan
Scenario results matter only when they change where the money goes. That means using scenario outputs to rank projects, set hurdle rates, and decide which funding source fits each move.
Prioritize low-carbon and resilience investments
Start by cutting demand. Lower total energy use before spending on new supply. Building upgrades, HVAC improvements, and process optimization shrink the capacity - and cost - of everything that comes next, including electrification and renewable energy procurement.
After that, finance teams can sort competing projects with a screening framework that blends financial thresholds with emissions and resilience metrics. In practice, that means putting 2–3 year payback efficiency upgrades at the front of the line, then phasing in fleet electrification and retrofits that need more upfront capital but can deliver deeper emissions cuts over 10–15 years. [27][28]
Internal carbon pricing gives finance teams a plain way to make low-carbon projects show up in standard capital approval reviews. Apply a $50–$100 per metric ton shadow price, and increase it as policy risk grows, to each project's lifetime emissions. Then rework NPV and IRR using that added cost. [25][26] IFRS S2 also says that companies using internal carbon prices must disclose the exact price per metric ton and how that price is used in investment decisions. [25]
Use this comparison to sort investment choices by finance impact:
Investment Choice | NPV Impact | Emissions Impact | Payback Period | Risk Profile |
|---|---|---|---|---|
Retrofit (Efficiency) | Positive | Moderate | Short (2–5 years) | Low; proven technology |
Replace (Electrification) | Moderate | High | Medium (5–10 years) | Moderate; grid dependency |
Direct Abatement | Variable | Very High | Long | Low; permanent reduction |
Carbon Credits | Negative | Low (offset only) | Immediate | High; regulatory and reputational |
Offsets should stay in a small, controlled role. Use them only for residual emissions that remain after direct abatement. Set a rule that at least 90% of the target must come from direct abatement, with credits held back for hard-to-abate residual emissions. [24][25][27]
Structure the transition plan for finance and operations
A plan needs more than a target year and a slide deck. It has to connect governance, a verified emissions baseline across Scope 1, 2, and relevant Scope 3, named decarbonization levers with cost-per-ton estimates, dated milestones for 2025, 2030, and 2040, funding sources, key dependencies such as grid decarbonization or permitting timelines, and a clear approach to residual emissions. [24][27][28]
Each piece should land somewhere in the financial plan. Decarbonization levers turn into CAPEX and OPEX schedules. Milestones shape the long-range plan. Funding sources - internal cash, green bonds, sustainability-linked loans, tax credits and incentives, or public-private partnerships - change leverage ratios and interest coverage. [23][27] Sustainability-linked loans go a step further by tying borrowing costs to climate KPIs. That makes clear planning and reporting a financial issue, not just a disclosure task. [30]
IFRS S2 guidance notes that entities may need to disclose planned climate-related capital expenditure in absolute terms and as a share of total capital expenditure, with time horizons that line up with stated targets. [24]
Operationalize implementation across stakeholders
Even a solid transition plan can stall if it sits in a sustainability spreadsheet and nowhere else. Execution depends on teams working from the same playbook: procurement choosing suppliers based on lifecycle carbon cost, not only unit price; business unit leaders owning their part of the emissions baseline; and ERM frameworks updated to include transition and physical climate risks alongside standard financial risks. [27][28]
This is where plans often bog down. Coordinating across business units, communities, suppliers, and public partners - and making sure each group has a reason to act - is usually the hard part. [3][29][31] If no one owns a milestone, the plan stays theoretical. Give finance, operations, procurement, and ERM named owners so every milestone has both a budget holder and a deadline.
Link plans to reporting, governance, and next steps
A net-zero financial plan has to hold up under investor, board, and regulatory scrutiny. That means it can't sit off to the side as a strategy document. It has to connect straight into the disclosure frameworks stakeholders already use.
Once a transition plan is funded, those same assumptions need to carry through into reporting and board oversight.
Align financial planning with IFRS S2, IFRS S1, and TCFD-style disclosure
IFRS S2 aligns with TCFD's four pillars, while IFRS S1 requires companies to disclose sustainability-related risks and opportunities that could affect cash flow, access to finance, or cost of capital in a way that matches the financial statements.[1][32][34][35][40]
Use the table below to connect each part of the plan to the matching disclosure requirement and the metric used for internal control.
Net-Zero Plan Component | IFRS S2 / TCFD Pillar | Internal Planning Metric |
|---|---|---|
Governance | Governance | Board-approved transition budget vs. actual spend |
Strategy | Strategy | % of CAPEX allocated to low-carbon projects |
Scenario Analysis | Strategy | Documented scenario assumptions and financial sensitivity |
Risk Management | Risk Management | Value-at-Risk from climate scenarios |
Scope 1, 2, and 3 Emissions | Metrics & Targets | Absolute emissions vs. baseline; annual reduction achieved |
Transition Plan | Strategy | Budgeted vs. actual decarbonization CAPEX |
Carbon Credits | Metrics & Targets | Volume, cost per ton CO₂e, and credit type (removal vs. avoidance) |
One item that often gets thin treatment is carbon credit assumptions. IFRS S2 requires companies to disclose the extent and conditions of any reliance on credits to meet targets, including quality criteria and how those credits are reflected in the transition plan.[24][33][37][38] Finance teams should model credit pricing and availability, then clearly separate direct emissions cuts from offsets in disclosure.
Track progress through management reporting
The disclosure map above should do more than support annual compliance. It should shape monthly and quarterly management reporting too.
Climate metrics need to run on the same reporting cadence as the rest of the business. Monthly tracking should cover operational emissions and energy intensity. Quarterly reviews should show CAPEX deployed, progress against interim targets, and variance from plan. Annual cycles should pull that work into budget updates, long-range forecasts, and IFRS S1/S2 disclosures.[36][39]
Dashboards should put emissions data next to cost savings, capital deployed, and risk exposure. That line matters. When reporting mixes up what is planned with what is funded, progress often looks better on paper than it does in practice. If a quarterly review shows a project slipping, run a gap-to-target review and act on it by:
Reallocating capital
Addressing external bottlenecks through policy engagement
Intervening with suppliers
Board reporting works best when it uses the same terms as enterprise performance management: margin, cash flow, capital efficiency, and risk. Board packets should show whether funded projects are closing the gap to targets. Assigning climate oversight to an existing committee - audit, risk, or a dedicated sustainability committee - and folding it into standard board packets helps keep climate from turning into a side conversation.[36][39][41] Tying part of executive compensation to Scope 1 and Scope 2 reduction milestones can also keep accountability in place.[36][39]
When reporting, governance, and capital planning all run on the same numbers, net-zero shifts from aspiration to day-to-day execution.
Conclusion: The finance-led path to net-zero
Net-zero progress comes from execution discipline, not ambition. The organizations making headway are the ones where net-zero shows up in budgets, board packets, management dashboards, and disclosure reports - not just in sustainability commitments. Finance is the operating system for net-zero because it determines what gets funded, tracked, adjusted, and reported. That is the finance-led path to net-zero.
FAQs
How do I choose a net-zero baseline year?
Choose a year that reflects your organization’s normal emissions profile. Skip years shaped by unusual events, such as major acquisitions, divestitures, or disruptions like the COVID-19 pandemic.
Your baseline year should reflect a stable period of operations and give you a solid starting point for tracking future cuts across Scope 1, 2, and 3 emissions.
What should go into a climate scenario analysis?
A climate scenario analysis should test your strategy against at least two future paths: an orderly transition in the 1.5°C to 2°C range and a high-warming scenario of 3°C+. It should also account for disorderly transitions, especially those triggered by delayed policy action.
The point is simple: move climate risk out of the abstract and into business terms. That means translating physical and transition risks into financial effects on revenue, operating costs, asset values, and capital needs.
Be explicit about the variables shaping each scenario. These often include:
Carbon prices
Energy mix
Policy timing
Local climate risks
Just as important, document your assumptions and limitations clearly. If a scenario depends on a certain policy rollout, fuel mix, or regional hazard pattern, say so plainly. That makes the analysis easier to interpret - and far more useful when leaders have to make calls under uncertainty.
How much should we rely on carbon offsets?
Use carbon offsets with restraint. If you're working toward net-zero, don't lean on carbon credits to hit near-term targets. Science-based guidance does not count those credits as part of near-term emissions cuts.
For long-term residual emissions, neutralize only with permanent carbon dioxide removals (CDR), not avoidance offsets. In plain terms, cut your own emissions first. Then use credits as supplemental climate finance - not as a substitute for direct reductions.
Related Blog Posts
Latest Articles
©2026
Narrative Change and Power Building: The Missing Half of Advocacy
Narrative change is the process of disrupting dominant narratives that normalize inequity and advancing new narratives from historically marginalized communities.
Funding Resilience Without Federal Grants
BRIC is unreliable and FEMA is shrinking. Here's how cities fund climate resilience with dedicated revenue, blended finance, and a coordinating authority.
The ESG Blind Spot: How AI Is Finding Risks in Companies Nobody Else Is Watching
Norway's sovereign wealth fund uses AI to screen 7,200 portfolio companies for forced labor and corruption within 24 hours. The real story is the emerging-market coverage gap that traditional ESG data vendors miss — and what it means for any company with a global supply chain.
FAQ
01
What does it really mean to “redefine profit”?
02
What makes Council Fire different?
03
Who does Council Fire work with?
04
What does working with Council Fire actually look like?
05
How does Council Fire help organizations turn big goals into action?
06
How does Council Fire define and measure success?
07
How does technology fit into Council Fire’s work?
Sep 2, 2026
Financial Planning For Net-Zero: Guide
Sustainability Strategy
In This Article
Turn net-zero targets into funded budgets: set baselines, run scenarios, rank abatement by cost, and embed CAPEX in IFRS S2.
Financial Planning For Net-Zero: Guide
Net-zero plans fail when they stay outside the budget. I’d treat net-zero as a finance issue first: set a base year, define Scope 1, 2, and key Scope 3 limits, build 5-year targets, test carbon-price and physical-risk scenarios, rank projects by cost per ton and return, and track funded work in board and management reports.
Here’s the short version:
Money drives progress: Net zero by 2050 may need about $9.2 trillion per year in global physical-asset spending.
Targets need rules: I’d set a base year with complete data, clear GHG boundaries, and written reset rules for major structural changes.
Use finance metrics: Focus on marginal abatement cost, internal carbon price, climate-adjusted IRR/payback, and climate VaR.
Run scenarios: Test at least a low-warming path and a higher-warming path across revenue, OPEX, CAPEX, asset value, and cost of capital.
Fund the right projects: Start with efficiency, then electrification and other direct cuts. Keep offsets for residual emissions.
Tie plans to reporting: Link budgets, forecasts, board oversight, and IFRS S1/S2 disclosure to the same numbers.
A few figures stand out. Firms with solid transition plans may lower cost of capital by 39 to 85 basis points. Many abatement moves under $50 per metric ton can be zero or negative cost. And global flood damage to capital stock could move from about $35 billion per year today to $140 billion by 2050.
If I were building a net-zero plan, I’d keep one rule in front of me: if it isn’t funded, timed, owned, and reported, it isn’t a plan.
This guide shows how to turn a climate target into a budgeted path with clear metrics, scenario tests, capital choices, and board-level follow-through.
Net-Zero Financial Planning: Key Metrics, Scenarios & Capital Priorities
Interview. Cash and Carbon: Making efficient financial moves to net-zero
Define net-zero targets as financial objectives
A net-zero pledge starts to matter when finance turns it into an emissions path, a capital plan, and yearly milestones that sit inside the budget. Until then, it’s just intent on paper.
Set boundaries, interim targets, and decision rules
Three moves set the financial base.
First, choose a baseline year. In most cases, that should be the latest 12-month period with complete, dependable data. For SBTi-aligned targets, base years should be no earlier than 2015 [12]. Use at least 12 months of complete Scope 1 and Scope 2 data, with material Scope 3 sources included where relevant [10][11]. It also helps to note unusual events - plant shutdowns, one-time acquisitions, or other one-off shifts - so later comparisons stay honest and finance can measure results against budget assumptions.
Second, set emissions inventory boundaries under the GHG Protocol - operational control, financial control, or equity share. Those boundaries should cover at least 95% of Scope 1 and 2 emissions [6][12].
Third, set interim targets at about five-year intervals. The U.S. Treasury's Principles for Net-Zero Financing & Investment call for interim targets for 2030 or sooner, then every five years or less [2].
Use both absolute and intensity targets. That matters because growth, acquisitions, and divestitures can blur the picture if you rely on only one lens. Finance teams should also set written decision rules for when a baseline can be recalibrated. The rule is simple: material structural changes count, but organic growth does not [4].
Once those target boundaries are locked in, finance needs metrics it can actually use in capital planning.
Choose metrics finance teams can use
The next step is to pick metrics that tie emissions performance to budget and investment choices. These tools help teams rank projects, apply a carbon cost, and test asset risk.
Metric | What it measures | Financial use |
|---|---|---|
Marginal abatement cost (MAC) | Cost per metric ton CO2e avoided by a specific project | CAPEX prioritization; MAC curves rank projects from lowest to highest cost per ton |
Internal carbon price (ICP) | Shadow price applied to projected emissions in investment decisions | CAPEX approvals, procurement, product pricing |
Payback period (climate-adjusted) | Time to recover investment, including avoided carbon costs and regulatory risk | Project screening alongside standard payback thresholds |
IRR (climate-adjusted) | Return on investment factoring in future carbon costs and green financing benefits | Capital budgeting; compare against hurdle rates |
Climate value at risk (Climate VaR) | Estimated impact of transition and physical risks on asset values and cash flows | Balance-sheet resilience; informs asset write-downs and debt covenants |
Emissions reduced per $1 million invested | Emissions reduced per dollar invested | Portfolio-level capital allocation; benchmarking across business units |
MAC curves show which projects cut the most emissions for each dollar spent. Used early, they help finance sort through options before the budget gets locked. Many abatement measures below $50 per metric ton are zero or negative cost, especially LED retrofits, HVAC upgrades, and process optimization. McKinsey's U.S. abatement analysis estimates that 40–45% of achievable reductions - roughly 1.3 to 2.0 gigatons CO2e in 2030 scenarios - fall into this category [7].
Internal carbon pricing turns that curve into something a capital budgeting process can act on. Microsoft offers a clear example. Its price started at $5–$10 per metric ton CO2e in 2012 and rose to $100 per metric ton for Scope 3 air travel by FY 2022–23 to reflect higher mitigation costs, including sustainable aviation fuels [5][8].
On the risk side, Climate VaR translates climate exposure into balance-sheet terms. It shows how transition risk and physical risk can reduce asset value and cash flow [9]. Putting that exposure in dollar terms gives boards and CFOs a direct reason to move faster on decarbonization spend - not as a side program, but as a way to protect enterprise value.
Use scenario planning to test financial resilience
Once you have the metrics, the next step is to pressure-test them. Scenario planning helps finance teams see whether today's numbers still make sense under plausible climate futures. In plain terms, that means modeling how different climate paths could hit revenue, costs, asset values, and capital needs before those pressures show up in reported results.
Build transition and physical risk scenarios
Start with a materiality assessment. Map which climate risks could affect your financial statements and core metrics. Transition risks - carbon pricing, rule changes, tech shifts, and demand swings - tend to matter most for budgeting. Physical risks - floods, hurricanes, wildfires, and chronic heat - hit hardest when you're dealing with long-lived assets and infrastructure.
A common place to begin is the NGFS (Network for Greening the Financial System) framework, which sorts climate pathways into three families: orderly transition, delayed or disorderly transition, and high-physical-risk pathway [14][15][16].
Orderly transition: Early, predictable policy action limits warming to around 1.5–2°C. Both transition and physical risks stay fairly contained.
Delayed/disorderly transition: Policy shows up late and fast, pushing carbon prices higher and creating rule volatility.
High-physical-risk pathway: Limited policy action leads to 3°C+ warming, with more severe floods, storms, and heat stress.
TCFD-style guidance, now reflected in IFRS S2, calls for at least one scenario at or below 2°C and at least one higher-warming scenario [21][22]. Use time horizons that line up with how the business already plans: short term (0–3 years) for budgets, medium term (3–10 years) for strategic plans, and long term (10–30+ years) for infrastructure and asset-life decisions [13][17]. For each scenario, spell out the assumptions behind policy, carbon prices, tech costs, demand, insurance, and physical hazard severity.
Quantify business and financial impacts
The real work starts when you translate each scenario into revenue, cost, asset, and capital effects. Every pathway puts pressure on the income statement and balance sheet in a different way.
Financial metric | Orderly transition | Delayed transition | High-physical-risk pathway |
|---|---|---|---|
Revenue | Growth in low-carbon segments; stable pass-through | Sudden demand shocks; market share volatility | Disruption from physical supply chain failures |
OPEX | Predictable carbon cost increases; efficiency gains offset some impact | Sharp spikes in energy and carbon costs | High maintenance costs; extreme insurance premiums |
CAPEX | Higher near-term spend on low-carbon technology | Expensive, rushed "catch-up" investments | High spend on physical hardening and asset relocation |
Asset value | Planned transition; minimal stranding | Rapid impairment of high-carbon assets | Physical loss of assets; uninsurable properties |
Cost of capital | Lower WACC for well-aligned firms | Higher risk premiums due to policy uncertainty | High WACC from systemic physical risk exposure |
These outputs give finance something concrete to act on: re-rank projects, adjust hurdle rates, and flag assets that may need adaptation or early retirement.
The dollar impact can be large. McKinsey estimates statistically expected damage to capital stock from riverine flooding could rise from roughly $35 billion per year globally today to $140 billion by 2050 [18][19][20]. That kind of shift can't sit in a side memo. It has to feed into planning.
For stranded-asset risk, use IAS 36 impairment testing with scenario-adjusted cash flows. A U.S. energy company, for example, might find that certain gas-fired assets recover their carrying value only under a delayed transition pathway. Under an orderly pathway, falling dispatch and rising carbon prices may eat away at returns well before the asset's planned retirement date.
Apply scenario results to planning decisions
The clearest use case is stress-testing the annual budget and rolling forecasts. Take the carbon price, energy cost, and insurance assumptions from each scenario and run them through your current cost models. That's where this stops being a climate exercise and starts becoming a finance exercise.
At the portfolio level, scenario-based discount rates, cash-flow projections, and risk premiums can help spot assets at impairment risk. Projects that only work under a delayed-transition case - where carbon costs stay low for another decade - may look fine on paper but carry hidden downside. Flagging those projects early gives finance room to either reprice them with a climate-adjusted IRR or shift capital toward investments that hold up across more than one scenario.
Use scenario results to re-rank projects, adjust hurdle rates, and set adaptation triggers for high-risk assets. That turns risk awareness into day-to-day budget and forecast decisions.
Allocate capital and build a transition plan
Scenario results matter only when they change where the money goes. That means using scenario outputs to rank projects, set hurdle rates, and decide which funding source fits each move.
Prioritize low-carbon and resilience investments
Start by cutting demand. Lower total energy use before spending on new supply. Building upgrades, HVAC improvements, and process optimization shrink the capacity - and cost - of everything that comes next, including electrification and renewable energy procurement.
After that, finance teams can sort competing projects with a screening framework that blends financial thresholds with emissions and resilience metrics. In practice, that means putting 2–3 year payback efficiency upgrades at the front of the line, then phasing in fleet electrification and retrofits that need more upfront capital but can deliver deeper emissions cuts over 10–15 years. [27][28]
Internal carbon pricing gives finance teams a plain way to make low-carbon projects show up in standard capital approval reviews. Apply a $50–$100 per metric ton shadow price, and increase it as policy risk grows, to each project's lifetime emissions. Then rework NPV and IRR using that added cost. [25][26] IFRS S2 also says that companies using internal carbon prices must disclose the exact price per metric ton and how that price is used in investment decisions. [25]
Use this comparison to sort investment choices by finance impact:
Investment Choice | NPV Impact | Emissions Impact | Payback Period | Risk Profile |
|---|---|---|---|---|
Retrofit (Efficiency) | Positive | Moderate | Short (2–5 years) | Low; proven technology |
Replace (Electrification) | Moderate | High | Medium (5–10 years) | Moderate; grid dependency |
Direct Abatement | Variable | Very High | Long | Low; permanent reduction |
Carbon Credits | Negative | Low (offset only) | Immediate | High; regulatory and reputational |
Offsets should stay in a small, controlled role. Use them only for residual emissions that remain after direct abatement. Set a rule that at least 90% of the target must come from direct abatement, with credits held back for hard-to-abate residual emissions. [24][25][27]
Structure the transition plan for finance and operations
A plan needs more than a target year and a slide deck. It has to connect governance, a verified emissions baseline across Scope 1, 2, and relevant Scope 3, named decarbonization levers with cost-per-ton estimates, dated milestones for 2025, 2030, and 2040, funding sources, key dependencies such as grid decarbonization or permitting timelines, and a clear approach to residual emissions. [24][27][28]
Each piece should land somewhere in the financial plan. Decarbonization levers turn into CAPEX and OPEX schedules. Milestones shape the long-range plan. Funding sources - internal cash, green bonds, sustainability-linked loans, tax credits and incentives, or public-private partnerships - change leverage ratios and interest coverage. [23][27] Sustainability-linked loans go a step further by tying borrowing costs to climate KPIs. That makes clear planning and reporting a financial issue, not just a disclosure task. [30]
IFRS S2 guidance notes that entities may need to disclose planned climate-related capital expenditure in absolute terms and as a share of total capital expenditure, with time horizons that line up with stated targets. [24]
Operationalize implementation across stakeholders
Even a solid transition plan can stall if it sits in a sustainability spreadsheet and nowhere else. Execution depends on teams working from the same playbook: procurement choosing suppliers based on lifecycle carbon cost, not only unit price; business unit leaders owning their part of the emissions baseline; and ERM frameworks updated to include transition and physical climate risks alongside standard financial risks. [27][28]
This is where plans often bog down. Coordinating across business units, communities, suppliers, and public partners - and making sure each group has a reason to act - is usually the hard part. [3][29][31] If no one owns a milestone, the plan stays theoretical. Give finance, operations, procurement, and ERM named owners so every milestone has both a budget holder and a deadline.
Link plans to reporting, governance, and next steps
A net-zero financial plan has to hold up under investor, board, and regulatory scrutiny. That means it can't sit off to the side as a strategy document. It has to connect straight into the disclosure frameworks stakeholders already use.
Once a transition plan is funded, those same assumptions need to carry through into reporting and board oversight.
Align financial planning with IFRS S2, IFRS S1, and TCFD-style disclosure
IFRS S2 aligns with TCFD's four pillars, while IFRS S1 requires companies to disclose sustainability-related risks and opportunities that could affect cash flow, access to finance, or cost of capital in a way that matches the financial statements.[1][32][34][35][40]
Use the table below to connect each part of the plan to the matching disclosure requirement and the metric used for internal control.
Net-Zero Plan Component | IFRS S2 / TCFD Pillar | Internal Planning Metric |
|---|---|---|
Governance | Governance | Board-approved transition budget vs. actual spend |
Strategy | Strategy | % of CAPEX allocated to low-carbon projects |
Scenario Analysis | Strategy | Documented scenario assumptions and financial sensitivity |
Risk Management | Risk Management | Value-at-Risk from climate scenarios |
Scope 1, 2, and 3 Emissions | Metrics & Targets | Absolute emissions vs. baseline; annual reduction achieved |
Transition Plan | Strategy | Budgeted vs. actual decarbonization CAPEX |
Carbon Credits | Metrics & Targets | Volume, cost per ton CO₂e, and credit type (removal vs. avoidance) |
One item that often gets thin treatment is carbon credit assumptions. IFRS S2 requires companies to disclose the extent and conditions of any reliance on credits to meet targets, including quality criteria and how those credits are reflected in the transition plan.[24][33][37][38] Finance teams should model credit pricing and availability, then clearly separate direct emissions cuts from offsets in disclosure.
Track progress through management reporting
The disclosure map above should do more than support annual compliance. It should shape monthly and quarterly management reporting too.
Climate metrics need to run on the same reporting cadence as the rest of the business. Monthly tracking should cover operational emissions and energy intensity. Quarterly reviews should show CAPEX deployed, progress against interim targets, and variance from plan. Annual cycles should pull that work into budget updates, long-range forecasts, and IFRS S1/S2 disclosures.[36][39]
Dashboards should put emissions data next to cost savings, capital deployed, and risk exposure. That line matters. When reporting mixes up what is planned with what is funded, progress often looks better on paper than it does in practice. If a quarterly review shows a project slipping, run a gap-to-target review and act on it by:
Reallocating capital
Addressing external bottlenecks through policy engagement
Intervening with suppliers
Board reporting works best when it uses the same terms as enterprise performance management: margin, cash flow, capital efficiency, and risk. Board packets should show whether funded projects are closing the gap to targets. Assigning climate oversight to an existing committee - audit, risk, or a dedicated sustainability committee - and folding it into standard board packets helps keep climate from turning into a side conversation.[36][39][41] Tying part of executive compensation to Scope 1 and Scope 2 reduction milestones can also keep accountability in place.[36][39]
When reporting, governance, and capital planning all run on the same numbers, net-zero shifts from aspiration to day-to-day execution.
Conclusion: The finance-led path to net-zero
Net-zero progress comes from execution discipline, not ambition. The organizations making headway are the ones where net-zero shows up in budgets, board packets, management dashboards, and disclosure reports - not just in sustainability commitments. Finance is the operating system for net-zero because it determines what gets funded, tracked, adjusted, and reported. That is the finance-led path to net-zero.
FAQs
How do I choose a net-zero baseline year?
Choose a year that reflects your organization’s normal emissions profile. Skip years shaped by unusual events, such as major acquisitions, divestitures, or disruptions like the COVID-19 pandemic.
Your baseline year should reflect a stable period of operations and give you a solid starting point for tracking future cuts across Scope 1, 2, and 3 emissions.
What should go into a climate scenario analysis?
A climate scenario analysis should test your strategy against at least two future paths: an orderly transition in the 1.5°C to 2°C range and a high-warming scenario of 3°C+. It should also account for disorderly transitions, especially those triggered by delayed policy action.
The point is simple: move climate risk out of the abstract and into business terms. That means translating physical and transition risks into financial effects on revenue, operating costs, asset values, and capital needs.
Be explicit about the variables shaping each scenario. These often include:
Carbon prices
Energy mix
Policy timing
Local climate risks
Just as important, document your assumptions and limitations clearly. If a scenario depends on a certain policy rollout, fuel mix, or regional hazard pattern, say so plainly. That makes the analysis easier to interpret - and far more useful when leaders have to make calls under uncertainty.
How much should we rely on carbon offsets?
Use carbon offsets with restraint. If you're working toward net-zero, don't lean on carbon credits to hit near-term targets. Science-based guidance does not count those credits as part of near-term emissions cuts.
For long-term residual emissions, neutralize only with permanent carbon dioxide removals (CDR), not avoidance offsets. In plain terms, cut your own emissions first. Then use credits as supplemental climate finance - not as a substitute for direct reductions.
Related Blog Posts
Latest Articles
©2026
Narrative Change and Power Building: The Missing Half of Advocacy
Narrative change is the process of disrupting dominant narratives that normalize inequity and advancing new narratives from historically marginalized communities.
Funding Resilience Without Federal Grants
BRIC is unreliable and FEMA is shrinking. Here's how cities fund climate resilience with dedicated revenue, blended finance, and a coordinating authority.
The ESG Blind Spot: How AI Is Finding Risks in Companies Nobody Else Is Watching
Norway's sovereign wealth fund uses AI to screen 7,200 portfolio companies for forced labor and corruption within 24 hours. The real story is the emerging-market coverage gap that traditional ESG data vendors miss — and what it means for any company with a global supply chain.
FAQ
What does it really mean to “redefine profit”?
What makes Council Fire different?
Who does Council Fire work with?
What does working with Council Fire actually look like?
How does Council Fire help organizations turn big goals into action?
How does Council Fire define and measure success?
How does technology fit into Council Fire’s work?