
Aug 4, 2026
Cost-Benefit Analysis for Net Zero Projects
Sustainability Strategy
In This Article
Net zero projects must show aligned costs, returns, risks, and emissions in one board-ready decision view.
Cost-Benefit Analysis for Net Zero Projects
If a net zero project cannot show cost, return, risk, and emissions in one decision view, I would not take it to a board for approval.
I see the article’s main point this way: a net zero cost-benefit analysis works when I keep the model simple, use one baseline, and test each option on the same rules. The decision should come down to approve, phase, defer, or reject based on NPV, payback, IRR, emissions cuts, and $/tCO2e over a set time period.
Here’s the short version:
I start with a fixed frame, such as 2026 USD, kWh, MMBtu, and tCO2e
I define one clear decision and one fixed project boundary
I build a business-as-usual baseline from at least 12 months of bills and fuel data
I compare no-action, phased rollout, and other tech paths on the same cash-flow basis
I include all material cash flows: CAPEX, OPEX, replacements, residual value, and decommissioning
I lead with NPV, then use IRR and payback as support
I run downside, base, and upside cases to see when the project stops working
I rank options by both financial return and cost per tCO2e abated
I end with a one-line board ask plus clear approval conditions
A few numbers in the article show why this matters. One retrofit example uses $1.8 million in upfront cost, $140,000 in yearly utility savings, $25,000 in added maintenance, a $300,000 battery replacement in year 12, and $90,000 in residual value at year 15. That is exactly why I would not rely on simple payback alone.
Quick comparison
Path | Upfront cost | Savings path | Emissions path | Main issue |
|---|---|---|---|---|
No-action | Low | Low or negative | Flat or up | More rule and cost exposure |
Phased rollout | Medium | Builds over time | Falls over time | Slower returns |
Other tech options | High | Higher later | Faster cuts | More upfront spending |
In short, I would treat net zero CBA as a decision tool, not a reporting exercise. The article shows how to turn climate plans into a board-ready case with plain assumptions, matched cash flows, and a clear go/no-go call.
Set Scope, Boundary, and the Baseline Case
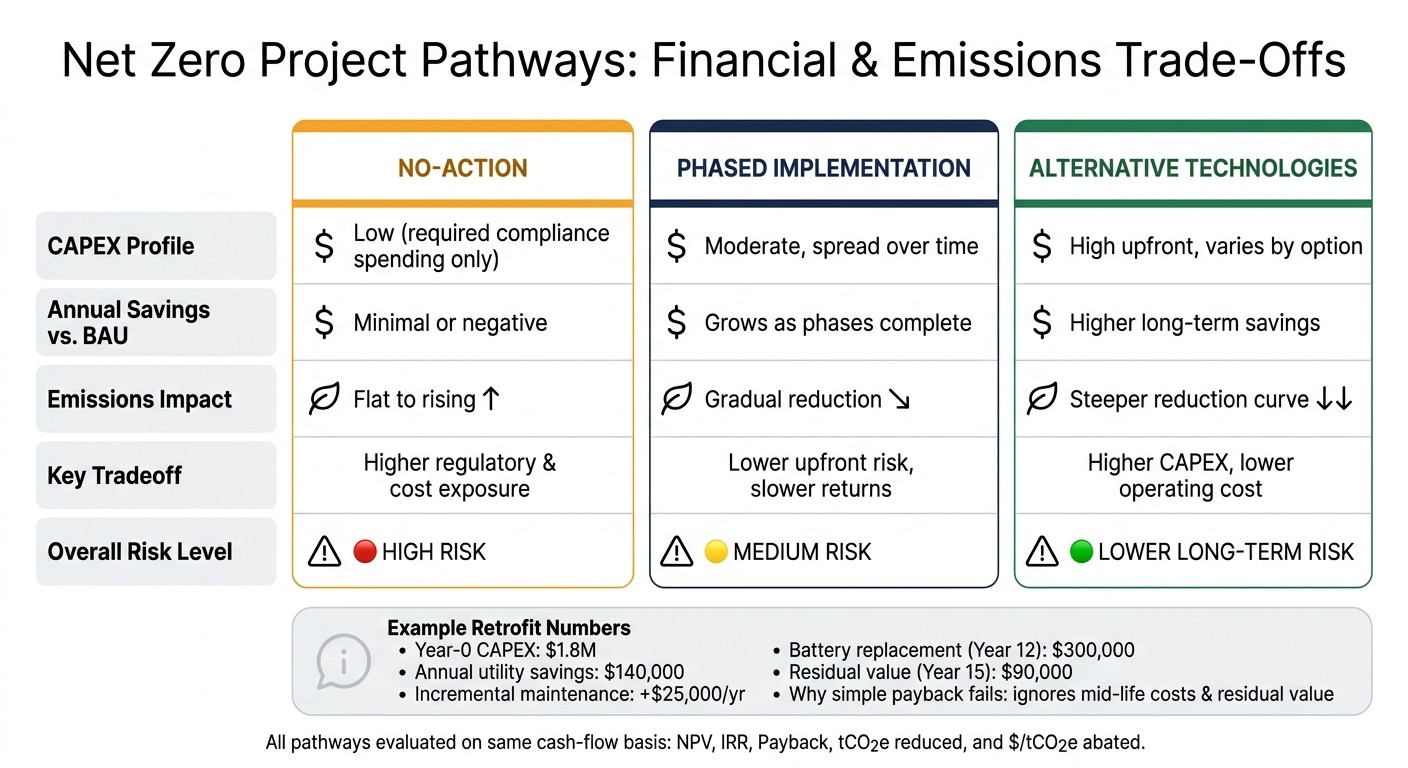
Net Zero Project Pathways: Financial & Emissions Comparison
The outputs from the prior section only mean something once the scope and baseline are locked in. If the boundary shifts from one option to the next, the comparison falls apart. Costs, emissions, and timing all need to sit on the same footing.
Define the Project Boundary and Net Zero Objective
Start by naming exactly what sits inside the analysis: legal entities, facilities, assets, geography, and the time period under review. In most cases, the horizon runs 10 to 15 years for building systems, 5 to 10 years for fleet assets, and 20 to 30 years for major infrastructure. That period should line up with the net zero target year, such as 2030, 2040, or 2050.[8][10]
For the main case, begin with Scope 1 and Scope 2. Then layer in material and controllable Scope 3 categories, such as purchased goods, transport, or use of sold products. When Scope 3 is included, note the uncertainty bands clearly so readers can see where the estimates are firmer and where they are less certain.[7][10]
The boundary should match the decision in front of you. A full net zero plan usually needs a broad boundary. An interim target or portfolio screen may need a tighter one. Once that line is drawn, keep it fixed.
After that, build the business-as-usual, or BAU, case. Every option will be judged against it.
Build a Business-as-Usual Baseline
The BAU baseline should show expected costs and emissions without the project moving ahead. This is the reference case for NPV, payback, and emissions comparisons across every pathway.[11][5][13]
Begin with actual utility bills and fuel logs for at least 12 months. Use EPA eGRID subregional factors for electricity and EPA or IPCC factors for fossil fuels. From there, project BAU using expected load growth, asset replacement cycles, utility price escalation, and known compliance costs.[3][11]
A good model is not just about math. It also needs to be repeatable. That is why every assumption should go into an assumptions register, so another analyst can rebuild the work and land in the same place.
Compare No-Action, Phased, and Alternative Pathways
Once the baseline is set, define the options against it. In most cases, three pathways cover the field: no-action, phased implementation, and alternative technologies. Treat them as competing routes to meet the same decision need, all tested on the same financial and carbon basis. Do not treat them as separate project stories.
Keep the baseline and the analysis period constant across options. That way, the comparison stays clean. After the baseline is fixed, compare only the pathways that solve the same problem.[1][2][4][6][12]
Pathway | CAPEX Profile | Annual Savings vs. BAU | Emissions Impact | Key Tradeoff |
|---|---|---|---|---|
No-Action | Low (required compliance spending) | Minimal or negative | Flat to rising | Higher spend and regulatory risk |
Phased Implementation | Moderate, spread over time | Grows as phases complete | Gradual reduction | Lower upfront risk, slower returns |
Alternative Technologies | High upfront, varies by option | Higher long-term savings | Steeper reduction curve | Higher CAPEX, lower operating cost |
This side-by-side view keeps the analysis honest. A phased plan may ease upfront pressure but delay returns. A no-action path may look cheaper at first glance, yet carry rising spend and regulatory exposure. Alternative technologies often demand more capital early, but they can shift the operating cost curve in a very different way.
Monetize Costs and Benefits With Consistent Assumptions
Once the baseline and pathway choices are locked, the next step is simple in theory and messy in practice: put every option into the same cash-flow structure. If one pathway includes a full set of costs and another leaves out replacements, residual value, or compliance exposure, the comparison falls apart. NPV and abatement cost only mean anything when the inputs are lined up the same way.
Map Every Cost and Benefit Category
Every material cash flow should have its own line in the model. On the cost side, that means upfront CAPEX for equipment, installation, commissioning, permitting, and engineering fees. It also means incremental OPEX, added maintenance, and any mid-life refurbishment or battery replacement.
On the benefit side, include annual energy savings, avoided compliance costs, maintenance reductions, avoided replacement purchases, residual value, and avoided carbon costs when those costs are real.
A building electrification retrofit makes the point clearly. One project might have $1.8 million in year-zero CAPEX, produce $140,000 in annual utility savings, add $25,000 in incremental maintenance, need a $300,000 battery replacement in year 12, and still hold $90,000 in residual value at year 15.[15][16]
Avoided carbon costs belong in the model only when the company is exposed through a carbon price, a compliance rule, or a contract. Keep that line separate from utility savings. That way, decision-makers can see what is doing the financial heavy lifting instead of lumping everything together.
Some gains matter but are tough to price with confidence. Resilience, brand, retention, and trust fall into that bucket for many teams. Unless there is a sound valuation method and a clear data source, keep those items out of the base case and show them on the side as strategic factors.
Apply Discount Rates and Time Horizon Correctly
This is where a lot of models quietly go off the rails. Use a nominal discount rate with nominal cash flows, and a real discount rate with real cash flows. Mix the two, and the NPV gets distorted.
In U.S. corporate analysis, the discount rate usually comes from the organization's weighted average cost of capital or an approved hurdle rate. For long-lived assets, that choice matters a lot. A small change in the rate can swing the result, which is why boards often test several rates in sensitivity cases.
The time horizon should match the asset's useful life and the actual choice on the table. For building systems and similar assets, a 10-, 15-, or 20-year view often fits better than a short payback lens. If the model stops well before the asset wears out, it will undercount the benefit stream in a predictable way.
Calculate NPV, IRR, Payback, and Residual Value
NPV should lead the analysis. If NPV is positive, the project adds financial value after the cost of capital is taken into account. IRR can still help as a second check, but it has a known weakness: it can mislead when cash flows flip sign more than once. That happens often in net zero projects, especially when mid-life replacements show up. Intel, for example, used NPV as its main metric for retrofit projects and treated IRR and payback as supporting views rather than decision rules.[17]
Payback is easy to explain, which is why it shows up in almost every board deck. The problem is that simple payback ignores everything after the investment is recovered. Discounted payback is better, but it still chops off value that appears later. Both are useful for communication. Neither should replace NPV.
Residual value also needs to be in the model whenever equipment still has useful life at the end of the study period. The same goes for decommissioning costs when they are material. Minnesota's solar decommissioning working group estimated net end-of-life costs of $21,700 to $56,300 per megawatt after salvage.[14] Leave out a cost of that size, and project rankings can shift more than most teams expect.
At a minimum, the model should document:
Asset life
Degradation rates
Replacement intervals
Salvage value
Inflation treatment
Tax treatment
Pre-tax vs. after-tax basis
Once the cash flows are standardized, you can test the case under downside, base, and upside assumptions without wondering whether the math changed because the structure did.
Test the Business Case With Scenarios and Abatement Economics
With the baseline locked in, the next step is to see whether the business case still stands when market and policy conditions shift.
Run Downside, Base Case, and Upside Scenarios
Once the cash-flow model is standardized, test it against changing assumptions. Every net zero CBA should cover at least three scenarios.
The base case reflects the most likely outlook. The downside case pressure-tests weak conditions, such as lower energy prices that cut savings, higher capital costs, and early expiration of incentives like the Investment Tax Credit or Production Tax Credit. The upside case reflects more favorable conditions, including higher fossil fuel prices, tighter carbon rules, and faster grid decarbonization.
For each scenario, set energy prices, carbon prices, incentives, adoption timing, and emissions factors using credible sources such as the U.S. Energy Information Administration. Then run the full model and track how NPV, IRR, payback, and annual emissions reductions change. Pinpoint the break point where NPV turns negative or payback moves past the organization’s limit. A tornado diagram can then rank the main drivers of NPV, making it plain which variables deserve the most board attention.[20][21]
After that stress test, compare the options by emissions efficiency.
Measure Cost per tCO2e Abated
Financial metrics alone won’t rank abatement options. Cost per tCO2e abated puts each option on the same climate basis, no matter the project type, size, or lifespan. Calculate it as incremental net cost divided by total tCO2e reduced.[18][19]
Negative-cost measures save money. Positive-cost measures don’t. Energy efficiency upgrades and process optimization often land in the negative-cost group, so they should go first in any net zero roadmap.[9][19] Higher-cost measures should stay in the plan only when they meet compliance or strategy needs, and that logic should be stated plainly.
Use the same assumptions across all options so the ranking holds up.
Compare Options Across Scenarios
One table should bring the economics, emissions, and abatement cost into a single view. Show the same options across downside, base, and upside cases so it’s easy to see which rankings stay steady and which ones flip when assumptions change.
Option | CAPEX (USD) | Annual Savings (USD) | Base NPV (USD) | Downside NPV (USD) | Upside NPV (USD) | tCO2e Reduced | $/tCO2e |
|---|---|---|---|---|---|---|---|
Option 1 | - | - | - | - | - | - | - |
Option 2 | - | - | - | - | - | - | - |
Option 3 | - | - | - | - | - | - | - |
Negative-cost measures should move first. Higher-cost measures belong only when they support compliance or a clear strategy case. This side-by-side view shows which options stay strong under pressure and which ones depend on favorable assumptions.
These outputs are the core inputs for the board recommendation.
Frame the Recommendation for Board Approval
Use the scenario table to turn the analysis into a board decision. Once scenario testing is done, the job is simple: turn the numbers into a choice the board can approve.
Present the Recommendation and the Conditions Behind It
Start the memo with one direct sentence. Put the option, capital required, NPV, emissions reduction, and timeline in a single line: Approve Option B, a phased efficiency-plus-electrification pathway requiring $12.4 million upfront, generating a positive NPV of $3.1 million, reducing emissions by 48% by 2030, and reaching full implementation by Q4 2028.
Then show the three to five assumptions driving that result. Keep them the same as the assumptions, options, and rankings already used in the scenario comparison table. That usually means energy prices, discount rate, incentive availability, project life, and technology performance.
Next, spell out what would change the call. Don’t leave directors guessing. Use plain approval conditions, such as: Approve only if total installed cost stays below $10.5 million and rebate eligibility is confirmed by September 30; otherwise defer Phase 2. That gives the board a path for contingent approval instead of handing over a blank check.
If the project only makes sense when power prices jump or incentives stay in place, say that plainly. No hedging, no soft language.
Separate Economics from Risk, Compliance, and Strategy
Not all value shows up in NPV. A two-column structure makes that easier to see by separating financial return from the rest of the case.
Value Category | What to Show |
|---|---|
Financial return | NPV, IRR, payback period, annual cash flow impact, cost per tCO2e abated |
Risk reduction | Avoided carbon fee exposure, energy price volatility hedge, reduced stranded asset risk |
Regulatory readiness | TCFD/IFRS S2 alignment, SEC disclosure preparedness, procurement eligibility |
Strategic value | Access to green financing, customer and talent expectations, long-term operating flexibility |
A project with a modest payback and strong emissions impact may still belong in the plan. Why? Because it can avoid higher retrofit costs later, cut transition risk, or open the door to future projects. When that’s the case, say it directly:
This project is not justified by near-term payback alone, but by its role in reducing long-term regulatory exposure and enabling Phase 2 electrification.
That framing keeps the recommendation clear, defensible, and easy to approve.
Conclusion: The Minimum Elements of a Net Zero CBA
A board-ready net zero CBA states the decision, assumptions, economics, risks, and approval conditions in one page.
FAQs
How do I set the right project boundary?
Align the project boundary with your goals and day-to-day scope. Start by deciding whether the analysis looks at one initiative or several efforts across departments or sites.
Bring in every entity, physical location, and material value chain node that matters. Define Scope 1, Scope 2, and Scope 3 emissions in plain terms, use the same time horizon across the analysis, and involve stakeholders early to test assumptions and surface organizational concerns before they turn into bigger issues.
What should I include in the BAU baseline?
Include a greenhouse gas inventory that covers Scope 1, Scope 2, and material Scope 3 emissions, aligned with the GHG Protocol Corporate Standard. Pick a representative base year that reflects normal operations, and steer clear of odd periods like major acquisitions or pandemic disruptions.
Also bring in 3–5 years of operational and risk data - things like energy use, waste, and climate-related financial impacts. That gives you the business-as-usual scenario, which serves as the baseline for comparing net zero project outcomes.
When should Scope 3 be included?
Include Scope 3 when it covers material categories for your business. Under SBTi rules, if Scope 3 accounts for 40% or more of total emissions, you must set a formal Scope 3 target.
This matters because Scope 3 is often 5 to 20 times larger than operational emissions. In plain terms, leaving it out can give you an incomplete picture of your path to net zero.
Start by screening all 15 GHG Protocol categories. Then make sure your target covers at least 67% of total Scope 3 emissions.
Related Blog Posts
Latest Articles
©2025

Narrative Change and Power Building: The Missing Half of Advocacy
Narrative change is the process of disrupting dominant narratives that normalize inequity and advancing new narratives from historically marginalized communities.

Funding Resilience Without Federal Grants
BRIC is unreliable and FEMA is shrinking. Here's how cities fund climate resilience with dedicated revenue, blended finance, and a coordinating authority.

The ESG Blind Spot: How AI Is Finding Risks in Companies Nobody Else Is Watching
Norway's sovereign wealth fund uses AI to screen 7,200 portfolio companies for forced labor and corruption within 24 hours. The real story is the emerging-market coverage gap that traditional ESG data vendors miss — and what it means for any company with a global supply chain.
Narrative Change and Power Building: The Missing Half of Advocacy
Narrative change is the process of disrupting dominant narratives that normalize inequity and advancing new narratives from historically marginalized communities.
Funding Resilience Without Federal Grants
BRIC is unreliable and FEMA is shrinking. Here's how cities fund climate resilience with dedicated revenue, blended finance, and a coordinating authority.
The ESG Blind Spot: How AI Is Finding Risks in Companies Nobody Else Is Watching
Norway's sovereign wealth fund uses AI to screen 7,200 portfolio companies for forced labor and corruption within 24 hours. The real story is the emerging-market coverage gap that traditional ESG data vendors miss — and what it means for any company with a global supply chain.
FAQ
01
What does it really mean to “redefine profit”?
02
What makes Council Fire different?
03
Who does Council Fire work with?
04
What does working with Council Fire actually look like?
05
How does Council Fire help organizations turn big goals into action?
06
How does Council Fire define and measure success?
Aug 4, 2026
Cost-Benefit Analysis for Net Zero Projects
Sustainability Strategy
In This Article
Net zero projects must show aligned costs, returns, risks, and emissions in one board-ready decision view.
Cost-Benefit Analysis for Net Zero Projects
If a net zero project cannot show cost, return, risk, and emissions in one decision view, I would not take it to a board for approval.
I see the article’s main point this way: a net zero cost-benefit analysis works when I keep the model simple, use one baseline, and test each option on the same rules. The decision should come down to approve, phase, defer, or reject based on NPV, payback, IRR, emissions cuts, and $/tCO2e over a set time period.
Here’s the short version:
I start with a fixed frame, such as 2026 USD, kWh, MMBtu, and tCO2e
I define one clear decision and one fixed project boundary
I build a business-as-usual baseline from at least 12 months of bills and fuel data
I compare no-action, phased rollout, and other tech paths on the same cash-flow basis
I include all material cash flows: CAPEX, OPEX, replacements, residual value, and decommissioning
I lead with NPV, then use IRR and payback as support
I run downside, base, and upside cases to see when the project stops working
I rank options by both financial return and cost per tCO2e abated
I end with a one-line board ask plus clear approval conditions
A few numbers in the article show why this matters. One retrofit example uses $1.8 million in upfront cost, $140,000 in yearly utility savings, $25,000 in added maintenance, a $300,000 battery replacement in year 12, and $90,000 in residual value at year 15. That is exactly why I would not rely on simple payback alone.
Quick comparison
Path | Upfront cost | Savings path | Emissions path | Main issue |
|---|---|---|---|---|
No-action | Low | Low or negative | Flat or up | More rule and cost exposure |
Phased rollout | Medium | Builds over time | Falls over time | Slower returns |
Other tech options | High | Higher later | Faster cuts | More upfront spending |
In short, I would treat net zero CBA as a decision tool, not a reporting exercise. The article shows how to turn climate plans into a board-ready case with plain assumptions, matched cash flows, and a clear go/no-go call.
Set Scope, Boundary, and the Baseline Case
Net Zero Project Pathways: Financial & Emissions Comparison
The outputs from the prior section only mean something once the scope and baseline are locked in. If the boundary shifts from one option to the next, the comparison falls apart. Costs, emissions, and timing all need to sit on the same footing.
Define the Project Boundary and Net Zero Objective
Start by naming exactly what sits inside the analysis: legal entities, facilities, assets, geography, and the time period under review. In most cases, the horizon runs 10 to 15 years for building systems, 5 to 10 years for fleet assets, and 20 to 30 years for major infrastructure. That period should line up with the net zero target year, such as 2030, 2040, or 2050.[8][10]
For the main case, begin with Scope 1 and Scope 2. Then layer in material and controllable Scope 3 categories, such as purchased goods, transport, or use of sold products. When Scope 3 is included, note the uncertainty bands clearly so readers can see where the estimates are firmer and where they are less certain.[7][10]
The boundary should match the decision in front of you. A full net zero plan usually needs a broad boundary. An interim target or portfolio screen may need a tighter one. Once that line is drawn, keep it fixed.
After that, build the business-as-usual, or BAU, case. Every option will be judged against it.
Build a Business-as-Usual Baseline
The BAU baseline should show expected costs and emissions without the project moving ahead. This is the reference case for NPV, payback, and emissions comparisons across every pathway.[11][5][13]
Begin with actual utility bills and fuel logs for at least 12 months. Use EPA eGRID subregional factors for electricity and EPA or IPCC factors for fossil fuels. From there, project BAU using expected load growth, asset replacement cycles, utility price escalation, and known compliance costs.[3][11]
A good model is not just about math. It also needs to be repeatable. That is why every assumption should go into an assumptions register, so another analyst can rebuild the work and land in the same place.
Compare No-Action, Phased, and Alternative Pathways
Once the baseline is set, define the options against it. In most cases, three pathways cover the field: no-action, phased implementation, and alternative technologies. Treat them as competing routes to meet the same decision need, all tested on the same financial and carbon basis. Do not treat them as separate project stories.
Keep the baseline and the analysis period constant across options. That way, the comparison stays clean. After the baseline is fixed, compare only the pathways that solve the same problem.[1][2][4][6][12]
Pathway | CAPEX Profile | Annual Savings vs. BAU | Emissions Impact | Key Tradeoff |
|---|---|---|---|---|
No-Action | Low (required compliance spending) | Minimal or negative | Flat to rising | Higher spend and regulatory risk |
Phased Implementation | Moderate, spread over time | Grows as phases complete | Gradual reduction | Lower upfront risk, slower returns |
Alternative Technologies | High upfront, varies by option | Higher long-term savings | Steeper reduction curve | Higher CAPEX, lower operating cost |
This side-by-side view keeps the analysis honest. A phased plan may ease upfront pressure but delay returns. A no-action path may look cheaper at first glance, yet carry rising spend and regulatory exposure. Alternative technologies often demand more capital early, but they can shift the operating cost curve in a very different way.
Monetize Costs and Benefits With Consistent Assumptions
Once the baseline and pathway choices are locked, the next step is simple in theory and messy in practice: put every option into the same cash-flow structure. If one pathway includes a full set of costs and another leaves out replacements, residual value, or compliance exposure, the comparison falls apart. NPV and abatement cost only mean anything when the inputs are lined up the same way.
Map Every Cost and Benefit Category
Every material cash flow should have its own line in the model. On the cost side, that means upfront CAPEX for equipment, installation, commissioning, permitting, and engineering fees. It also means incremental OPEX, added maintenance, and any mid-life refurbishment or battery replacement.
On the benefit side, include annual energy savings, avoided compliance costs, maintenance reductions, avoided replacement purchases, residual value, and avoided carbon costs when those costs are real.
A building electrification retrofit makes the point clearly. One project might have $1.8 million in year-zero CAPEX, produce $140,000 in annual utility savings, add $25,000 in incremental maintenance, need a $300,000 battery replacement in year 12, and still hold $90,000 in residual value at year 15.[15][16]
Avoided carbon costs belong in the model only when the company is exposed through a carbon price, a compliance rule, or a contract. Keep that line separate from utility savings. That way, decision-makers can see what is doing the financial heavy lifting instead of lumping everything together.
Some gains matter but are tough to price with confidence. Resilience, brand, retention, and trust fall into that bucket for many teams. Unless there is a sound valuation method and a clear data source, keep those items out of the base case and show them on the side as strategic factors.
Apply Discount Rates and Time Horizon Correctly
This is where a lot of models quietly go off the rails. Use a nominal discount rate with nominal cash flows, and a real discount rate with real cash flows. Mix the two, and the NPV gets distorted.
In U.S. corporate analysis, the discount rate usually comes from the organization's weighted average cost of capital or an approved hurdle rate. For long-lived assets, that choice matters a lot. A small change in the rate can swing the result, which is why boards often test several rates in sensitivity cases.
The time horizon should match the asset's useful life and the actual choice on the table. For building systems and similar assets, a 10-, 15-, or 20-year view often fits better than a short payback lens. If the model stops well before the asset wears out, it will undercount the benefit stream in a predictable way.
Calculate NPV, IRR, Payback, and Residual Value
NPV should lead the analysis. If NPV is positive, the project adds financial value after the cost of capital is taken into account. IRR can still help as a second check, but it has a known weakness: it can mislead when cash flows flip sign more than once. That happens often in net zero projects, especially when mid-life replacements show up. Intel, for example, used NPV as its main metric for retrofit projects and treated IRR and payback as supporting views rather than decision rules.[17]
Payback is easy to explain, which is why it shows up in almost every board deck. The problem is that simple payback ignores everything after the investment is recovered. Discounted payback is better, but it still chops off value that appears later. Both are useful for communication. Neither should replace NPV.
Residual value also needs to be in the model whenever equipment still has useful life at the end of the study period. The same goes for decommissioning costs when they are material. Minnesota's solar decommissioning working group estimated net end-of-life costs of $21,700 to $56,300 per megawatt after salvage.[14] Leave out a cost of that size, and project rankings can shift more than most teams expect.
At a minimum, the model should document:
Asset life
Degradation rates
Replacement intervals
Salvage value
Inflation treatment
Tax treatment
Pre-tax vs. after-tax basis
Once the cash flows are standardized, you can test the case under downside, base, and upside assumptions without wondering whether the math changed because the structure did.
Test the Business Case With Scenarios and Abatement Economics
With the baseline locked in, the next step is to see whether the business case still stands when market and policy conditions shift.
Run Downside, Base Case, and Upside Scenarios
Once the cash-flow model is standardized, test it against changing assumptions. Every net zero CBA should cover at least three scenarios.
The base case reflects the most likely outlook. The downside case pressure-tests weak conditions, such as lower energy prices that cut savings, higher capital costs, and early expiration of incentives like the Investment Tax Credit or Production Tax Credit. The upside case reflects more favorable conditions, including higher fossil fuel prices, tighter carbon rules, and faster grid decarbonization.
For each scenario, set energy prices, carbon prices, incentives, adoption timing, and emissions factors using credible sources such as the U.S. Energy Information Administration. Then run the full model and track how NPV, IRR, payback, and annual emissions reductions change. Pinpoint the break point where NPV turns negative or payback moves past the organization’s limit. A tornado diagram can then rank the main drivers of NPV, making it plain which variables deserve the most board attention.[20][21]
After that stress test, compare the options by emissions efficiency.
Measure Cost per tCO2e Abated
Financial metrics alone won’t rank abatement options. Cost per tCO2e abated puts each option on the same climate basis, no matter the project type, size, or lifespan. Calculate it as incremental net cost divided by total tCO2e reduced.[18][19]
Negative-cost measures save money. Positive-cost measures don’t. Energy efficiency upgrades and process optimization often land in the negative-cost group, so they should go first in any net zero roadmap.[9][19] Higher-cost measures should stay in the plan only when they meet compliance or strategy needs, and that logic should be stated plainly.
Use the same assumptions across all options so the ranking holds up.
Compare Options Across Scenarios
One table should bring the economics, emissions, and abatement cost into a single view. Show the same options across downside, base, and upside cases so it’s easy to see which rankings stay steady and which ones flip when assumptions change.
Option | CAPEX (USD) | Annual Savings (USD) | Base NPV (USD) | Downside NPV (USD) | Upside NPV (USD) | tCO2e Reduced | $/tCO2e |
|---|---|---|---|---|---|---|---|
Option 1 | - | - | - | - | - | - | - |
Option 2 | - | - | - | - | - | - | - |
Option 3 | - | - | - | - | - | - | - |
Negative-cost measures should move first. Higher-cost measures belong only when they support compliance or a clear strategy case. This side-by-side view shows which options stay strong under pressure and which ones depend on favorable assumptions.
These outputs are the core inputs for the board recommendation.
Frame the Recommendation for Board Approval
Use the scenario table to turn the analysis into a board decision. Once scenario testing is done, the job is simple: turn the numbers into a choice the board can approve.
Present the Recommendation and the Conditions Behind It
Start the memo with one direct sentence. Put the option, capital required, NPV, emissions reduction, and timeline in a single line: Approve Option B, a phased efficiency-plus-electrification pathway requiring $12.4 million upfront, generating a positive NPV of $3.1 million, reducing emissions by 48% by 2030, and reaching full implementation by Q4 2028.
Then show the three to five assumptions driving that result. Keep them the same as the assumptions, options, and rankings already used in the scenario comparison table. That usually means energy prices, discount rate, incentive availability, project life, and technology performance.
Next, spell out what would change the call. Don’t leave directors guessing. Use plain approval conditions, such as: Approve only if total installed cost stays below $10.5 million and rebate eligibility is confirmed by September 30; otherwise defer Phase 2. That gives the board a path for contingent approval instead of handing over a blank check.
If the project only makes sense when power prices jump or incentives stay in place, say that plainly. No hedging, no soft language.
Separate Economics from Risk, Compliance, and Strategy
Not all value shows up in NPV. A two-column structure makes that easier to see by separating financial return from the rest of the case.
Value Category | What to Show |
|---|---|
Financial return | NPV, IRR, payback period, annual cash flow impact, cost per tCO2e abated |
Risk reduction | Avoided carbon fee exposure, energy price volatility hedge, reduced stranded asset risk |
Regulatory readiness | TCFD/IFRS S2 alignment, SEC disclosure preparedness, procurement eligibility |
Strategic value | Access to green financing, customer and talent expectations, long-term operating flexibility |
A project with a modest payback and strong emissions impact may still belong in the plan. Why? Because it can avoid higher retrofit costs later, cut transition risk, or open the door to future projects. When that’s the case, say it directly:
This project is not justified by near-term payback alone, but by its role in reducing long-term regulatory exposure and enabling Phase 2 electrification.
That framing keeps the recommendation clear, defensible, and easy to approve.
Conclusion: The Minimum Elements of a Net Zero CBA
A board-ready net zero CBA states the decision, assumptions, economics, risks, and approval conditions in one page.
FAQs
How do I set the right project boundary?
Align the project boundary with your goals and day-to-day scope. Start by deciding whether the analysis looks at one initiative or several efforts across departments or sites.
Bring in every entity, physical location, and material value chain node that matters. Define Scope 1, Scope 2, and Scope 3 emissions in plain terms, use the same time horizon across the analysis, and involve stakeholders early to test assumptions and surface organizational concerns before they turn into bigger issues.
What should I include in the BAU baseline?
Include a greenhouse gas inventory that covers Scope 1, Scope 2, and material Scope 3 emissions, aligned with the GHG Protocol Corporate Standard. Pick a representative base year that reflects normal operations, and steer clear of odd periods like major acquisitions or pandemic disruptions.
Also bring in 3–5 years of operational and risk data - things like energy use, waste, and climate-related financial impacts. That gives you the business-as-usual scenario, which serves as the baseline for comparing net zero project outcomes.
When should Scope 3 be included?
Include Scope 3 when it covers material categories for your business. Under SBTi rules, if Scope 3 accounts for 40% or more of total emissions, you must set a formal Scope 3 target.
This matters because Scope 3 is often 5 to 20 times larger than operational emissions. In plain terms, leaving it out can give you an incomplete picture of your path to net zero.
Start by screening all 15 GHG Protocol categories. Then make sure your target covers at least 67% of total Scope 3 emissions.
Related Blog Posts
Latest Articles
©2025
Narrative Change and Power Building: The Missing Half of Advocacy
Narrative change is the process of disrupting dominant narratives that normalize inequity and advancing new narratives from historically marginalized communities.
Funding Resilience Without Federal Grants
BRIC is unreliable and FEMA is shrinking. Here's how cities fund climate resilience with dedicated revenue, blended finance, and a coordinating authority.
The ESG Blind Spot: How AI Is Finding Risks in Companies Nobody Else Is Watching
Norway's sovereign wealth fund uses AI to screen 7,200 portfolio companies for forced labor and corruption within 24 hours. The real story is the emerging-market coverage gap that traditional ESG data vendors miss — and what it means for any company with a global supply chain.
FAQ
01
What does it really mean to “redefine profit”?
02
What makes Council Fire different?
03
Who does Council Fire work with?
04
What does working with Council Fire actually look like?
05
How does Council Fire help organizations turn big goals into action?
06
How does Council Fire define and measure success?
Aug 4, 2026
Cost-Benefit Analysis for Net Zero Projects
Sustainability Strategy
In This Article
Net zero projects must show aligned costs, returns, risks, and emissions in one board-ready decision view.
Cost-Benefit Analysis for Net Zero Projects
If a net zero project cannot show cost, return, risk, and emissions in one decision view, I would not take it to a board for approval.
I see the article’s main point this way: a net zero cost-benefit analysis works when I keep the model simple, use one baseline, and test each option on the same rules. The decision should come down to approve, phase, defer, or reject based on NPV, payback, IRR, emissions cuts, and $/tCO2e over a set time period.
Here’s the short version:
I start with a fixed frame, such as 2026 USD, kWh, MMBtu, and tCO2e
I define one clear decision and one fixed project boundary
I build a business-as-usual baseline from at least 12 months of bills and fuel data
I compare no-action, phased rollout, and other tech paths on the same cash-flow basis
I include all material cash flows: CAPEX, OPEX, replacements, residual value, and decommissioning
I lead with NPV, then use IRR and payback as support
I run downside, base, and upside cases to see when the project stops working
I rank options by both financial return and cost per tCO2e abated
I end with a one-line board ask plus clear approval conditions
A few numbers in the article show why this matters. One retrofit example uses $1.8 million in upfront cost, $140,000 in yearly utility savings, $25,000 in added maintenance, a $300,000 battery replacement in year 12, and $90,000 in residual value at year 15. That is exactly why I would not rely on simple payback alone.
Quick comparison
Path | Upfront cost | Savings path | Emissions path | Main issue |
|---|---|---|---|---|
No-action | Low | Low or negative | Flat or up | More rule and cost exposure |
Phased rollout | Medium | Builds over time | Falls over time | Slower returns |
Other tech options | High | Higher later | Faster cuts | More upfront spending |
In short, I would treat net zero CBA as a decision tool, not a reporting exercise. The article shows how to turn climate plans into a board-ready case with plain assumptions, matched cash flows, and a clear go/no-go call.
Set Scope, Boundary, and the Baseline Case
Net Zero Project Pathways: Financial & Emissions Comparison
The outputs from the prior section only mean something once the scope and baseline are locked in. If the boundary shifts from one option to the next, the comparison falls apart. Costs, emissions, and timing all need to sit on the same footing.
Define the Project Boundary and Net Zero Objective
Start by naming exactly what sits inside the analysis: legal entities, facilities, assets, geography, and the time period under review. In most cases, the horizon runs 10 to 15 years for building systems, 5 to 10 years for fleet assets, and 20 to 30 years for major infrastructure. That period should line up with the net zero target year, such as 2030, 2040, or 2050.[8][10]
For the main case, begin with Scope 1 and Scope 2. Then layer in material and controllable Scope 3 categories, such as purchased goods, transport, or use of sold products. When Scope 3 is included, note the uncertainty bands clearly so readers can see where the estimates are firmer and where they are less certain.[7][10]
The boundary should match the decision in front of you. A full net zero plan usually needs a broad boundary. An interim target or portfolio screen may need a tighter one. Once that line is drawn, keep it fixed.
After that, build the business-as-usual, or BAU, case. Every option will be judged against it.
Build a Business-as-Usual Baseline
The BAU baseline should show expected costs and emissions without the project moving ahead. This is the reference case for NPV, payback, and emissions comparisons across every pathway.[11][5][13]
Begin with actual utility bills and fuel logs for at least 12 months. Use EPA eGRID subregional factors for electricity and EPA or IPCC factors for fossil fuels. From there, project BAU using expected load growth, asset replacement cycles, utility price escalation, and known compliance costs.[3][11]
A good model is not just about math. It also needs to be repeatable. That is why every assumption should go into an assumptions register, so another analyst can rebuild the work and land in the same place.
Compare No-Action, Phased, and Alternative Pathways
Once the baseline is set, define the options against it. In most cases, three pathways cover the field: no-action, phased implementation, and alternative technologies. Treat them as competing routes to meet the same decision need, all tested on the same financial and carbon basis. Do not treat them as separate project stories.
Keep the baseline and the analysis period constant across options. That way, the comparison stays clean. After the baseline is fixed, compare only the pathways that solve the same problem.[1][2][4][6][12]
Pathway | CAPEX Profile | Annual Savings vs. BAU | Emissions Impact | Key Tradeoff |
|---|---|---|---|---|
No-Action | Low (required compliance spending) | Minimal or negative | Flat to rising | Higher spend and regulatory risk |
Phased Implementation | Moderate, spread over time | Grows as phases complete | Gradual reduction | Lower upfront risk, slower returns |
Alternative Technologies | High upfront, varies by option | Higher long-term savings | Steeper reduction curve | Higher CAPEX, lower operating cost |
This side-by-side view keeps the analysis honest. A phased plan may ease upfront pressure but delay returns. A no-action path may look cheaper at first glance, yet carry rising spend and regulatory exposure. Alternative technologies often demand more capital early, but they can shift the operating cost curve in a very different way.
Monetize Costs and Benefits With Consistent Assumptions
Once the baseline and pathway choices are locked, the next step is simple in theory and messy in practice: put every option into the same cash-flow structure. If one pathway includes a full set of costs and another leaves out replacements, residual value, or compliance exposure, the comparison falls apart. NPV and abatement cost only mean anything when the inputs are lined up the same way.
Map Every Cost and Benefit Category
Every material cash flow should have its own line in the model. On the cost side, that means upfront CAPEX for equipment, installation, commissioning, permitting, and engineering fees. It also means incremental OPEX, added maintenance, and any mid-life refurbishment or battery replacement.
On the benefit side, include annual energy savings, avoided compliance costs, maintenance reductions, avoided replacement purchases, residual value, and avoided carbon costs when those costs are real.
A building electrification retrofit makes the point clearly. One project might have $1.8 million in year-zero CAPEX, produce $140,000 in annual utility savings, add $25,000 in incremental maintenance, need a $300,000 battery replacement in year 12, and still hold $90,000 in residual value at year 15.[15][16]
Avoided carbon costs belong in the model only when the company is exposed through a carbon price, a compliance rule, or a contract. Keep that line separate from utility savings. That way, decision-makers can see what is doing the financial heavy lifting instead of lumping everything together.
Some gains matter but are tough to price with confidence. Resilience, brand, retention, and trust fall into that bucket for many teams. Unless there is a sound valuation method and a clear data source, keep those items out of the base case and show them on the side as strategic factors.
Apply Discount Rates and Time Horizon Correctly
This is where a lot of models quietly go off the rails. Use a nominal discount rate with nominal cash flows, and a real discount rate with real cash flows. Mix the two, and the NPV gets distorted.
In U.S. corporate analysis, the discount rate usually comes from the organization's weighted average cost of capital or an approved hurdle rate. For long-lived assets, that choice matters a lot. A small change in the rate can swing the result, which is why boards often test several rates in sensitivity cases.
The time horizon should match the asset's useful life and the actual choice on the table. For building systems and similar assets, a 10-, 15-, or 20-year view often fits better than a short payback lens. If the model stops well before the asset wears out, it will undercount the benefit stream in a predictable way.
Calculate NPV, IRR, Payback, and Residual Value
NPV should lead the analysis. If NPV is positive, the project adds financial value after the cost of capital is taken into account. IRR can still help as a second check, but it has a known weakness: it can mislead when cash flows flip sign more than once. That happens often in net zero projects, especially when mid-life replacements show up. Intel, for example, used NPV as its main metric for retrofit projects and treated IRR and payback as supporting views rather than decision rules.[17]
Payback is easy to explain, which is why it shows up in almost every board deck. The problem is that simple payback ignores everything after the investment is recovered. Discounted payback is better, but it still chops off value that appears later. Both are useful for communication. Neither should replace NPV.
Residual value also needs to be in the model whenever equipment still has useful life at the end of the study period. The same goes for decommissioning costs when they are material. Minnesota's solar decommissioning working group estimated net end-of-life costs of $21,700 to $56,300 per megawatt after salvage.[14] Leave out a cost of that size, and project rankings can shift more than most teams expect.
At a minimum, the model should document:
Asset life
Degradation rates
Replacement intervals
Salvage value
Inflation treatment
Tax treatment
Pre-tax vs. after-tax basis
Once the cash flows are standardized, you can test the case under downside, base, and upside assumptions without wondering whether the math changed because the structure did.
Test the Business Case With Scenarios and Abatement Economics
With the baseline locked in, the next step is to see whether the business case still stands when market and policy conditions shift.
Run Downside, Base Case, and Upside Scenarios
Once the cash-flow model is standardized, test it against changing assumptions. Every net zero CBA should cover at least three scenarios.
The base case reflects the most likely outlook. The downside case pressure-tests weak conditions, such as lower energy prices that cut savings, higher capital costs, and early expiration of incentives like the Investment Tax Credit or Production Tax Credit. The upside case reflects more favorable conditions, including higher fossil fuel prices, tighter carbon rules, and faster grid decarbonization.
For each scenario, set energy prices, carbon prices, incentives, adoption timing, and emissions factors using credible sources such as the U.S. Energy Information Administration. Then run the full model and track how NPV, IRR, payback, and annual emissions reductions change. Pinpoint the break point where NPV turns negative or payback moves past the organization’s limit. A tornado diagram can then rank the main drivers of NPV, making it plain which variables deserve the most board attention.[20][21]
After that stress test, compare the options by emissions efficiency.
Measure Cost per tCO2e Abated
Financial metrics alone won’t rank abatement options. Cost per tCO2e abated puts each option on the same climate basis, no matter the project type, size, or lifespan. Calculate it as incremental net cost divided by total tCO2e reduced.[18][19]
Negative-cost measures save money. Positive-cost measures don’t. Energy efficiency upgrades and process optimization often land in the negative-cost group, so they should go first in any net zero roadmap.[9][19] Higher-cost measures should stay in the plan only when they meet compliance or strategy needs, and that logic should be stated plainly.
Use the same assumptions across all options so the ranking holds up.
Compare Options Across Scenarios
One table should bring the economics, emissions, and abatement cost into a single view. Show the same options across downside, base, and upside cases so it’s easy to see which rankings stay steady and which ones flip when assumptions change.
Option | CAPEX (USD) | Annual Savings (USD) | Base NPV (USD) | Downside NPV (USD) | Upside NPV (USD) | tCO2e Reduced | $/tCO2e |
|---|---|---|---|---|---|---|---|
Option 1 | - | - | - | - | - | - | - |
Option 2 | - | - | - | - | - | - | - |
Option 3 | - | - | - | - | - | - | - |
Negative-cost measures should move first. Higher-cost measures belong only when they support compliance or a clear strategy case. This side-by-side view shows which options stay strong under pressure and which ones depend on favorable assumptions.
These outputs are the core inputs for the board recommendation.
Frame the Recommendation for Board Approval
Use the scenario table to turn the analysis into a board decision. Once scenario testing is done, the job is simple: turn the numbers into a choice the board can approve.
Present the Recommendation and the Conditions Behind It
Start the memo with one direct sentence. Put the option, capital required, NPV, emissions reduction, and timeline in a single line: Approve Option B, a phased efficiency-plus-electrification pathway requiring $12.4 million upfront, generating a positive NPV of $3.1 million, reducing emissions by 48% by 2030, and reaching full implementation by Q4 2028.
Then show the three to five assumptions driving that result. Keep them the same as the assumptions, options, and rankings already used in the scenario comparison table. That usually means energy prices, discount rate, incentive availability, project life, and technology performance.
Next, spell out what would change the call. Don’t leave directors guessing. Use plain approval conditions, such as: Approve only if total installed cost stays below $10.5 million and rebate eligibility is confirmed by September 30; otherwise defer Phase 2. That gives the board a path for contingent approval instead of handing over a blank check.
If the project only makes sense when power prices jump or incentives stay in place, say that plainly. No hedging, no soft language.
Separate Economics from Risk, Compliance, and Strategy
Not all value shows up in NPV. A two-column structure makes that easier to see by separating financial return from the rest of the case.
Value Category | What to Show |
|---|---|
Financial return | NPV, IRR, payback period, annual cash flow impact, cost per tCO2e abated |
Risk reduction | Avoided carbon fee exposure, energy price volatility hedge, reduced stranded asset risk |
Regulatory readiness | TCFD/IFRS S2 alignment, SEC disclosure preparedness, procurement eligibility |
Strategic value | Access to green financing, customer and talent expectations, long-term operating flexibility |
A project with a modest payback and strong emissions impact may still belong in the plan. Why? Because it can avoid higher retrofit costs later, cut transition risk, or open the door to future projects. When that’s the case, say it directly:
This project is not justified by near-term payback alone, but by its role in reducing long-term regulatory exposure and enabling Phase 2 electrification.
That framing keeps the recommendation clear, defensible, and easy to approve.
Conclusion: The Minimum Elements of a Net Zero CBA
A board-ready net zero CBA states the decision, assumptions, economics, risks, and approval conditions in one page.
FAQs
How do I set the right project boundary?
Align the project boundary with your goals and day-to-day scope. Start by deciding whether the analysis looks at one initiative or several efforts across departments or sites.
Bring in every entity, physical location, and material value chain node that matters. Define Scope 1, Scope 2, and Scope 3 emissions in plain terms, use the same time horizon across the analysis, and involve stakeholders early to test assumptions and surface organizational concerns before they turn into bigger issues.
What should I include in the BAU baseline?
Include a greenhouse gas inventory that covers Scope 1, Scope 2, and material Scope 3 emissions, aligned with the GHG Protocol Corporate Standard. Pick a representative base year that reflects normal operations, and steer clear of odd periods like major acquisitions or pandemic disruptions.
Also bring in 3–5 years of operational and risk data - things like energy use, waste, and climate-related financial impacts. That gives you the business-as-usual scenario, which serves as the baseline for comparing net zero project outcomes.
When should Scope 3 be included?
Include Scope 3 when it covers material categories for your business. Under SBTi rules, if Scope 3 accounts for 40% or more of total emissions, you must set a formal Scope 3 target.
This matters because Scope 3 is often 5 to 20 times larger than operational emissions. In plain terms, leaving it out can give you an incomplete picture of your path to net zero.
Start by screening all 15 GHG Protocol categories. Then make sure your target covers at least 67% of total Scope 3 emissions.
Related Blog Posts
Latest Articles
©2025
Narrative Change and Power Building: The Missing Half of Advocacy
Narrative change is the process of disrupting dominant narratives that normalize inequity and advancing new narratives from historically marginalized communities.
Funding Resilience Without Federal Grants
BRIC is unreliable and FEMA is shrinking. Here's how cities fund climate resilience with dedicated revenue, blended finance, and a coordinating authority.
The ESG Blind Spot: How AI Is Finding Risks in Companies Nobody Else Is Watching
Norway's sovereign wealth fund uses AI to screen 7,200 portfolio companies for forced labor and corruption within 24 hours. The real story is the emerging-market coverage gap that traditional ESG data vendors miss — and what it means for any company with a global supply chain.
FAQ
What does it really mean to “redefine profit”?
What makes Council Fire different?
Who does Council Fire work with?
What does working with Council Fire actually look like?
How does Council Fire help organizations turn big goals into action?
How does Council Fire define and measure success?