Jun 9, 2026
How to Decarbonize Maritime Operations and Supply Chains for Universities & Research Institutions
Sustainability Strategy
In This Article
Universities must target maritime Scope 3 emissions by mapping shipping, tightening procurement, and choosing low‑carbon carriers.
How to Decarbonize Maritime Operations and Supply Chains for Universities & Research Institutions
Universities must address emissions from maritime shipping - often overlooked but a major contributor to their carbon footprint. Shipping accounts for 3% of global greenhouse gas emissions, with universities relying heavily on it for transporting lab equipment, research materials, and other goods. These emissions fall under Scope 3, which typically makes up over 75% of a university’s total emissions. Without action, shipping emissions could rise by up to 250% by 2050.
Key steps for universities include:
Mapping emissions: Use tools like AIS data to pinpoint emissions from shipping activities.
Tracking progress: Build a detailed inventory of emissions, covering CO₂, methane, and nitrous oxide, and use advanced tools like SIMAP or shipzero for precise tracking.
Reducing emissions: Consolidate shipments, negotiate slower shipping speeds, and prioritize low-emission carriers or alternative fuels like methanol or hydrogen-hybrid vessels.
Embedding reductions into procurement: Require suppliers to meet emissions standards, report Carbon Intensity Indicator (CII) ratings, and prioritize carriers with sustainable practices.
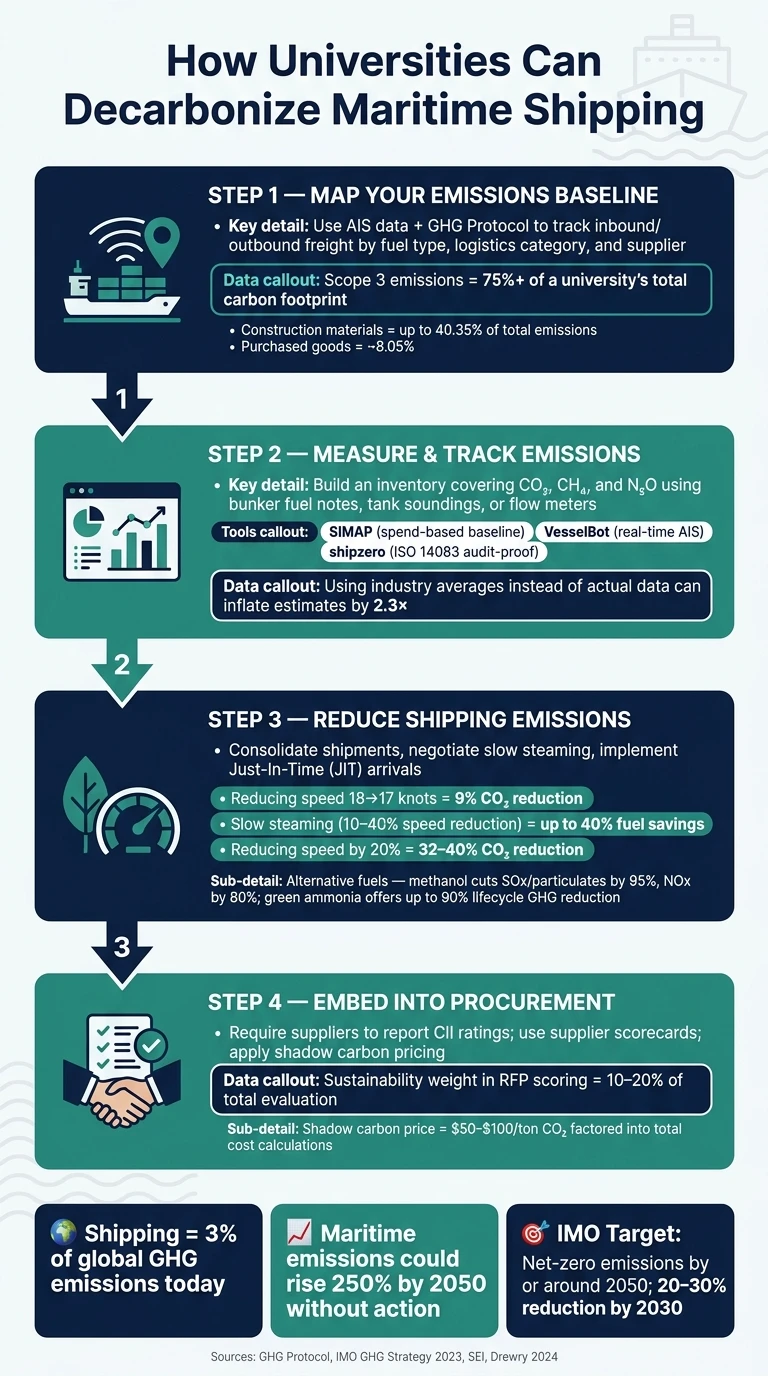
How Universities Can Decarbonize Maritime Shipping: A Step-by-Step Guide
SECURING SUSTAINABLE SHIPPING: Decarbonization of the Shipping Industry |By Prof. Martin Davies
Understanding Maritime Emissions in University Supply Chains
Universities tend to have a better grasp of on-campus activities than the upstream processes tied to their supply chains. This lack of visibility is concerning because Scope 3 emissions - those generated outside campus boundaries - often comprise over 75% of a university's total carbon footprint [6]. Among these, maritime shipping stands out as a hidden yet pervasive contributor, deeply embedded in procurement practices.
Mapping Your Maritime Emissions Baseline
The first step in addressing maritime emissions is to identify their sources. This involves mapping both inbound and outbound freight flows using the Greenhouse Gas (GHG) Protocol as a guide. The data should be broken down by fuel type, logistics category, and supplier. A detailed inventory, rather than broad estimates, is essential for meaningful progress.
One highly effective method links shipping manifests to specific vessels using Automatic Identification System (AIS) data. AIS tracks a ship's position, speed, and draft. When combined with vessel-specific details like engine type, age, and fuel use, this data provides much more precise emission estimates than traditional distance-based calculations. For instance, researchers at the Stockholm Environment Institute applied this technique to analyze 520 million tons of Brazilian cargo across 350,734 trades in 2014. They successfully allocated 26 million metric tons of CO₂ to specific commodities and trade routes [5]. This level of precision is increasingly relevant for institutional supply chain audits, enabling universities to pinpoint major emission sources within their operations.
"New approach ends the opacity around cargo shipping emissions." - SEI [5]
Key Emission Sources Across University Supply Chains
Once a baseline is established, recurring emission hotspots become clear:
Emission Category | Typical University Source | Share of Total Footprint |
|---|---|---|
Construction materials | Maritime transport of steel, cement, and timber for campus projects | Up to 40.35% of total emissions [6] |
Purchased goods | Ocean freight for IT equipment, lab supplies, and furniture | ~8.05% of total emissions [6] |
Research vessel operations | Owned or leased ships used for oceanographic field research | Tracked as Scope 1 or 3 fleet emissions [1] |
Construction materials often emerge as the largest contributor. For example, a 2025 study of the University of Coimbra revealed that construction activities made up 40.35% of total institutional emissions, driven largely by the maritime transport of bulk materials like steel and cement [6]. Meanwhile, purchased goods - ranging from laboratory supplies to IT equipment - accounted for another 8.05%, highlighting the reliance of academic institutions on global ocean freight for essential resources.
Accurate mapping not only clarifies where emissions originate but also helps prioritize reduction efforts. However, decentralized purchasing presents a unique challenge. Fragmented procurement processes scatter freight data across multiple vendors and invoices. To effectively identify maritime emission hotspots, universities must consolidate this data, breaking it down by material type and department. Only then can they fully understand what is being shipped, how it travels, and the resulting emissions impact.
Measuring and Tracking Maritime Emissions
Turning your emissions baseline into actionable metrics is a crucial part of reducing emissions in maritime operations. Once you’ve identified your emission sources, the next step is establishing a consistent measurement system. Without reliable tracking, it’s difficult to determine whether your reduction strategies are effective. This emissions inventory forms the backbone for implementing the advanced tracking tools outlined below.
How to Build a Maritime Emissions Inventory
Creating a maritime emissions inventory begins with defining the pollutants you’ll measure. A comprehensive inventory includes CO₂, methane (CH₄), and nitrous oxide (N₂O) - not just carbon dioxide. To calculate these emissions, gather data on fuel consumption, distance traveled, time at sea, and cargo specifics for each shipment. The most accurate fuel consumption data comes from bunker fuel delivery notes, tank soundings, or flow meters [7].
Next, assign emission factors to each fuel type. Using the GHG Protocol as a framework ensures your methodology is standardized and audit-ready. Document your monitoring plan thoroughly, specifying vessel coverage (by IMO number), emission sources (such as main engines, boilers, and generators), and strategies for addressing data gaps with conservative estimates [7].
"Monitoring and reporting shall be complete and cover greenhouse gas emissions from the combustion of fuels, while the ships are at sea as well as at berth." - Regulation (EU) 2015/757 [7]
To enhance credibility, seek third-party verification. Accredited verifiers can confirm that your inventory aligns with established reporting standards, offering an additional layer of assurance [7].
Once your inventory is established, you can integrate advanced tools to continuously track and refine your emissions data.
Tools and Methods for Tracking Emissions Over Time
For organizations in the early stages of tracking, SIMAP offers a straightforward starting point. It uses spend-based economic input-output (EEIO) factors and includes categories tailored to water transportation, making it ideal for building a Scope 3 baseline when detailed shipment data isn’t available. However, while spend-based methods are convenient, they can overestimate emissions compared to more precise, activity-based approaches [10].
As your tracking capabilities grow, transitioning to detailed, execution-level data can yield better results. Tools like VesselBot leverage real-time AIS and satellite tracking to calculate emissions at the shipment level, offering far greater accuracy than relying on averages. Recognized in 2024 as the top performer in Drewry’s Measurement Provider Comparison Guide for fuel consumption accuracy, VesselBot is particularly useful for research vessels or high-value freight [9]. For those managing complex supply chains or aiming for audit-proof carbon accounting under ISO 14083, platforms like shipzero provide the granular logistics data needed to meet that standard [8].
Here’s a breakdown of tools suited to different tracking needs:
Tool | Data Type | Best Use Case |
|---|---|---|
SIMAP | Spend-based (EEIO) | Establishing an initial Scope 3 baseline using budget data [10] |
VesselBot | Real-time AIS/Satellite | Precise tracking of research vessel routes and freight [9] |
shipzero | Granular logistics data | Audit-proof accounting aligned with ISO 14083 [8] |
EEIO Models | Economic input-output |
Using industry averages instead of actual shipment data can inflate emissions estimates by as much as 2.3× [9]. This discrepancy can have significant implications when setting reduction targets or reporting to accreditation bodies. Adopting a gradual approach - starting with default emission factors and advancing to regional or site-specific data - enables organizations to improve data accuracy over time without overhauling existing systems [6].
Strategies to Cut Maritime Emissions
Once you've established a solid emissions inventory, the next step is figuring out how to use that data effectively. Reducing maritime emissions doesn't mean you have to completely overhaul your supply chain overnight. By focusing on two practical approaches - logistics optimization and choosing cleaner shipping options - you can make meaningful progress without breaking the bank.
Optimizing Logistics to Lower Shipping Demand
One of the easiest ways to start is by reducing your shipping needs. For example, consolidating research equipment orders into fewer, larger shipments can cut down on the number of voyages without disrupting operations. Extending lead times for non-urgent supplies also allows carriers to adopt slower speeds, which significantly reduces fuel consumption. To put it into perspective, slowing a vessel from 18 to 17 knots across the Pacific can lower CO₂ emissions by 9% [14].
Another effective strategy is coordinating with carriers to ensure Just-In-Time (JIT) arrivals, which eliminate unnecessary idling at ports and auxiliary engine use [2]. When negotiating freight contracts, you can include clauses that require JIT arrivals and slow steaming for non-urgent deliveries. A related concept, called virtual arrival, goes a step further by adjusting vessel speeds in real-time based on port congestion data [2].
"Slow steaming and Just-In-Time (JIT) arrival are frequently highlighted due to their immediate emissions reduction potential, with slow steaming relying on speed reduction and JIT aiming to minimise anchorage and waiting times." - Angelos A. Menelaou, Department of Maritime Transport and Commerce, Frederick University [2]
To fund these changes, you might consider implementing an internal carbon fee. Charging something like $25 per ton for high-emission logistics choices can create a revenue stream to reinvest in greener procurement strategies. This approach has worked well in other institutional decarbonization efforts [1].
Once you've optimized logistics, adopting cleaner shipping technologies can further help reduce emissions.
Shifting to Lower-Emission Maritime Options
When logistics improvements aren't enough to meet reduction goals, transitioning to cleaner vessel technologies and fuels can make a big difference. Using your emissions tracking as a guide, you can identify the best low-emission alternatives for your needs.
For institutions that own research vessels, hydrogen-hybrid propulsion is becoming a promising option. For example, UC San Diego's Scripps Institution of Oceanography is developing the California Coastal Research Vessel (CCRV), a 125-foot hydrogen-hybrid vessel. Approved by the American Bureau of Shipping (ABS) and supported by a $35 million allocation from the state of California, this vessel is designed to achieve zero-emission operations for 75% of its missions [13].
"Our goal is to produce a fully-capable ocean-going research vessel that meets the needs of our scientists and students, and demonstrate that this can be done in a way that absolutely minimizes its impact on our environment." - Bruce Appelgate, Associate Director, Scripps Institution of Oceanography [13]
For institutions that depend on third-party carriers, prioritizing those using methanol or LNG as transitional fuels is a practical option. Methanol, for instance, cuts SOx and particulate matter emissions by 95% and NOx by 80%, while requiring less retrofitting than LNG for short-sea shipping [11]. Looking further ahead, green ammonia presents a compelling option for deep-sea routes, offering lifecycle greenhouse gas reductions of up to 90% compared to traditional fuels [11].
To make informed decisions when evaluating these fuel alternatives, procurement teams can use a Multi-Criteria Decision-Making (MCDM) framework. This approach balances factors like cost, technological readiness, safety, and carbon footprint to guide data-driven choices [12].
Embedding Decarbonization into Procurement
Once shipping and fuel optimizations are in place, the next step is weaving decarbonization into procurement practices. With emissions tracking systems already established, companies can now hold suppliers accountable by making decarbonization a formal part of the purchasing process.
Adding Emissions Requirements to Supplier Contracts
Incorporating measurable emissions standards into supplier contracts is a powerful way to drive accountability. For instance, suppliers can be required to report their annual Carbon Intensity Indicator (CII) ratings and outline a clear plan for transitioning to alternative fuels. Contract renewals can then be tied to achieving specific improvement benchmarks [16]. Additionally, requesting a Clean Cargo Working Group (CCWG) emissions factor table from suppliers allows for standardized and transparent comparisons [16].
A real-world example of this approach is the University of Edinburgh's "Edinburgh Pathway", launched in November 2025 under the leadership of Siôn Wheatley and Iwona Cameron. This initiative focuses on engaging suppliers responsible for the majority of emissions, with a targeted annual spend of $455–$585 million (converted from £350–450 million). Initially, it aims to cover suppliers contributing to the top 60% of emissions, with plans to expand to 85% by 2030 [15].
"The Edinburgh Pathway is a structured approach that helps both suppliers and buyers build a collaborative, fair, sustainable supply chain." - Siôn, Department for Social Responsibility and Sustainability, University of Edinburgh [15]
To make procurement decisions more data-driven, supplier scorecards translate these emissions requirements into actionable metrics.
Using Supplier Scorecards to Guide Purchasing Decisions
Supplier scorecards are an effective way to evaluate providers on more than just cost and delivery times. Key metrics to request from carriers include fleet-average CII ratings, grams of CO₂ per TEU-kilometer, and the percentage of voyages powered by sustainable fuels [16].
When scoring responses to Requests for Proposals (RFPs), it's recommended to assign a formal weight to carbon performance. Industry norms suggest allocating 10–20% of the total evaluation score to sustainability, alongside cost (typically 50%) and service quality (typically 30%) [16]. As procurement programs evolve, the weight given to sustainability metrics can gradually increase.
Evaluation Category | Typical Weight | Key Metrics |
|---|---|---|
Total Cost & Commercial Terms | 50% | Freight rates, bunker surcharges, terminal fees |
Service & Operational Quality | 30% | Schedule reliability, transit time, port coverage |
Carbon & Sustainability Performance | 20% | Fleet CII rating (A–E), alternative fuel roadmap, data verification |
Another strategic tool is shadow carbon pricing, where a hypothetical cost of $50–$100 per ton of CO₂ is factored into total cost calculations. This approach can make low-emission carriers appear more financially competitive, even if their base rates are higher, which strengthens the business case for choosing greener options [16].
"A carrier's CII rating is their efficiency report card, but their alternative fuel roadmap is their transcript for the future. Procurement must evaluate both to understand the full picture of decarbonization commitment." - Mark White, Ocean & Air Freight Specialist [16]
Tracking Progress and Improving Over Time
Once decarbonization is integrated into procurement practices, the focus shifts to consistent performance tracking. Embedding decarbonization into contracts is just the beginning; verifying that these measures produce tangible results is the next step. This involves selecting clear metrics, reviewing them regularly, and adjusting strategies as needed when performance falls short.
Key Performance Indicators for Maritime Decarbonization
To effectively monitor progress, focus on metrics tied to emissions intensity rather than total emissions volume. This approach accounts for fluctuations in shipment quantities caused by varying research cycles and academic schedules.
One key metric is the Carbon Intensity Indicator (CII), which measures emissions in grams of CO₂ per cargo-carrying capacity per nautical mile, offering a clear view of carrier efficiency. Pair this with the Energy Efficiency Operational Indicator (EEOI), which tracks CO₂ emissions relative to transport work, for a comprehensive assessment of carrier performance over time. When evaluating new contracts, institutions can also use the Energy Efficiency Design Index (EEDI) to gauge how efficiently a vessel was designed.
Additional metrics like fuel oil consumption (FOC) along major shipping routes and port dwell times - an indicator of idling emissions - are crucial. Reducing port waiting times through just-in-time (JIT) navigation can significantly cut fuel consumption. These metrics provide actionable insights for improving supplier negotiations and refining operational strategies, driving measurable progress in maritime decarbonization.
Setting Up Review and Reporting Processes
Regular reviews are critical for maintaining momentum in decarbonization efforts. Many research institutions adopt an eight-month phased approach: creating a detailed emissions inventory, modeling reduction scenarios, and engaging stakeholders. This iterative process ensures that sustainability goals remain on track and strategies are updated as needed.
Automating data collection through digital dashboards can streamline reporting, offering real-time emissions updates to students, faculty, and administrators. However, data availability remains a challenge - around 70% of organizations cite supplier data limitations as the biggest hurdle in accurately measuring Scope 3 emissions [9].
Review Component | Tools/Methods | Key Metric |
|---|---|---|
Emissions Tracking | AIS Data, UAV Monitoring, PEMS [3] | Carbon Intensity Indicator (CII) [3] |
Performance Modeling | Machine Learning, Digital Twins [3] | Energy Efficiency Design Index (EEDI) [3] |
Financial Refinement | Internal Carbon Fees, Green Revolving Funds [1] | Net Present Value (NPV) of savings [1] |
Institutional Reporting | Open Dashboards, GHG Protocol [1] | % Reduction without offsets [1] |
One effective strategy is implementing an internal carbon fee, which charges high-emission activities to fund efficiency projects. For example, charging $25 per ton of CO₂ for high-emission shipments - such as urgent research freight - can generate significant revenue. A public research university with 35,000 students used this method to collect $1.2 million annually, reinvesting the funds into efficiency projects. This approach helped the university accelerate its carbon neutrality goal from 2040 to 2035 [1]. Additionally, capping carbon offsets at 10% or less of baseline emissions ensures that institutions focus on real operational improvements rather than relying on purchased credits [1].
"At BSM, we see Emissions Connect... as crucial for providing accurate and verified emissions data, which is the necessary 'common ground' for discussions and negotiations." - Alexander Senteris, Compliance Manager, BSM [17]
Decarbonizing Research Logistics
Research logistics often operate under intense time constraints. Whether it’s temperature-sensitive biological samples, delicate oceanographic instruments, or reagents critical to experiments, the need for speed can overshadow efforts to reduce emissions. However, "urgent" doesn't have to translate to "inefficient."
Managing Urgent and Specialized Shipments
One way to address emissions is by improving vessel scheduling before ships even leave port. Traditional queuing systems require vessels to rush to a berth and then idle while waiting for their turn, wasting both time and fuel. Digital queueing systems solve this by assigning berthing slots based on departure times rather than arrival order.
Take the example of the Pacific Maritime Management Systems (PacMMS). In 2021, this partnership introduced an electronic reservation-based queueing system at the Ports of Los Angeles and Long Beach. According to researchers at UC Santa Barbara, this system reduced CO₂ emissions per trip by 16–24% by eliminating the need for ships to race to port [18].
"Without needing to 'hurry up and wait' to secure their spot in line, ships are saving fuel by traveling at slower, more efficient speeds. Just like how your car gets much better gas mileage when you drive 65 mph instead of 85 mph." - Douglas McCauley, Director, Benioff Ocean Science Laboratory [18]
Even small adjustments in speed can make a big difference. For example, reducing a vessel's speed from 18 to 17 knots can lower CO₂ emissions by about 9%. More significant slow steaming practices, with reductions between 10–40%, can cut fuel use by as much as 40% [18][19].
For more complex, multi-leg research shipments, tools like VesselBot utilize digital twins, satellite data, and AI to track emissions at the voyage level across different modes of transport [9]. When it comes to urgent air freight, IATA CO2 Connect for Cargo provides precise, audit-ready emissions data based on actual fuel usage and aircraft-specific load factors, avoiding the inaccuracies of industry averages, which can overestimate emissions by up to 2.3× [9][21].
To make lasting progress, these operational changes need to be paired with procurement strategies that align carrier selection with sustainability goals.
Tailoring Procurement Policies for Research Operations
The unique demands of research logistics require procurement policies that balance urgency with environmental responsibility. Standard procurement templates often fall short, as they don’t account for specialized needs like temperature-sensitive cargo or the consequences of delayed shipments. Instead of exempting research operations from sustainability goals, policies should be adapted to address both operational and environmental priorities.
One way to achieve this is by updating Request for Proposal (RFP) templates. These should include mandatory fields for carrier Carbon Intensity Indicator (CII) ratings, verified emissions data, and plans for transitioning to alternative fuels. Preference can be given to carriers with "A" or "B" CII ratings, while those rated "D" or "E" should be required to submit corrective action plans. For specialized routes, it’s better to benchmark efficiency using voyage-level data rather than relying on fleet-wide averages [20].
Another strategy is to integrate a shadow carbon price - typically $50–$100 per ton of CO₂ - into financial models. This approach allows institutions to justify choosing lower-emission carriers, even if their upfront freight rates are slightly higher. By shifting to a Total Cost of Ownership (TCO) model, organizations can account for future regulatory costs, such as those tied to the EU Emissions Trading System (ETS). The table below highlights how carrier efficiency impacts ETS-related costs on an Asia–Europe shipping lane:
Carrier Profile | Est. CO₂/TEU | Projected EUA Cost (€85/ton) | ETS Surcharge Estimate |
|---|---|---|---|
High-Efficiency (CII A) | 650 kg | €55.25 | €60–€70 |
Industry Average (CII C) | 850 kg | €72.25 | €80–€95 |
Low-Efficiency (CII E) | 1,100 kg | €93.50 | €100–€120 |
Note: EUA = EU Emission Allowance. Costs are illustrative [16]. |
For institutions with recurring research routes, securing longer-term contracts on specific lanes can encourage carriers to deploy their most efficient vessels - or even alternative fuels - on those routes. Known as a green corridor commitment, this strategy works well alongside book-and-claim insetting mechanisms. These mechanisms allow organizations to financially support sustainable marine fuel use, even if the fuel isn’t used on the specific vessel carrying their cargo [16].
Conclusion: Next Steps for Maritime Decarbonization
Maritime decarbonization is a step-by-step journey that gains traction as efforts progress. Universities and research institutions don't need to overhaul everything immediately. Start by analyzing your emissions baseline using current data to pinpoint the areas with the most significant impact. Then, focus on changes that yield measurable results.
From there, consider streamlining logistics, revising procurement policies, and transitioning to lower-emission carriers and fuels. Simple measures like slow steaming - reducing vessel speed by 20% - can cut CO₂ emissions by 32–40% [4]. These early wins build momentum while more complex shifts, such as adopting alternative fuels, are phased in. Additionally, forming strategic partnerships can significantly accelerate progress.
For example, in May 2024, the University of Michigan partnered with the Mærsk Mc-Kinney Møller Center for Zero Carbon Shipping. This collaboration aims to fast-track the maritime industry's transition to zero-carbon operations by 2050 through applied research.
"A partnership with a renowned academic institution like University of Michigan is extremely valuable to the decarbonization of the maritime industry." - Bo Cerup-Simonsen, CEO, Mærsk Mc-Kinney Møller Center for Zero Carbon Shipping [23]
These initiatives not only enhance operational efficiency but also align with global targets like the 2023 IMO GHG Strategy, which aims for net-zero emissions by or around 2050 and interim reductions of 20–30% by 2030 [22]. Without action, maritime emissions could account for 10% of global greenhouse gas emissions by 2050 [24]. For universities and research institutions, taking early action positions them ahead of stricter regulations and rising carbon costs, while also reinforcing their sustainability commitments - an expectation shared by students, faculty, and funders. Beyond reducing emissions, these efforts solidify leadership in sustainability.
FAQs
What data do we need to measure our shipping emissions?
To estimate shipping emissions, you need to multiply Activity Data by an Emission Factor. The precision of your calculation hinges on the quality of the data you use, which can range from detailed vessel-specific information to broader industry averages.
At the very least, ensure you gather the following details:
Cargo weight (in tons)
Distance the shipment traveled
Information about the vessel or carrier
For more accurate results, consider using the Annual Efficiency Ratio (AER), which provides CO2 emissions per tonne-nautical mile. If this isn't feasible, include secondary data as estimates in your reports to maintain transparency.
How can we cut maritime emissions without slowing research?
To address maritime emissions while preserving research effectiveness, institutions can prioritize operational efficiency and cutting-edge technology. Practical measures include adopting Just-In-Time (JIT) arrivals to cut down on fuel consumption and performing regular hull maintenance to maintain optimal performance. Additionally, hybrid propulsion systems, such as hydrogen-powered or battery-assisted designs, allow vessels to meet mission requirements while reducing emissions. These strategies help align maritime activities with environmental goals without hindering research capabilities.
What should we require from carriers in our contracts?
When working with carriers, it’s essential to prioritize those that offer verified emissions data and demonstrate robust efficiency initiatives. Concentrate these requirements on partners managing the majority of your shipping spend - ideally around 75% to 80%. To streamline benchmarking efforts, consider requiring alignment with recognized frameworks such as the EPA’s SmartWay program. This approach promotes transparency and ensures your supply chain supports broader decarbonization objectives.
Related Blog Posts
How to Build a Corporate Sustainability Strategy Aligned to ROI for Maritime & Logistics Companies
How to Develop a Blue Economy Strategy for Maritime & Logistics Companies
How to Decarbonize Maritime Operations and Supply Chains for Corporations
How to Decarbonize Maritime Operations and Supply Chains for NGOs & Nonprofits
Latest Articles
©2026

Narrative Change and Power Building: The Missing Half of Advocacy
Narrative change is the process of disrupting dominant narratives that normalize inequity and advancing new narratives from historically marginalized communities.

Funding Resilience Without Federal Grants
BRIC is unreliable and FEMA is shrinking. Here's how cities fund climate resilience with dedicated revenue, blended finance, and a coordinating authority.

The ESG Blind Spot: How AI Is Finding Risks in Companies Nobody Else Is Watching
Norway's sovereign wealth fund uses AI to screen 7,200 portfolio companies for forced labor and corruption within 24 hours. The real story is the emerging-market coverage gap that traditional ESG data vendors miss — and what it means for any company with a global supply chain.
Narrative Change and Power Building: The Missing Half of Advocacy
Narrative change is the process of disrupting dominant narratives that normalize inequity and advancing new narratives from historically marginalized communities.
Funding Resilience Without Federal Grants
BRIC is unreliable and FEMA is shrinking. Here's how cities fund climate resilience with dedicated revenue, blended finance, and a coordinating authority.
The ESG Blind Spot: How AI Is Finding Risks in Companies Nobody Else Is Watching
Norway's sovereign wealth fund uses AI to screen 7,200 portfolio companies for forced labor and corruption within 24 hours. The real story is the emerging-market coverage gap that traditional ESG data vendors miss — and what it means for any company with a global supply chain.
FAQ
01
What does it really mean to “redefine profit”?
02
What makes Council Fire different?
03
Who does Council Fire work with?
04
What does working with Council Fire actually look like?
05
How does Council Fire help organizations turn big goals into action?
06
How does Council Fire define and measure success?
07
How does technology fit into Council Fire’s work?
Jun 9, 2026
How to Decarbonize Maritime Operations and Supply Chains for Universities & Research Institutions
Sustainability Strategy
In This Article
Universities must target maritime Scope 3 emissions by mapping shipping, tightening procurement, and choosing low‑carbon carriers.
How to Decarbonize Maritime Operations and Supply Chains for Universities & Research Institutions
Universities must address emissions from maritime shipping - often overlooked but a major contributor to their carbon footprint. Shipping accounts for 3% of global greenhouse gas emissions, with universities relying heavily on it for transporting lab equipment, research materials, and other goods. These emissions fall under Scope 3, which typically makes up over 75% of a university’s total emissions. Without action, shipping emissions could rise by up to 250% by 2050.
Key steps for universities include:
Mapping emissions: Use tools like AIS data to pinpoint emissions from shipping activities.
Tracking progress: Build a detailed inventory of emissions, covering CO₂, methane, and nitrous oxide, and use advanced tools like SIMAP or shipzero for precise tracking.
Reducing emissions: Consolidate shipments, negotiate slower shipping speeds, and prioritize low-emission carriers or alternative fuels like methanol or hydrogen-hybrid vessels.
Embedding reductions into procurement: Require suppliers to meet emissions standards, report Carbon Intensity Indicator (CII) ratings, and prioritize carriers with sustainable practices.
How Universities Can Decarbonize Maritime Shipping: A Step-by-Step Guide
SECURING SUSTAINABLE SHIPPING: Decarbonization of the Shipping Industry |By Prof. Martin Davies
Understanding Maritime Emissions in University Supply Chains
Universities tend to have a better grasp of on-campus activities than the upstream processes tied to their supply chains. This lack of visibility is concerning because Scope 3 emissions - those generated outside campus boundaries - often comprise over 75% of a university's total carbon footprint [6]. Among these, maritime shipping stands out as a hidden yet pervasive contributor, deeply embedded in procurement practices.
Mapping Your Maritime Emissions Baseline
The first step in addressing maritime emissions is to identify their sources. This involves mapping both inbound and outbound freight flows using the Greenhouse Gas (GHG) Protocol as a guide. The data should be broken down by fuel type, logistics category, and supplier. A detailed inventory, rather than broad estimates, is essential for meaningful progress.
One highly effective method links shipping manifests to specific vessels using Automatic Identification System (AIS) data. AIS tracks a ship's position, speed, and draft. When combined with vessel-specific details like engine type, age, and fuel use, this data provides much more precise emission estimates than traditional distance-based calculations. For instance, researchers at the Stockholm Environment Institute applied this technique to analyze 520 million tons of Brazilian cargo across 350,734 trades in 2014. They successfully allocated 26 million metric tons of CO₂ to specific commodities and trade routes [5]. This level of precision is increasingly relevant for institutional supply chain audits, enabling universities to pinpoint major emission sources within their operations.
"New approach ends the opacity around cargo shipping emissions." - SEI [5]
Key Emission Sources Across University Supply Chains
Once a baseline is established, recurring emission hotspots become clear:
Emission Category | Typical University Source | Share of Total Footprint |
|---|---|---|
Construction materials | Maritime transport of steel, cement, and timber for campus projects | Up to 40.35% of total emissions [6] |
Purchased goods | Ocean freight for IT equipment, lab supplies, and furniture | ~8.05% of total emissions [6] |
Research vessel operations | Owned or leased ships used for oceanographic field research | Tracked as Scope 1 or 3 fleet emissions [1] |
Construction materials often emerge as the largest contributor. For example, a 2025 study of the University of Coimbra revealed that construction activities made up 40.35% of total institutional emissions, driven largely by the maritime transport of bulk materials like steel and cement [6]. Meanwhile, purchased goods - ranging from laboratory supplies to IT equipment - accounted for another 8.05%, highlighting the reliance of academic institutions on global ocean freight for essential resources.
Accurate mapping not only clarifies where emissions originate but also helps prioritize reduction efforts. However, decentralized purchasing presents a unique challenge. Fragmented procurement processes scatter freight data across multiple vendors and invoices. To effectively identify maritime emission hotspots, universities must consolidate this data, breaking it down by material type and department. Only then can they fully understand what is being shipped, how it travels, and the resulting emissions impact.
Measuring and Tracking Maritime Emissions
Turning your emissions baseline into actionable metrics is a crucial part of reducing emissions in maritime operations. Once you’ve identified your emission sources, the next step is establishing a consistent measurement system. Without reliable tracking, it’s difficult to determine whether your reduction strategies are effective. This emissions inventory forms the backbone for implementing the advanced tracking tools outlined below.
How to Build a Maritime Emissions Inventory
Creating a maritime emissions inventory begins with defining the pollutants you’ll measure. A comprehensive inventory includes CO₂, methane (CH₄), and nitrous oxide (N₂O) - not just carbon dioxide. To calculate these emissions, gather data on fuel consumption, distance traveled, time at sea, and cargo specifics for each shipment. The most accurate fuel consumption data comes from bunker fuel delivery notes, tank soundings, or flow meters [7].
Next, assign emission factors to each fuel type. Using the GHG Protocol as a framework ensures your methodology is standardized and audit-ready. Document your monitoring plan thoroughly, specifying vessel coverage (by IMO number), emission sources (such as main engines, boilers, and generators), and strategies for addressing data gaps with conservative estimates [7].
"Monitoring and reporting shall be complete and cover greenhouse gas emissions from the combustion of fuels, while the ships are at sea as well as at berth." - Regulation (EU) 2015/757 [7]
To enhance credibility, seek third-party verification. Accredited verifiers can confirm that your inventory aligns with established reporting standards, offering an additional layer of assurance [7].
Once your inventory is established, you can integrate advanced tools to continuously track and refine your emissions data.
Tools and Methods for Tracking Emissions Over Time
For organizations in the early stages of tracking, SIMAP offers a straightforward starting point. It uses spend-based economic input-output (EEIO) factors and includes categories tailored to water transportation, making it ideal for building a Scope 3 baseline when detailed shipment data isn’t available. However, while spend-based methods are convenient, they can overestimate emissions compared to more precise, activity-based approaches [10].
As your tracking capabilities grow, transitioning to detailed, execution-level data can yield better results. Tools like VesselBot leverage real-time AIS and satellite tracking to calculate emissions at the shipment level, offering far greater accuracy than relying on averages. Recognized in 2024 as the top performer in Drewry’s Measurement Provider Comparison Guide for fuel consumption accuracy, VesselBot is particularly useful for research vessels or high-value freight [9]. For those managing complex supply chains or aiming for audit-proof carbon accounting under ISO 14083, platforms like shipzero provide the granular logistics data needed to meet that standard [8].
Here’s a breakdown of tools suited to different tracking needs:
Tool | Data Type | Best Use Case |
|---|---|---|
SIMAP | Spend-based (EEIO) | Establishing an initial Scope 3 baseline using budget data [10] |
VesselBot | Real-time AIS/Satellite | Precise tracking of research vessel routes and freight [9] |
shipzero | Granular logistics data | Audit-proof accounting aligned with ISO 14083 [8] |
EEIO Models | Economic input-output |
Using industry averages instead of actual shipment data can inflate emissions estimates by as much as 2.3× [9]. This discrepancy can have significant implications when setting reduction targets or reporting to accreditation bodies. Adopting a gradual approach - starting with default emission factors and advancing to regional or site-specific data - enables organizations to improve data accuracy over time without overhauling existing systems [6].
Strategies to Cut Maritime Emissions
Once you've established a solid emissions inventory, the next step is figuring out how to use that data effectively. Reducing maritime emissions doesn't mean you have to completely overhaul your supply chain overnight. By focusing on two practical approaches - logistics optimization and choosing cleaner shipping options - you can make meaningful progress without breaking the bank.
Optimizing Logistics to Lower Shipping Demand
One of the easiest ways to start is by reducing your shipping needs. For example, consolidating research equipment orders into fewer, larger shipments can cut down on the number of voyages without disrupting operations. Extending lead times for non-urgent supplies also allows carriers to adopt slower speeds, which significantly reduces fuel consumption. To put it into perspective, slowing a vessel from 18 to 17 knots across the Pacific can lower CO₂ emissions by 9% [14].
Another effective strategy is coordinating with carriers to ensure Just-In-Time (JIT) arrivals, which eliminate unnecessary idling at ports and auxiliary engine use [2]. When negotiating freight contracts, you can include clauses that require JIT arrivals and slow steaming for non-urgent deliveries. A related concept, called virtual arrival, goes a step further by adjusting vessel speeds in real-time based on port congestion data [2].
"Slow steaming and Just-In-Time (JIT) arrival are frequently highlighted due to their immediate emissions reduction potential, with slow steaming relying on speed reduction and JIT aiming to minimise anchorage and waiting times." - Angelos A. Menelaou, Department of Maritime Transport and Commerce, Frederick University [2]
To fund these changes, you might consider implementing an internal carbon fee. Charging something like $25 per ton for high-emission logistics choices can create a revenue stream to reinvest in greener procurement strategies. This approach has worked well in other institutional decarbonization efforts [1].
Once you've optimized logistics, adopting cleaner shipping technologies can further help reduce emissions.
Shifting to Lower-Emission Maritime Options
When logistics improvements aren't enough to meet reduction goals, transitioning to cleaner vessel technologies and fuels can make a big difference. Using your emissions tracking as a guide, you can identify the best low-emission alternatives for your needs.
For institutions that own research vessels, hydrogen-hybrid propulsion is becoming a promising option. For example, UC San Diego's Scripps Institution of Oceanography is developing the California Coastal Research Vessel (CCRV), a 125-foot hydrogen-hybrid vessel. Approved by the American Bureau of Shipping (ABS) and supported by a $35 million allocation from the state of California, this vessel is designed to achieve zero-emission operations for 75% of its missions [13].
"Our goal is to produce a fully-capable ocean-going research vessel that meets the needs of our scientists and students, and demonstrate that this can be done in a way that absolutely minimizes its impact on our environment." - Bruce Appelgate, Associate Director, Scripps Institution of Oceanography [13]
For institutions that depend on third-party carriers, prioritizing those using methanol or LNG as transitional fuels is a practical option. Methanol, for instance, cuts SOx and particulate matter emissions by 95% and NOx by 80%, while requiring less retrofitting than LNG for short-sea shipping [11]. Looking further ahead, green ammonia presents a compelling option for deep-sea routes, offering lifecycle greenhouse gas reductions of up to 90% compared to traditional fuels [11].
To make informed decisions when evaluating these fuel alternatives, procurement teams can use a Multi-Criteria Decision-Making (MCDM) framework. This approach balances factors like cost, technological readiness, safety, and carbon footprint to guide data-driven choices [12].
Embedding Decarbonization into Procurement
Once shipping and fuel optimizations are in place, the next step is weaving decarbonization into procurement practices. With emissions tracking systems already established, companies can now hold suppliers accountable by making decarbonization a formal part of the purchasing process.
Adding Emissions Requirements to Supplier Contracts
Incorporating measurable emissions standards into supplier contracts is a powerful way to drive accountability. For instance, suppliers can be required to report their annual Carbon Intensity Indicator (CII) ratings and outline a clear plan for transitioning to alternative fuels. Contract renewals can then be tied to achieving specific improvement benchmarks [16]. Additionally, requesting a Clean Cargo Working Group (CCWG) emissions factor table from suppliers allows for standardized and transparent comparisons [16].
A real-world example of this approach is the University of Edinburgh's "Edinburgh Pathway", launched in November 2025 under the leadership of Siôn Wheatley and Iwona Cameron. This initiative focuses on engaging suppliers responsible for the majority of emissions, with a targeted annual spend of $455–$585 million (converted from £350–450 million). Initially, it aims to cover suppliers contributing to the top 60% of emissions, with plans to expand to 85% by 2030 [15].
"The Edinburgh Pathway is a structured approach that helps both suppliers and buyers build a collaborative, fair, sustainable supply chain." - Siôn, Department for Social Responsibility and Sustainability, University of Edinburgh [15]
To make procurement decisions more data-driven, supplier scorecards translate these emissions requirements into actionable metrics.
Using Supplier Scorecards to Guide Purchasing Decisions
Supplier scorecards are an effective way to evaluate providers on more than just cost and delivery times. Key metrics to request from carriers include fleet-average CII ratings, grams of CO₂ per TEU-kilometer, and the percentage of voyages powered by sustainable fuels [16].
When scoring responses to Requests for Proposals (RFPs), it's recommended to assign a formal weight to carbon performance. Industry norms suggest allocating 10–20% of the total evaluation score to sustainability, alongside cost (typically 50%) and service quality (typically 30%) [16]. As procurement programs evolve, the weight given to sustainability metrics can gradually increase.
Evaluation Category | Typical Weight | Key Metrics |
|---|---|---|
Total Cost & Commercial Terms | 50% | Freight rates, bunker surcharges, terminal fees |
Service & Operational Quality | 30% | Schedule reliability, transit time, port coverage |
Carbon & Sustainability Performance | 20% | Fleet CII rating (A–E), alternative fuel roadmap, data verification |
Another strategic tool is shadow carbon pricing, where a hypothetical cost of $50–$100 per ton of CO₂ is factored into total cost calculations. This approach can make low-emission carriers appear more financially competitive, even if their base rates are higher, which strengthens the business case for choosing greener options [16].
"A carrier's CII rating is their efficiency report card, but their alternative fuel roadmap is their transcript for the future. Procurement must evaluate both to understand the full picture of decarbonization commitment." - Mark White, Ocean & Air Freight Specialist [16]
Tracking Progress and Improving Over Time
Once decarbonization is integrated into procurement practices, the focus shifts to consistent performance tracking. Embedding decarbonization into contracts is just the beginning; verifying that these measures produce tangible results is the next step. This involves selecting clear metrics, reviewing them regularly, and adjusting strategies as needed when performance falls short.
Key Performance Indicators for Maritime Decarbonization
To effectively monitor progress, focus on metrics tied to emissions intensity rather than total emissions volume. This approach accounts for fluctuations in shipment quantities caused by varying research cycles and academic schedules.
One key metric is the Carbon Intensity Indicator (CII), which measures emissions in grams of CO₂ per cargo-carrying capacity per nautical mile, offering a clear view of carrier efficiency. Pair this with the Energy Efficiency Operational Indicator (EEOI), which tracks CO₂ emissions relative to transport work, for a comprehensive assessment of carrier performance over time. When evaluating new contracts, institutions can also use the Energy Efficiency Design Index (EEDI) to gauge how efficiently a vessel was designed.
Additional metrics like fuel oil consumption (FOC) along major shipping routes and port dwell times - an indicator of idling emissions - are crucial. Reducing port waiting times through just-in-time (JIT) navigation can significantly cut fuel consumption. These metrics provide actionable insights for improving supplier negotiations and refining operational strategies, driving measurable progress in maritime decarbonization.
Setting Up Review and Reporting Processes
Regular reviews are critical for maintaining momentum in decarbonization efforts. Many research institutions adopt an eight-month phased approach: creating a detailed emissions inventory, modeling reduction scenarios, and engaging stakeholders. This iterative process ensures that sustainability goals remain on track and strategies are updated as needed.
Automating data collection through digital dashboards can streamline reporting, offering real-time emissions updates to students, faculty, and administrators. However, data availability remains a challenge - around 70% of organizations cite supplier data limitations as the biggest hurdle in accurately measuring Scope 3 emissions [9].
Review Component | Tools/Methods | Key Metric |
|---|---|---|
Emissions Tracking | AIS Data, UAV Monitoring, PEMS [3] | Carbon Intensity Indicator (CII) [3] |
Performance Modeling | Machine Learning, Digital Twins [3] | Energy Efficiency Design Index (EEDI) [3] |
Financial Refinement | Internal Carbon Fees, Green Revolving Funds [1] | Net Present Value (NPV) of savings [1] |
Institutional Reporting | Open Dashboards, GHG Protocol [1] | % Reduction without offsets [1] |
One effective strategy is implementing an internal carbon fee, which charges high-emission activities to fund efficiency projects. For example, charging $25 per ton of CO₂ for high-emission shipments - such as urgent research freight - can generate significant revenue. A public research university with 35,000 students used this method to collect $1.2 million annually, reinvesting the funds into efficiency projects. This approach helped the university accelerate its carbon neutrality goal from 2040 to 2035 [1]. Additionally, capping carbon offsets at 10% or less of baseline emissions ensures that institutions focus on real operational improvements rather than relying on purchased credits [1].
"At BSM, we see Emissions Connect... as crucial for providing accurate and verified emissions data, which is the necessary 'common ground' for discussions and negotiations." - Alexander Senteris, Compliance Manager, BSM [17]
Decarbonizing Research Logistics
Research logistics often operate under intense time constraints. Whether it’s temperature-sensitive biological samples, delicate oceanographic instruments, or reagents critical to experiments, the need for speed can overshadow efforts to reduce emissions. However, "urgent" doesn't have to translate to "inefficient."
Managing Urgent and Specialized Shipments
One way to address emissions is by improving vessel scheduling before ships even leave port. Traditional queuing systems require vessels to rush to a berth and then idle while waiting for their turn, wasting both time and fuel. Digital queueing systems solve this by assigning berthing slots based on departure times rather than arrival order.
Take the example of the Pacific Maritime Management Systems (PacMMS). In 2021, this partnership introduced an electronic reservation-based queueing system at the Ports of Los Angeles and Long Beach. According to researchers at UC Santa Barbara, this system reduced CO₂ emissions per trip by 16–24% by eliminating the need for ships to race to port [18].
"Without needing to 'hurry up and wait' to secure their spot in line, ships are saving fuel by traveling at slower, more efficient speeds. Just like how your car gets much better gas mileage when you drive 65 mph instead of 85 mph." - Douglas McCauley, Director, Benioff Ocean Science Laboratory [18]
Even small adjustments in speed can make a big difference. For example, reducing a vessel's speed from 18 to 17 knots can lower CO₂ emissions by about 9%. More significant slow steaming practices, with reductions between 10–40%, can cut fuel use by as much as 40% [18][19].
For more complex, multi-leg research shipments, tools like VesselBot utilize digital twins, satellite data, and AI to track emissions at the voyage level across different modes of transport [9]. When it comes to urgent air freight, IATA CO2 Connect for Cargo provides precise, audit-ready emissions data based on actual fuel usage and aircraft-specific load factors, avoiding the inaccuracies of industry averages, which can overestimate emissions by up to 2.3× [9][21].
To make lasting progress, these operational changes need to be paired with procurement strategies that align carrier selection with sustainability goals.
Tailoring Procurement Policies for Research Operations
The unique demands of research logistics require procurement policies that balance urgency with environmental responsibility. Standard procurement templates often fall short, as they don’t account for specialized needs like temperature-sensitive cargo or the consequences of delayed shipments. Instead of exempting research operations from sustainability goals, policies should be adapted to address both operational and environmental priorities.
One way to achieve this is by updating Request for Proposal (RFP) templates. These should include mandatory fields for carrier Carbon Intensity Indicator (CII) ratings, verified emissions data, and plans for transitioning to alternative fuels. Preference can be given to carriers with "A" or "B" CII ratings, while those rated "D" or "E" should be required to submit corrective action plans. For specialized routes, it’s better to benchmark efficiency using voyage-level data rather than relying on fleet-wide averages [20].
Another strategy is to integrate a shadow carbon price - typically $50–$100 per ton of CO₂ - into financial models. This approach allows institutions to justify choosing lower-emission carriers, even if their upfront freight rates are slightly higher. By shifting to a Total Cost of Ownership (TCO) model, organizations can account for future regulatory costs, such as those tied to the EU Emissions Trading System (ETS). The table below highlights how carrier efficiency impacts ETS-related costs on an Asia–Europe shipping lane:
Carrier Profile | Est. CO₂/TEU | Projected EUA Cost (€85/ton) | ETS Surcharge Estimate |
|---|---|---|---|
High-Efficiency (CII A) | 650 kg | €55.25 | €60–€70 |
Industry Average (CII C) | 850 kg | €72.25 | €80–€95 |
Low-Efficiency (CII E) | 1,100 kg | €93.50 | €100–€120 |
Note: EUA = EU Emission Allowance. Costs are illustrative [16]. |
For institutions with recurring research routes, securing longer-term contracts on specific lanes can encourage carriers to deploy their most efficient vessels - or even alternative fuels - on those routes. Known as a green corridor commitment, this strategy works well alongside book-and-claim insetting mechanisms. These mechanisms allow organizations to financially support sustainable marine fuel use, even if the fuel isn’t used on the specific vessel carrying their cargo [16].
Conclusion: Next Steps for Maritime Decarbonization
Maritime decarbonization is a step-by-step journey that gains traction as efforts progress. Universities and research institutions don't need to overhaul everything immediately. Start by analyzing your emissions baseline using current data to pinpoint the areas with the most significant impact. Then, focus on changes that yield measurable results.
From there, consider streamlining logistics, revising procurement policies, and transitioning to lower-emission carriers and fuels. Simple measures like slow steaming - reducing vessel speed by 20% - can cut CO₂ emissions by 32–40% [4]. These early wins build momentum while more complex shifts, such as adopting alternative fuels, are phased in. Additionally, forming strategic partnerships can significantly accelerate progress.
For example, in May 2024, the University of Michigan partnered with the Mærsk Mc-Kinney Møller Center for Zero Carbon Shipping. This collaboration aims to fast-track the maritime industry's transition to zero-carbon operations by 2050 through applied research.
"A partnership with a renowned academic institution like University of Michigan is extremely valuable to the decarbonization of the maritime industry." - Bo Cerup-Simonsen, CEO, Mærsk Mc-Kinney Møller Center for Zero Carbon Shipping [23]
These initiatives not only enhance operational efficiency but also align with global targets like the 2023 IMO GHG Strategy, which aims for net-zero emissions by or around 2050 and interim reductions of 20–30% by 2030 [22]. Without action, maritime emissions could account for 10% of global greenhouse gas emissions by 2050 [24]. For universities and research institutions, taking early action positions them ahead of stricter regulations and rising carbon costs, while also reinforcing their sustainability commitments - an expectation shared by students, faculty, and funders. Beyond reducing emissions, these efforts solidify leadership in sustainability.
FAQs
What data do we need to measure our shipping emissions?
To estimate shipping emissions, you need to multiply Activity Data by an Emission Factor. The precision of your calculation hinges on the quality of the data you use, which can range from detailed vessel-specific information to broader industry averages.
At the very least, ensure you gather the following details:
Cargo weight (in tons)
Distance the shipment traveled
Information about the vessel or carrier
For more accurate results, consider using the Annual Efficiency Ratio (AER), which provides CO2 emissions per tonne-nautical mile. If this isn't feasible, include secondary data as estimates in your reports to maintain transparency.
How can we cut maritime emissions without slowing research?
To address maritime emissions while preserving research effectiveness, institutions can prioritize operational efficiency and cutting-edge technology. Practical measures include adopting Just-In-Time (JIT) arrivals to cut down on fuel consumption and performing regular hull maintenance to maintain optimal performance. Additionally, hybrid propulsion systems, such as hydrogen-powered or battery-assisted designs, allow vessels to meet mission requirements while reducing emissions. These strategies help align maritime activities with environmental goals without hindering research capabilities.
What should we require from carriers in our contracts?
When working with carriers, it’s essential to prioritize those that offer verified emissions data and demonstrate robust efficiency initiatives. Concentrate these requirements on partners managing the majority of your shipping spend - ideally around 75% to 80%. To streamline benchmarking efforts, consider requiring alignment with recognized frameworks such as the EPA’s SmartWay program. This approach promotes transparency and ensures your supply chain supports broader decarbonization objectives.
Related Blog Posts
How to Build a Corporate Sustainability Strategy Aligned to ROI for Maritime & Logistics Companies
How to Develop a Blue Economy Strategy for Maritime & Logistics Companies
How to Decarbonize Maritime Operations and Supply Chains for Corporations
How to Decarbonize Maritime Operations and Supply Chains for NGOs & Nonprofits
Latest Articles
©2026
Narrative Change and Power Building: The Missing Half of Advocacy
Narrative change is the process of disrupting dominant narratives that normalize inequity and advancing new narratives from historically marginalized communities.
Funding Resilience Without Federal Grants
BRIC is unreliable and FEMA is shrinking. Here's how cities fund climate resilience with dedicated revenue, blended finance, and a coordinating authority.
The ESG Blind Spot: How AI Is Finding Risks in Companies Nobody Else Is Watching
Norway's sovereign wealth fund uses AI to screen 7,200 portfolio companies for forced labor and corruption within 24 hours. The real story is the emerging-market coverage gap that traditional ESG data vendors miss — and what it means for any company with a global supply chain.
FAQ
01
What does it really mean to “redefine profit”?
02
What makes Council Fire different?
03
Who does Council Fire work with?
04
What does working with Council Fire actually look like?
05
How does Council Fire help organizations turn big goals into action?
06
How does Council Fire define and measure success?
07
How does technology fit into Council Fire’s work?
Jun 9, 2026
How to Decarbonize Maritime Operations and Supply Chains for Universities & Research Institutions
Sustainability Strategy
In This Article
Universities must target maritime Scope 3 emissions by mapping shipping, tightening procurement, and choosing low‑carbon carriers.
How to Decarbonize Maritime Operations and Supply Chains for Universities & Research Institutions
Universities must address emissions from maritime shipping - often overlooked but a major contributor to their carbon footprint. Shipping accounts for 3% of global greenhouse gas emissions, with universities relying heavily on it for transporting lab equipment, research materials, and other goods. These emissions fall under Scope 3, which typically makes up over 75% of a university’s total emissions. Without action, shipping emissions could rise by up to 250% by 2050.
Key steps for universities include:
Mapping emissions: Use tools like AIS data to pinpoint emissions from shipping activities.
Tracking progress: Build a detailed inventory of emissions, covering CO₂, methane, and nitrous oxide, and use advanced tools like SIMAP or shipzero for precise tracking.
Reducing emissions: Consolidate shipments, negotiate slower shipping speeds, and prioritize low-emission carriers or alternative fuels like methanol or hydrogen-hybrid vessels.
Embedding reductions into procurement: Require suppliers to meet emissions standards, report Carbon Intensity Indicator (CII) ratings, and prioritize carriers with sustainable practices.
How Universities Can Decarbonize Maritime Shipping: A Step-by-Step Guide
SECURING SUSTAINABLE SHIPPING: Decarbonization of the Shipping Industry |By Prof. Martin Davies
Understanding Maritime Emissions in University Supply Chains
Universities tend to have a better grasp of on-campus activities than the upstream processes tied to their supply chains. This lack of visibility is concerning because Scope 3 emissions - those generated outside campus boundaries - often comprise over 75% of a university's total carbon footprint [6]. Among these, maritime shipping stands out as a hidden yet pervasive contributor, deeply embedded in procurement practices.
Mapping Your Maritime Emissions Baseline
The first step in addressing maritime emissions is to identify their sources. This involves mapping both inbound and outbound freight flows using the Greenhouse Gas (GHG) Protocol as a guide. The data should be broken down by fuel type, logistics category, and supplier. A detailed inventory, rather than broad estimates, is essential for meaningful progress.
One highly effective method links shipping manifests to specific vessels using Automatic Identification System (AIS) data. AIS tracks a ship's position, speed, and draft. When combined with vessel-specific details like engine type, age, and fuel use, this data provides much more precise emission estimates than traditional distance-based calculations. For instance, researchers at the Stockholm Environment Institute applied this technique to analyze 520 million tons of Brazilian cargo across 350,734 trades in 2014. They successfully allocated 26 million metric tons of CO₂ to specific commodities and trade routes [5]. This level of precision is increasingly relevant for institutional supply chain audits, enabling universities to pinpoint major emission sources within their operations.
"New approach ends the opacity around cargo shipping emissions." - SEI [5]
Key Emission Sources Across University Supply Chains
Once a baseline is established, recurring emission hotspots become clear:
Emission Category | Typical University Source | Share of Total Footprint |
|---|---|---|
Construction materials | Maritime transport of steel, cement, and timber for campus projects | Up to 40.35% of total emissions [6] |
Purchased goods | Ocean freight for IT equipment, lab supplies, and furniture | ~8.05% of total emissions [6] |
Research vessel operations | Owned or leased ships used for oceanographic field research | Tracked as Scope 1 or 3 fleet emissions [1] |
Construction materials often emerge as the largest contributor. For example, a 2025 study of the University of Coimbra revealed that construction activities made up 40.35% of total institutional emissions, driven largely by the maritime transport of bulk materials like steel and cement [6]. Meanwhile, purchased goods - ranging from laboratory supplies to IT equipment - accounted for another 8.05%, highlighting the reliance of academic institutions on global ocean freight for essential resources.
Accurate mapping not only clarifies where emissions originate but also helps prioritize reduction efforts. However, decentralized purchasing presents a unique challenge. Fragmented procurement processes scatter freight data across multiple vendors and invoices. To effectively identify maritime emission hotspots, universities must consolidate this data, breaking it down by material type and department. Only then can they fully understand what is being shipped, how it travels, and the resulting emissions impact.
Measuring and Tracking Maritime Emissions
Turning your emissions baseline into actionable metrics is a crucial part of reducing emissions in maritime operations. Once you’ve identified your emission sources, the next step is establishing a consistent measurement system. Without reliable tracking, it’s difficult to determine whether your reduction strategies are effective. This emissions inventory forms the backbone for implementing the advanced tracking tools outlined below.
How to Build a Maritime Emissions Inventory
Creating a maritime emissions inventory begins with defining the pollutants you’ll measure. A comprehensive inventory includes CO₂, methane (CH₄), and nitrous oxide (N₂O) - not just carbon dioxide. To calculate these emissions, gather data on fuel consumption, distance traveled, time at sea, and cargo specifics for each shipment. The most accurate fuel consumption data comes from bunker fuel delivery notes, tank soundings, or flow meters [7].
Next, assign emission factors to each fuel type. Using the GHG Protocol as a framework ensures your methodology is standardized and audit-ready. Document your monitoring plan thoroughly, specifying vessel coverage (by IMO number), emission sources (such as main engines, boilers, and generators), and strategies for addressing data gaps with conservative estimates [7].
"Monitoring and reporting shall be complete and cover greenhouse gas emissions from the combustion of fuels, while the ships are at sea as well as at berth." - Regulation (EU) 2015/757 [7]
To enhance credibility, seek third-party verification. Accredited verifiers can confirm that your inventory aligns with established reporting standards, offering an additional layer of assurance [7].
Once your inventory is established, you can integrate advanced tools to continuously track and refine your emissions data.
Tools and Methods for Tracking Emissions Over Time
For organizations in the early stages of tracking, SIMAP offers a straightforward starting point. It uses spend-based economic input-output (EEIO) factors and includes categories tailored to water transportation, making it ideal for building a Scope 3 baseline when detailed shipment data isn’t available. However, while spend-based methods are convenient, they can overestimate emissions compared to more precise, activity-based approaches [10].
As your tracking capabilities grow, transitioning to detailed, execution-level data can yield better results. Tools like VesselBot leverage real-time AIS and satellite tracking to calculate emissions at the shipment level, offering far greater accuracy than relying on averages. Recognized in 2024 as the top performer in Drewry’s Measurement Provider Comparison Guide for fuel consumption accuracy, VesselBot is particularly useful for research vessels or high-value freight [9]. For those managing complex supply chains or aiming for audit-proof carbon accounting under ISO 14083, platforms like shipzero provide the granular logistics data needed to meet that standard [8].
Here’s a breakdown of tools suited to different tracking needs:
Tool | Data Type | Best Use Case |
|---|---|---|
SIMAP | Spend-based (EEIO) | Establishing an initial Scope 3 baseline using budget data [10] |
VesselBot | Real-time AIS/Satellite | Precise tracking of research vessel routes and freight [9] |
shipzero | Granular logistics data | Audit-proof accounting aligned with ISO 14083 [8] |
EEIO Models | Economic input-output |
Using industry averages instead of actual shipment data can inflate emissions estimates by as much as 2.3× [9]. This discrepancy can have significant implications when setting reduction targets or reporting to accreditation bodies. Adopting a gradual approach - starting with default emission factors and advancing to regional or site-specific data - enables organizations to improve data accuracy over time without overhauling existing systems [6].
Strategies to Cut Maritime Emissions
Once you've established a solid emissions inventory, the next step is figuring out how to use that data effectively. Reducing maritime emissions doesn't mean you have to completely overhaul your supply chain overnight. By focusing on two practical approaches - logistics optimization and choosing cleaner shipping options - you can make meaningful progress without breaking the bank.
Optimizing Logistics to Lower Shipping Demand
One of the easiest ways to start is by reducing your shipping needs. For example, consolidating research equipment orders into fewer, larger shipments can cut down on the number of voyages without disrupting operations. Extending lead times for non-urgent supplies also allows carriers to adopt slower speeds, which significantly reduces fuel consumption. To put it into perspective, slowing a vessel from 18 to 17 knots across the Pacific can lower CO₂ emissions by 9% [14].
Another effective strategy is coordinating with carriers to ensure Just-In-Time (JIT) arrivals, which eliminate unnecessary idling at ports and auxiliary engine use [2]. When negotiating freight contracts, you can include clauses that require JIT arrivals and slow steaming for non-urgent deliveries. A related concept, called virtual arrival, goes a step further by adjusting vessel speeds in real-time based on port congestion data [2].
"Slow steaming and Just-In-Time (JIT) arrival are frequently highlighted due to their immediate emissions reduction potential, with slow steaming relying on speed reduction and JIT aiming to minimise anchorage and waiting times." - Angelos A. Menelaou, Department of Maritime Transport and Commerce, Frederick University [2]
To fund these changes, you might consider implementing an internal carbon fee. Charging something like $25 per ton for high-emission logistics choices can create a revenue stream to reinvest in greener procurement strategies. This approach has worked well in other institutional decarbonization efforts [1].
Once you've optimized logistics, adopting cleaner shipping technologies can further help reduce emissions.
Shifting to Lower-Emission Maritime Options
When logistics improvements aren't enough to meet reduction goals, transitioning to cleaner vessel technologies and fuels can make a big difference. Using your emissions tracking as a guide, you can identify the best low-emission alternatives for your needs.
For institutions that own research vessels, hydrogen-hybrid propulsion is becoming a promising option. For example, UC San Diego's Scripps Institution of Oceanography is developing the California Coastal Research Vessel (CCRV), a 125-foot hydrogen-hybrid vessel. Approved by the American Bureau of Shipping (ABS) and supported by a $35 million allocation from the state of California, this vessel is designed to achieve zero-emission operations for 75% of its missions [13].
"Our goal is to produce a fully-capable ocean-going research vessel that meets the needs of our scientists and students, and demonstrate that this can be done in a way that absolutely minimizes its impact on our environment." - Bruce Appelgate, Associate Director, Scripps Institution of Oceanography [13]
For institutions that depend on third-party carriers, prioritizing those using methanol or LNG as transitional fuels is a practical option. Methanol, for instance, cuts SOx and particulate matter emissions by 95% and NOx by 80%, while requiring less retrofitting than LNG for short-sea shipping [11]. Looking further ahead, green ammonia presents a compelling option for deep-sea routes, offering lifecycle greenhouse gas reductions of up to 90% compared to traditional fuels [11].
To make informed decisions when evaluating these fuel alternatives, procurement teams can use a Multi-Criteria Decision-Making (MCDM) framework. This approach balances factors like cost, technological readiness, safety, and carbon footprint to guide data-driven choices [12].
Embedding Decarbonization into Procurement
Once shipping and fuel optimizations are in place, the next step is weaving decarbonization into procurement practices. With emissions tracking systems already established, companies can now hold suppliers accountable by making decarbonization a formal part of the purchasing process.
Adding Emissions Requirements to Supplier Contracts
Incorporating measurable emissions standards into supplier contracts is a powerful way to drive accountability. For instance, suppliers can be required to report their annual Carbon Intensity Indicator (CII) ratings and outline a clear plan for transitioning to alternative fuels. Contract renewals can then be tied to achieving specific improvement benchmarks [16]. Additionally, requesting a Clean Cargo Working Group (CCWG) emissions factor table from suppliers allows for standardized and transparent comparisons [16].
A real-world example of this approach is the University of Edinburgh's "Edinburgh Pathway", launched in November 2025 under the leadership of Siôn Wheatley and Iwona Cameron. This initiative focuses on engaging suppliers responsible for the majority of emissions, with a targeted annual spend of $455–$585 million (converted from £350–450 million). Initially, it aims to cover suppliers contributing to the top 60% of emissions, with plans to expand to 85% by 2030 [15].
"The Edinburgh Pathway is a structured approach that helps both suppliers and buyers build a collaborative, fair, sustainable supply chain." - Siôn, Department for Social Responsibility and Sustainability, University of Edinburgh [15]
To make procurement decisions more data-driven, supplier scorecards translate these emissions requirements into actionable metrics.
Using Supplier Scorecards to Guide Purchasing Decisions
Supplier scorecards are an effective way to evaluate providers on more than just cost and delivery times. Key metrics to request from carriers include fleet-average CII ratings, grams of CO₂ per TEU-kilometer, and the percentage of voyages powered by sustainable fuels [16].
When scoring responses to Requests for Proposals (RFPs), it's recommended to assign a formal weight to carbon performance. Industry norms suggest allocating 10–20% of the total evaluation score to sustainability, alongside cost (typically 50%) and service quality (typically 30%) [16]. As procurement programs evolve, the weight given to sustainability metrics can gradually increase.
Evaluation Category | Typical Weight | Key Metrics |
|---|---|---|
Total Cost & Commercial Terms | 50% | Freight rates, bunker surcharges, terminal fees |
Service & Operational Quality | 30% | Schedule reliability, transit time, port coverage |
Carbon & Sustainability Performance | 20% | Fleet CII rating (A–E), alternative fuel roadmap, data verification |
Another strategic tool is shadow carbon pricing, where a hypothetical cost of $50–$100 per ton of CO₂ is factored into total cost calculations. This approach can make low-emission carriers appear more financially competitive, even if their base rates are higher, which strengthens the business case for choosing greener options [16].
"A carrier's CII rating is their efficiency report card, but their alternative fuel roadmap is their transcript for the future. Procurement must evaluate both to understand the full picture of decarbonization commitment." - Mark White, Ocean & Air Freight Specialist [16]
Tracking Progress and Improving Over Time
Once decarbonization is integrated into procurement practices, the focus shifts to consistent performance tracking. Embedding decarbonization into contracts is just the beginning; verifying that these measures produce tangible results is the next step. This involves selecting clear metrics, reviewing them regularly, and adjusting strategies as needed when performance falls short.
Key Performance Indicators for Maritime Decarbonization
To effectively monitor progress, focus on metrics tied to emissions intensity rather than total emissions volume. This approach accounts for fluctuations in shipment quantities caused by varying research cycles and academic schedules.
One key metric is the Carbon Intensity Indicator (CII), which measures emissions in grams of CO₂ per cargo-carrying capacity per nautical mile, offering a clear view of carrier efficiency. Pair this with the Energy Efficiency Operational Indicator (EEOI), which tracks CO₂ emissions relative to transport work, for a comprehensive assessment of carrier performance over time. When evaluating new contracts, institutions can also use the Energy Efficiency Design Index (EEDI) to gauge how efficiently a vessel was designed.
Additional metrics like fuel oil consumption (FOC) along major shipping routes and port dwell times - an indicator of idling emissions - are crucial. Reducing port waiting times through just-in-time (JIT) navigation can significantly cut fuel consumption. These metrics provide actionable insights for improving supplier negotiations and refining operational strategies, driving measurable progress in maritime decarbonization.
Setting Up Review and Reporting Processes
Regular reviews are critical for maintaining momentum in decarbonization efforts. Many research institutions adopt an eight-month phased approach: creating a detailed emissions inventory, modeling reduction scenarios, and engaging stakeholders. This iterative process ensures that sustainability goals remain on track and strategies are updated as needed.
Automating data collection through digital dashboards can streamline reporting, offering real-time emissions updates to students, faculty, and administrators. However, data availability remains a challenge - around 70% of organizations cite supplier data limitations as the biggest hurdle in accurately measuring Scope 3 emissions [9].
Review Component | Tools/Methods | Key Metric |
|---|---|---|
Emissions Tracking | AIS Data, UAV Monitoring, PEMS [3] | Carbon Intensity Indicator (CII) [3] |
Performance Modeling | Machine Learning, Digital Twins [3] | Energy Efficiency Design Index (EEDI) [3] |
Financial Refinement | Internal Carbon Fees, Green Revolving Funds [1] | Net Present Value (NPV) of savings [1] |
Institutional Reporting | Open Dashboards, GHG Protocol [1] | % Reduction without offsets [1] |
One effective strategy is implementing an internal carbon fee, which charges high-emission activities to fund efficiency projects. For example, charging $25 per ton of CO₂ for high-emission shipments - such as urgent research freight - can generate significant revenue. A public research university with 35,000 students used this method to collect $1.2 million annually, reinvesting the funds into efficiency projects. This approach helped the university accelerate its carbon neutrality goal from 2040 to 2035 [1]. Additionally, capping carbon offsets at 10% or less of baseline emissions ensures that institutions focus on real operational improvements rather than relying on purchased credits [1].
"At BSM, we see Emissions Connect... as crucial for providing accurate and verified emissions data, which is the necessary 'common ground' for discussions and negotiations." - Alexander Senteris, Compliance Manager, BSM [17]
Decarbonizing Research Logistics
Research logistics often operate under intense time constraints. Whether it’s temperature-sensitive biological samples, delicate oceanographic instruments, or reagents critical to experiments, the need for speed can overshadow efforts to reduce emissions. However, "urgent" doesn't have to translate to "inefficient."
Managing Urgent and Specialized Shipments
One way to address emissions is by improving vessel scheduling before ships even leave port. Traditional queuing systems require vessels to rush to a berth and then idle while waiting for their turn, wasting both time and fuel. Digital queueing systems solve this by assigning berthing slots based on departure times rather than arrival order.
Take the example of the Pacific Maritime Management Systems (PacMMS). In 2021, this partnership introduced an electronic reservation-based queueing system at the Ports of Los Angeles and Long Beach. According to researchers at UC Santa Barbara, this system reduced CO₂ emissions per trip by 16–24% by eliminating the need for ships to race to port [18].
"Without needing to 'hurry up and wait' to secure their spot in line, ships are saving fuel by traveling at slower, more efficient speeds. Just like how your car gets much better gas mileage when you drive 65 mph instead of 85 mph." - Douglas McCauley, Director, Benioff Ocean Science Laboratory [18]
Even small adjustments in speed can make a big difference. For example, reducing a vessel's speed from 18 to 17 knots can lower CO₂ emissions by about 9%. More significant slow steaming practices, with reductions between 10–40%, can cut fuel use by as much as 40% [18][19].
For more complex, multi-leg research shipments, tools like VesselBot utilize digital twins, satellite data, and AI to track emissions at the voyage level across different modes of transport [9]. When it comes to urgent air freight, IATA CO2 Connect for Cargo provides precise, audit-ready emissions data based on actual fuel usage and aircraft-specific load factors, avoiding the inaccuracies of industry averages, which can overestimate emissions by up to 2.3× [9][21].
To make lasting progress, these operational changes need to be paired with procurement strategies that align carrier selection with sustainability goals.
Tailoring Procurement Policies for Research Operations
The unique demands of research logistics require procurement policies that balance urgency with environmental responsibility. Standard procurement templates often fall short, as they don’t account for specialized needs like temperature-sensitive cargo or the consequences of delayed shipments. Instead of exempting research operations from sustainability goals, policies should be adapted to address both operational and environmental priorities.
One way to achieve this is by updating Request for Proposal (RFP) templates. These should include mandatory fields for carrier Carbon Intensity Indicator (CII) ratings, verified emissions data, and plans for transitioning to alternative fuels. Preference can be given to carriers with "A" or "B" CII ratings, while those rated "D" or "E" should be required to submit corrective action plans. For specialized routes, it’s better to benchmark efficiency using voyage-level data rather than relying on fleet-wide averages [20].
Another strategy is to integrate a shadow carbon price - typically $50–$100 per ton of CO₂ - into financial models. This approach allows institutions to justify choosing lower-emission carriers, even if their upfront freight rates are slightly higher. By shifting to a Total Cost of Ownership (TCO) model, organizations can account for future regulatory costs, such as those tied to the EU Emissions Trading System (ETS). The table below highlights how carrier efficiency impacts ETS-related costs on an Asia–Europe shipping lane:
Carrier Profile | Est. CO₂/TEU | Projected EUA Cost (€85/ton) | ETS Surcharge Estimate |
|---|---|---|---|
High-Efficiency (CII A) | 650 kg | €55.25 | €60–€70 |
Industry Average (CII C) | 850 kg | €72.25 | €80–€95 |
Low-Efficiency (CII E) | 1,100 kg | €93.50 | €100–€120 |
Note: EUA = EU Emission Allowance. Costs are illustrative [16]. |
For institutions with recurring research routes, securing longer-term contracts on specific lanes can encourage carriers to deploy their most efficient vessels - or even alternative fuels - on those routes. Known as a green corridor commitment, this strategy works well alongside book-and-claim insetting mechanisms. These mechanisms allow organizations to financially support sustainable marine fuel use, even if the fuel isn’t used on the specific vessel carrying their cargo [16].
Conclusion: Next Steps for Maritime Decarbonization
Maritime decarbonization is a step-by-step journey that gains traction as efforts progress. Universities and research institutions don't need to overhaul everything immediately. Start by analyzing your emissions baseline using current data to pinpoint the areas with the most significant impact. Then, focus on changes that yield measurable results.
From there, consider streamlining logistics, revising procurement policies, and transitioning to lower-emission carriers and fuels. Simple measures like slow steaming - reducing vessel speed by 20% - can cut CO₂ emissions by 32–40% [4]. These early wins build momentum while more complex shifts, such as adopting alternative fuels, are phased in. Additionally, forming strategic partnerships can significantly accelerate progress.
For example, in May 2024, the University of Michigan partnered with the Mærsk Mc-Kinney Møller Center for Zero Carbon Shipping. This collaboration aims to fast-track the maritime industry's transition to zero-carbon operations by 2050 through applied research.
"A partnership with a renowned academic institution like University of Michigan is extremely valuable to the decarbonization of the maritime industry." - Bo Cerup-Simonsen, CEO, Mærsk Mc-Kinney Møller Center for Zero Carbon Shipping [23]
These initiatives not only enhance operational efficiency but also align with global targets like the 2023 IMO GHG Strategy, which aims for net-zero emissions by or around 2050 and interim reductions of 20–30% by 2030 [22]. Without action, maritime emissions could account for 10% of global greenhouse gas emissions by 2050 [24]. For universities and research institutions, taking early action positions them ahead of stricter regulations and rising carbon costs, while also reinforcing their sustainability commitments - an expectation shared by students, faculty, and funders. Beyond reducing emissions, these efforts solidify leadership in sustainability.
FAQs
What data do we need to measure our shipping emissions?
To estimate shipping emissions, you need to multiply Activity Data by an Emission Factor. The precision of your calculation hinges on the quality of the data you use, which can range from detailed vessel-specific information to broader industry averages.
At the very least, ensure you gather the following details:
Cargo weight (in tons)
Distance the shipment traveled
Information about the vessel or carrier
For more accurate results, consider using the Annual Efficiency Ratio (AER), which provides CO2 emissions per tonne-nautical mile. If this isn't feasible, include secondary data as estimates in your reports to maintain transparency.
How can we cut maritime emissions without slowing research?
To address maritime emissions while preserving research effectiveness, institutions can prioritize operational efficiency and cutting-edge technology. Practical measures include adopting Just-In-Time (JIT) arrivals to cut down on fuel consumption and performing regular hull maintenance to maintain optimal performance. Additionally, hybrid propulsion systems, such as hydrogen-powered or battery-assisted designs, allow vessels to meet mission requirements while reducing emissions. These strategies help align maritime activities with environmental goals without hindering research capabilities.
What should we require from carriers in our contracts?
When working with carriers, it’s essential to prioritize those that offer verified emissions data and demonstrate robust efficiency initiatives. Concentrate these requirements on partners managing the majority of your shipping spend - ideally around 75% to 80%. To streamline benchmarking efforts, consider requiring alignment with recognized frameworks such as the EPA’s SmartWay program. This approach promotes transparency and ensures your supply chain supports broader decarbonization objectives.
Related Blog Posts
How to Build a Corporate Sustainability Strategy Aligned to ROI for Maritime & Logistics Companies
How to Develop a Blue Economy Strategy for Maritime & Logistics Companies
How to Decarbonize Maritime Operations and Supply Chains for Corporations
How to Decarbonize Maritime Operations and Supply Chains for NGOs & Nonprofits
Latest Articles
©2026
Narrative Change and Power Building: The Missing Half of Advocacy
Narrative change is the process of disrupting dominant narratives that normalize inequity and advancing new narratives from historically marginalized communities.
Funding Resilience Without Federal Grants
BRIC is unreliable and FEMA is shrinking. Here's how cities fund climate resilience with dedicated revenue, blended finance, and a coordinating authority.
The ESG Blind Spot: How AI Is Finding Risks in Companies Nobody Else Is Watching
Norway's sovereign wealth fund uses AI to screen 7,200 portfolio companies for forced labor and corruption within 24 hours. The real story is the emerging-market coverage gap that traditional ESG data vendors miss — and what it means for any company with a global supply chain.
FAQ
What does it really mean to “redefine profit”?
What makes Council Fire different?
Who does Council Fire work with?
What does working with Council Fire actually look like?
How does Council Fire help organizations turn big goals into action?
How does Council Fire define and measure success?
How does technology fit into Council Fire’s work?