
Apr 18, 2026
How to Use Data to Inform Climate and Housing Policy for NGOs & Nonprofits
Sustainability Strategy
In This Article
Guidance for nonprofits on combining localized climate and housing data to craft equitable resilience, retrofit, and anti-displacement policies.
How to Use Data to Inform Climate and Housing Policy for NGOs & Nonprofits
Data is your most powerful tool for driving climate and housing policy change. Here's how nonprofits can use it to tackle affordability and climate risks:
The Problem: Nearly 20 million U.S. homeowners face housing costs they can’t afford, while climate risks disproportionately affect low-income communities. Federal data often misses these groups, leaving them out of key decisions.
The Solution: Combining localized climate and housing data helps identify overlooked vulnerabilities, strengthen advocacy efforts, and create targeted policies.
Key Tools: Use resources like the Climate Mapping for Resilience and Adaptation (CMRA), HUD Data Catalog, and U.S. Climate Vulnerability Index (CVI) to analyze risks and housing needs.
Actionable Policies: Focus on updating building codes, creating disaster-resistant housing, and aligning housing reforms with emissions reduction goals.
Climate Action in Practice: How Data, AI, and Advocacy Are Reshaping Policy
Finding Data Sources for Climate Risks and Housing Needs
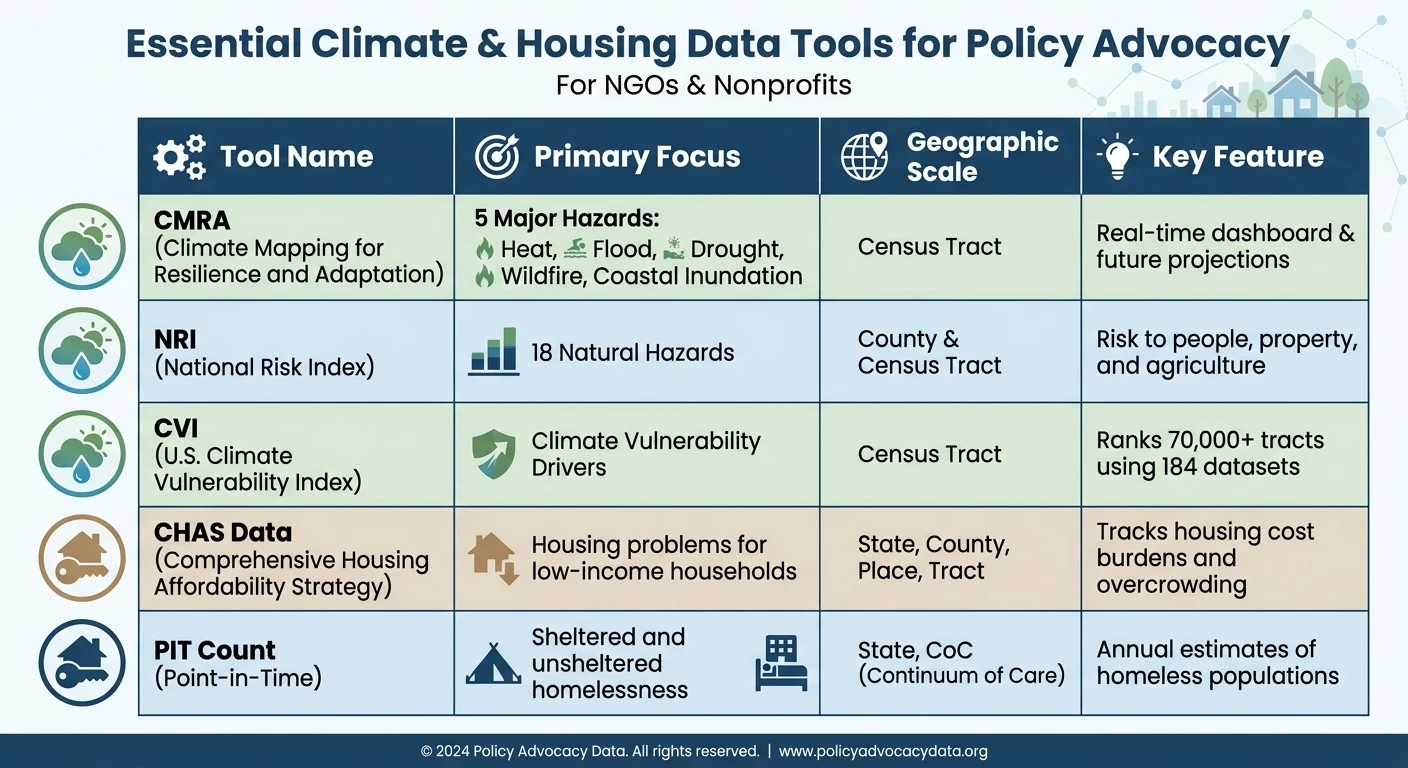
Climate and Housing Data Tools Comparison for NGOs
Accessing reliable, localized data is critical for understanding climate risks and housing challenges. Census tract-level insights reveal disparities often hidden by broader county-wide averages, and several U.S. government tools provide detailed, accessible information to help address these issues.
One key resource is the Climate Mapping for Resilience and Adaptation (CMRA) tool, developed through a collaboration involving NOAA, NASA, USGS, the Department of Energy, and the White House [5][7]. This platform focuses on five major hazards - extreme heat, drought, wildfire, flooding, and coastal inundation. It offers a real-time dashboard for current threats and a forecasting tool to assess risks across three future timeframes [5]. As the U.S. Climate Resilience Toolkit emphasizes:
"Knowing what hazards your assets might face is the first step in protecting them" [5].
For coastal communities, the Sea Level Rise Viewer provides visualizations of flood exposure and inundation scenarios [7], while the Wildfire Risk to Communities tool supports fire-prone regions in identifying and managing their vulnerabilities [8][9].
The National Risk Index (NRI), now part of FEMA's Resilience Analysis & Planning Tool (RAPT), evaluates risks from 18 natural hazards, including extreme cold and severe winter weather, down to the census tract level [6]. Communities can use this data to improve emergency plans, refine hazard mitigation strategies, and inform homeowners about local risks like flooding or extreme heat [5][6]. Additionally, the U.S. Climate Vulnerability Index (CVI) ranks over 70,000 census tracts using 184 datasets, helping pinpoint the specific factors driving climate vulnerability in targeted areas [10].
Using Climate Data Tools
Federal climate tools not only provide critical insights but also help identify communities eligible for funding under Justice40 criteria. For example, the CMRA Assessment Tool highlights census tracts and tribal lands meeting disadvantaged community standards [7]. Meanwhile, the CVI, developed with input from environmental justice leaders and published in Environment International, offers consistent and reliable indicators across the country [15].
To create a more comprehensive analysis, it's essential to pair climate data with detailed housing datasets.
Finding Housing Data
The HUD Data Catalog is a valuable resource, offering over 220 datasets covering public housing, community development, fair housing, and economic trends [12]. For a closer look at housing challenges, the CHAS dataset tracks housing cost burdens and overcrowding for low-income households at multiple geographic levels, including state, county, and census tracts [12]. CHAS also identifies how many households earning 30%, 50%, or 80% of the median income face housing issues [12].
HUD also provides annual estimates of Fair Market Rents (FMRs) for 530 metropolitan and 2,045 nonmetropolitan areas, useful for determining program eligibility and setting rent ceilings for housing assistance initiatives [12]. For homelessness data, the Point-in-Time (PIT) counts and Housing Inventory Count (HIC) reports offer snapshots of homeless populations and available housing inventory within Continuums of Care [11]. Additionally, the Building Permits Survey (BPS) delivers statistics on residential development at national, state, and local levels [13].
The American Community Survey (ACS) from the U.S. Census Bureau provides 5-year estimates on housing tenure, vacancy rates, and utility costs. These insights are essential for understanding workforce housing needs and demographic changes [13][14]. Combining tools like CMRA and CVI with housing data enables a clearer picture of where affordable, climate-resilient housing is most urgently needed.
Summary of Tools
The table below compares the focus, scale, and key features of these tools for easy reference:
Tool | Primary Focus | Geographic Scale | Key Feature |
|---|---|---|---|
CMRA | 5 Major Hazards (Heat, Flood, etc.) | Census Tract | |
NRI | 18 Natural Hazards | County & Census Tract | Risk to people, property, and agriculture [6] |
CVI | Climate Vulnerability Drivers | Census Tract | Ranks 70,000+ tracts using 184 datasets [10] |
CHAS Data | Housing problems for low-income households | State, County, Place, Tract | Tracks housing cost burdens and overcrowding [12] |
PIT Count | Sheltered and unsheltered homelessness | State, CoC | Annual estimates of homeless populations [11] |
Analyzing Data with Systems Thinking
Once climate and housing data are collected, the challenge lies in uncovering how they intersect. Traditional methods often examine risks in silos, but systems thinking digs deeper to reveal their connections. For instance, a census tract with high flood risk may also show increased eviction filings and utility shutoffs, signaling how rising climate-related costs contribute to resident displacement [4]. These connections, while theoretical, are backed by recent case studies.
Integrating diverse datasets - such as housing records with flood maps or heat indices - can uncover patterns that isolated analyses might miss. This approach highlights hidden interdependencies and provides a fuller picture of the challenges at hand [4].
In June 2024, researchers Amalie Zinn, Linna Zhu, Laurie Goodman, and Michael Neal from the Urban Institute demonstrated this by combining Verisk's probabilistic climate data with social vulnerability metrics. They shifted from FEMA's expected annual loss (EAL) methodology to a total replacement value approach, which revealed that low-to-moderate income (LMI) neighborhoods of color faced the greatest risks of riverine flooding - risks that FEMA's traditional data had obscured [1]. As the researchers explained:
"How we measure risk matters... FEMA's reliance on expected annual loss to measure the toll of a flood biases risk toward wealthier areas with more to lose financially" [1].
This kind of analysis is crucial because FEMA's methods often underrepresent the realities of vulnerable communities. By using proprietary probabilistic data, researchers were able to address nearly 90% of these gaps [1].
A similar approach has been applied in Cleveland to tackle environmental and housing challenges. In 2023, the Western Reserve Land Conservancy partnered with the city to conduct a property inventory. A team of 30 surveyors used a mobile app to grade properties on an A–F scale, combining visual inspections with utilities data from Case Western Reserve University's NEOCANDO database. This effort allowed the city to identify areas with lead paint risks and focus rehabilitation efforts on neighborhoods where poor housing quality overlapped with environmental hazards [4].
Adding a human element to the data strengthens these analyses further. Training residents as community scientists offers qualitative insights that complement numerical data [3]. For example, in Tucson, Arizona, the Sonora Environmental Research Institute is studying how rising temperatures in the Sonoran Desert impact housing. These findings help direct resources to the most vulnerable households [2]. By factoring in race and income when analyzing survey responses, NGOs ensure their efforts accurately represent the communities most in need [4].
Creating Policy Recommendations from Data
Using data-driven insights into climate and housing vulnerabilities, actionable policies can be crafted to address these pressing challenges. A balanced approach is key - policies must integrate both mitigation (reducing greenhouse gas emissions through measures like energy efficiency and green building standards) and adaptation (minimizing harm with strategies like weather-resistant designs and updated building codes). This dual focus is essential, as buildings significantly contribute to emissions, while millions of homes face increasing disaster risks. Importantly, these policies should also safeguard against rising housing costs and displacement, ensuring equitable outcomes.
For example, low-income households spend over 13% of their income on energy - nearly five times more than other households [19]. Any policy that increases construction or utility costs must include financial support, such as subsidies or innovative financing options. Aligning these efforts with the Justice40 Initiative, which ensures that 40% of federal climate and housing investments benefit disadvantaged communities [17], ensures equity remains central to these strategies.
Recommending Climate-Resilient Housing Solutions
A critical starting point for climate-resilient housing policies is updating building codes. These should mandate features like on-site solar storage, ember-proof roofing, and elevated structures in flood-prone areas [17]. Moving beyond voluntary guidelines to enforceable standards prevents cost-cutting measures that could compromise safety [18].
Established frameworks like FORTIFIED standards and Enterprise Green Communities Criteria offer proven methods to reduce weather-related losses while promoting affordable, healthy housing [17][18]. Citing such examples can lend credibility to policy recommendations and help overcome hesitation often caused by a lack of precedent [18].
Additionally, land banks and Community Land Trusts (CLTs) play a vital role in reinvesting in vacant properties while preserving affordability. For instance, the Michigan State Land Bank Authority manages over 4,500 properties and is exploring solar power development on contaminated sites. This approach not only stabilizes property values but also delivers sustainable energy solutions [17]. By leveraging data on property values and elevation, policies can direct affordable housing efforts to less vulnerable areas, avoiding displacement in communities meant to benefit from climate adaptation.
These housing-focused strategies should be complemented by broader urban planning efforts to address emissions reduction.
Aligning Housing Policy with Emissions Reduction
Reducing emissions involves rethinking both how homes are constructed and where they are located. Data supports key zoning reforms, such as encouraging denser, multifamily housing, transit-oriented development (TOD), and removing parking requirements to curb urban sprawl and lower emissions [19]. TOD, which places housing near jobs and essential services, not only cuts emissions but also improves access to opportunities.
For instance, New York City has mandated electrification for all new buildings, finding that all-electric homes are often less costly to build than mixed-fuel alternatives [19]. Similarly, Washington, D.C.'s "Green New Deal for Housing Amendment Act" aims to create net-zero, transit-oriented social housing using sustainable construction techniques [19]. These examples highlight how emissions reduction can align with affordability goals.
California is also taking steps by launching a centralized affordable housing delivery system on July 1, 2026 [16]. This initiative aims to streamline financing and accelerate innovative construction methods. Advocating for similar centralized models in other states could help reduce both development timelines and costs.
Finally, retrofit programs - such as grants or low-cost loans - can empower low-income homeowners and affordable rental housing providers to make climate upgrades without triggering displacement or rent increases. Improvements like better insulation, cooling systems, and air filtration can enhance living conditions while addressing climate challenges. As Dana Bourland, Senior Vice President of Environment and Strategic Initiatives at The JPB Foundation, eloquently puts it:
"To solve the housing crisis, we must simultaneously solve the climate crisis, and do both in ways that prioritize those who have had the least to do with creating either." [17]
This principle should guide every data-informed policy recommendation, ensuring that solutions address both climate and housing challenges while prioritizing equity.
Case Studies: Data-Driven Policy Examples and Council Fire's Work
Examples of Data-Driven Policy in Practice
Real-world examples highlight how NGOs and nonprofits turn data into impactful policies. In February 2026, a Mid-Atlantic coastal city with a population of 28,000 leveraged NOAA sea-level data and LOCA2 precipitation models to identify $4.2 billion worth of flood-vulnerable property. This analysis guided updates to floodplain and housing regulations, including raising the required freeboard from 1 foot to 3 feet and restricting the construction of critical facilities in 500-year floodplains. The city also secured $14.7 million in federal and state grants, achieving a benefit-cost ratio of 4.2:1, and initiated a voluntary buyout program for 23 properties with repetitive flood losses [20].
In another case, a regional healthcare system operating 12 hospitals mapped patient ZIP codes against heat exposure data across 57 facilities. This revealed four areas where climate risks overlapped with chronic health challenges. The findings drove a $180 million resilience investment plan, which helped limit insurance premium increases to 8%, far less than the projected 22% [23].
Meanwhile, a Caribbean island nation with 95,000 residents used drone-based LiDAR and hydrological modeling to create a National Adaptation Plan. These efforts secured a $45 million allocation from the Green Climate Fund and a $28 million debt-for-nature swap, which funded mangrove restoration and solar desalination projects [21].
These examples underscore how systematic data analysis can lead to transformative policies and investments, paving the way for Council Fire's expertise in turning insights into actionable strategies.
How Council Fire Supports Data-Driven Solutions
Council Fire builds on these successes by helping organizations implement large-scale, data-driven initiatives. Their work demonstrates how technical analysis and practical execution come together to unlock meaningful investments.
For example, Council Fire supported a regional climate compact of 35 organizations - including 14 municipalities and 12 businesses - spanning three counties. This collaboration unlocked $280 million in climate-related investments. A key outcome was the launch of a clean energy procurement program aggregating 420 GWh of demand, which saved participants $12 million annually and secured renewable energy pricing 18% below retail rates [22].
Council Fire’s methodology blends advanced data analytics with hands-on implementation. Their services include climate resilience planning, using tools like the CDC Social Vulnerability Index and LOCA2 precipitation data, as well as stakeholder engagement strategies that foster trust among diverse coalitions. Additionally, they provide grant-readiness support, aligning vulnerability assessments with federal funding requirements from the outset. This ensures that nonprofits move beyond simply gathering data - they turn it into actionable policies that deliver enduring environmental, social, and economic benefits.
Conclusion
Effective climate and housing policies hinge on using rigorous data analysis, systems thinking, and meaningful stakeholder engagement. By combining climate-specific insights with localized housing data, policymakers can identify vulnerable communities often overlooked by traditional metrics. As Dana Bourland from The JPB Foundation aptly states:
"To solve the housing crisis, we must simultaneously solve the climate crisis, and do both in ways that prioritize those who have had the least to do with creating either" [17].
Outdated data collection methods often fail to capture the realities faced by marginalized populations [1]. This highlights the need for nonprofits to adopt frameworks that address climate mitigation, adaptation, and remediation in tandem, shifting the focus from short-term fixes to sustainable, long-term solutions.
Community-led data collection plays a critical role in shaping impactful policies. When residents contribute as co-researchers, their lived experiences illuminate hyper-local risks that aggregated datasets often miss. Combining this grassroots perspective with technical analysis creates a strong foundation for policies that deliver measurable benefits across environmental, social, and economic dimensions.
Breaking down data silos is equally important. Cross-agency collaboration and ethical data-sharing agreements ensure that housing, environmental, and public health insights inform each other rather than existing in isolation. The most effective interventions - whether addressing coastal flood risks or building green affordable housing - blend quantitative data with qualitative insights to inform evidence-based advocacy strategies [4].
As seen in the case studies discussed, Council Fire’s method of translating data into actionable policies demonstrates how organizations can foster lasting resilience. For nonprofits, data should be viewed as a powerful tool to create equitable, climate-resilient communities. By leveraging these insights, they can confidently implement strategies that drive meaningful and lasting change.
FAQs
Which datasets should we combine first for our community?
To address housing challenges effectively, begin by merging datasets that cover local housing conditions, affordability metrics, and risks of displacement. Key data sources include resident surveys, property and parcel records, and demographic details, which together provide a clearer picture of community housing needs. Adding climate impact data is equally important, as the effects of climate change often worsen housing instability and increase displacement risks. This integrated approach highlights areas with aging housing stock, affordability issues, and heightened instability, offering a roadmap for targeted resilience planning.
How do we choose the right geographic level for analysis?
When deciding on a geographic level for analysis, align it with your project’s objectives and the specific dynamics of the community. A local or neighborhood-level focus can offer precise insights into issues like land use, vulnerabilities, and community needs. On the other hand, a regional or city-wide perspective is better suited for identifying overarching trends and disparities. The choice ultimately hinges on the policy questions you're addressing, the data at your disposal, and the level of detail you aim to achieve. In many cases, localized data proves especially useful for crafting effective solutions in areas experiencing diversity or rapid change.
How can we use data without increasing displacement risk?
Using data to tackle displacement risk means pinpointing neighborhoods facing pressures like rising housing costs or other challenges and directing support where it’s needed most. This approach enables policymakers to allocate resources more effectively, back decisions with solid evidence, and track the outcomes of anti-displacement measures. By focusing on areas at the highest risk, data-driven strategies aim to improve housing stability while reducing the chances of resident displacement.
Related Blog Posts
How to Embed Equity in Local Resilience Planning for Municipalities & Government Agencies
How to Embed Equity in Local Resilience Planning for NGOs & Nonprofits
How to Use Data to Inform Climate and Housing Policy for Municipalities & Government Agencies
How to Use Data to Inform Climate and Housing Policy for Corporations
Latest Articles
©2026

Narrative Change and Power Building: The Missing Half of Advocacy
Narrative change is the process of disrupting dominant narratives that normalize inequity and advancing new narratives from historically marginalized communities.

Funding Resilience Without Federal Grants
BRIC is unreliable and FEMA is shrinking. Here's how cities fund climate resilience with dedicated revenue, blended finance, and a coordinating authority.

The ESG Blind Spot: How AI Is Finding Risks in Companies Nobody Else Is Watching
Norway's sovereign wealth fund uses AI to screen 7,200 portfolio companies for forced labor and corruption within 24 hours. The real story is the emerging-market coverage gap that traditional ESG data vendors miss — and what it means for any company with a global supply chain.
Narrative Change and Power Building: The Missing Half of Advocacy
Narrative change is the process of disrupting dominant narratives that normalize inequity and advancing new narratives from historically marginalized communities.
Funding Resilience Without Federal Grants
BRIC is unreliable and FEMA is shrinking. Here's how cities fund climate resilience with dedicated revenue, blended finance, and a coordinating authority.
The ESG Blind Spot: How AI Is Finding Risks in Companies Nobody Else Is Watching
Norway's sovereign wealth fund uses AI to screen 7,200 portfolio companies for forced labor and corruption within 24 hours. The real story is the emerging-market coverage gap that traditional ESG data vendors miss — and what it means for any company with a global supply chain.
FAQ
01
What does it really mean to “redefine profit”?
02
What makes Council Fire different?
03
Who does Council Fire work with?
04
What does working with Council Fire actually look like?
05
How does Council Fire help organizations turn big goals into action?
06
How does Council Fire define and measure success?
07
How does technology fit into Council Fire’s work?
Apr 18, 2026
How to Use Data to Inform Climate and Housing Policy for NGOs & Nonprofits
Sustainability Strategy
In This Article
Guidance for nonprofits on combining localized climate and housing data to craft equitable resilience, retrofit, and anti-displacement policies.
How to Use Data to Inform Climate and Housing Policy for NGOs & Nonprofits
Data is your most powerful tool for driving climate and housing policy change. Here's how nonprofits can use it to tackle affordability and climate risks:
The Problem: Nearly 20 million U.S. homeowners face housing costs they can’t afford, while climate risks disproportionately affect low-income communities. Federal data often misses these groups, leaving them out of key decisions.
The Solution: Combining localized climate and housing data helps identify overlooked vulnerabilities, strengthen advocacy efforts, and create targeted policies.
Key Tools: Use resources like the Climate Mapping for Resilience and Adaptation (CMRA), HUD Data Catalog, and U.S. Climate Vulnerability Index (CVI) to analyze risks and housing needs.
Actionable Policies: Focus on updating building codes, creating disaster-resistant housing, and aligning housing reforms with emissions reduction goals.
Climate Action in Practice: How Data, AI, and Advocacy Are Reshaping Policy
Finding Data Sources for Climate Risks and Housing Needs
Climate and Housing Data Tools Comparison for NGOs
Accessing reliable, localized data is critical for understanding climate risks and housing challenges. Census tract-level insights reveal disparities often hidden by broader county-wide averages, and several U.S. government tools provide detailed, accessible information to help address these issues.
One key resource is the Climate Mapping for Resilience and Adaptation (CMRA) tool, developed through a collaboration involving NOAA, NASA, USGS, the Department of Energy, and the White House [5][7]. This platform focuses on five major hazards - extreme heat, drought, wildfire, flooding, and coastal inundation. It offers a real-time dashboard for current threats and a forecasting tool to assess risks across three future timeframes [5]. As the U.S. Climate Resilience Toolkit emphasizes:
"Knowing what hazards your assets might face is the first step in protecting them" [5].
For coastal communities, the Sea Level Rise Viewer provides visualizations of flood exposure and inundation scenarios [7], while the Wildfire Risk to Communities tool supports fire-prone regions in identifying and managing their vulnerabilities [8][9].
The National Risk Index (NRI), now part of FEMA's Resilience Analysis & Planning Tool (RAPT), evaluates risks from 18 natural hazards, including extreme cold and severe winter weather, down to the census tract level [6]. Communities can use this data to improve emergency plans, refine hazard mitigation strategies, and inform homeowners about local risks like flooding or extreme heat [5][6]. Additionally, the U.S. Climate Vulnerability Index (CVI) ranks over 70,000 census tracts using 184 datasets, helping pinpoint the specific factors driving climate vulnerability in targeted areas [10].
Using Climate Data Tools
Federal climate tools not only provide critical insights but also help identify communities eligible for funding under Justice40 criteria. For example, the CMRA Assessment Tool highlights census tracts and tribal lands meeting disadvantaged community standards [7]. Meanwhile, the CVI, developed with input from environmental justice leaders and published in Environment International, offers consistent and reliable indicators across the country [15].
To create a more comprehensive analysis, it's essential to pair climate data with detailed housing datasets.
Finding Housing Data
The HUD Data Catalog is a valuable resource, offering over 220 datasets covering public housing, community development, fair housing, and economic trends [12]. For a closer look at housing challenges, the CHAS dataset tracks housing cost burdens and overcrowding for low-income households at multiple geographic levels, including state, county, and census tracts [12]. CHAS also identifies how many households earning 30%, 50%, or 80% of the median income face housing issues [12].
HUD also provides annual estimates of Fair Market Rents (FMRs) for 530 metropolitan and 2,045 nonmetropolitan areas, useful for determining program eligibility and setting rent ceilings for housing assistance initiatives [12]. For homelessness data, the Point-in-Time (PIT) counts and Housing Inventory Count (HIC) reports offer snapshots of homeless populations and available housing inventory within Continuums of Care [11]. Additionally, the Building Permits Survey (BPS) delivers statistics on residential development at national, state, and local levels [13].
The American Community Survey (ACS) from the U.S. Census Bureau provides 5-year estimates on housing tenure, vacancy rates, and utility costs. These insights are essential for understanding workforce housing needs and demographic changes [13][14]. Combining tools like CMRA and CVI with housing data enables a clearer picture of where affordable, climate-resilient housing is most urgently needed.
Summary of Tools
The table below compares the focus, scale, and key features of these tools for easy reference:
Tool | Primary Focus | Geographic Scale | Key Feature |
|---|---|---|---|
CMRA | 5 Major Hazards (Heat, Flood, etc.) | Census Tract | |
NRI | 18 Natural Hazards | County & Census Tract | Risk to people, property, and agriculture [6] |
CVI | Climate Vulnerability Drivers | Census Tract | Ranks 70,000+ tracts using 184 datasets [10] |
CHAS Data | Housing problems for low-income households | State, County, Place, Tract | Tracks housing cost burdens and overcrowding [12] |
PIT Count | Sheltered and unsheltered homelessness | State, CoC | Annual estimates of homeless populations [11] |
Analyzing Data with Systems Thinking
Once climate and housing data are collected, the challenge lies in uncovering how they intersect. Traditional methods often examine risks in silos, but systems thinking digs deeper to reveal their connections. For instance, a census tract with high flood risk may also show increased eviction filings and utility shutoffs, signaling how rising climate-related costs contribute to resident displacement [4]. These connections, while theoretical, are backed by recent case studies.
Integrating diverse datasets - such as housing records with flood maps or heat indices - can uncover patterns that isolated analyses might miss. This approach highlights hidden interdependencies and provides a fuller picture of the challenges at hand [4].
In June 2024, researchers Amalie Zinn, Linna Zhu, Laurie Goodman, and Michael Neal from the Urban Institute demonstrated this by combining Verisk's probabilistic climate data with social vulnerability metrics. They shifted from FEMA's expected annual loss (EAL) methodology to a total replacement value approach, which revealed that low-to-moderate income (LMI) neighborhoods of color faced the greatest risks of riverine flooding - risks that FEMA's traditional data had obscured [1]. As the researchers explained:
"How we measure risk matters... FEMA's reliance on expected annual loss to measure the toll of a flood biases risk toward wealthier areas with more to lose financially" [1].
This kind of analysis is crucial because FEMA's methods often underrepresent the realities of vulnerable communities. By using proprietary probabilistic data, researchers were able to address nearly 90% of these gaps [1].
A similar approach has been applied in Cleveland to tackle environmental and housing challenges. In 2023, the Western Reserve Land Conservancy partnered with the city to conduct a property inventory. A team of 30 surveyors used a mobile app to grade properties on an A–F scale, combining visual inspections with utilities data from Case Western Reserve University's NEOCANDO database. This effort allowed the city to identify areas with lead paint risks and focus rehabilitation efforts on neighborhoods where poor housing quality overlapped with environmental hazards [4].
Adding a human element to the data strengthens these analyses further. Training residents as community scientists offers qualitative insights that complement numerical data [3]. For example, in Tucson, Arizona, the Sonora Environmental Research Institute is studying how rising temperatures in the Sonoran Desert impact housing. These findings help direct resources to the most vulnerable households [2]. By factoring in race and income when analyzing survey responses, NGOs ensure their efforts accurately represent the communities most in need [4].
Creating Policy Recommendations from Data
Using data-driven insights into climate and housing vulnerabilities, actionable policies can be crafted to address these pressing challenges. A balanced approach is key - policies must integrate both mitigation (reducing greenhouse gas emissions through measures like energy efficiency and green building standards) and adaptation (minimizing harm with strategies like weather-resistant designs and updated building codes). This dual focus is essential, as buildings significantly contribute to emissions, while millions of homes face increasing disaster risks. Importantly, these policies should also safeguard against rising housing costs and displacement, ensuring equitable outcomes.
For example, low-income households spend over 13% of their income on energy - nearly five times more than other households [19]. Any policy that increases construction or utility costs must include financial support, such as subsidies or innovative financing options. Aligning these efforts with the Justice40 Initiative, which ensures that 40% of federal climate and housing investments benefit disadvantaged communities [17], ensures equity remains central to these strategies.
Recommending Climate-Resilient Housing Solutions
A critical starting point for climate-resilient housing policies is updating building codes. These should mandate features like on-site solar storage, ember-proof roofing, and elevated structures in flood-prone areas [17]. Moving beyond voluntary guidelines to enforceable standards prevents cost-cutting measures that could compromise safety [18].
Established frameworks like FORTIFIED standards and Enterprise Green Communities Criteria offer proven methods to reduce weather-related losses while promoting affordable, healthy housing [17][18]. Citing such examples can lend credibility to policy recommendations and help overcome hesitation often caused by a lack of precedent [18].
Additionally, land banks and Community Land Trusts (CLTs) play a vital role in reinvesting in vacant properties while preserving affordability. For instance, the Michigan State Land Bank Authority manages over 4,500 properties and is exploring solar power development on contaminated sites. This approach not only stabilizes property values but also delivers sustainable energy solutions [17]. By leveraging data on property values and elevation, policies can direct affordable housing efforts to less vulnerable areas, avoiding displacement in communities meant to benefit from climate adaptation.
These housing-focused strategies should be complemented by broader urban planning efforts to address emissions reduction.
Aligning Housing Policy with Emissions Reduction
Reducing emissions involves rethinking both how homes are constructed and where they are located. Data supports key zoning reforms, such as encouraging denser, multifamily housing, transit-oriented development (TOD), and removing parking requirements to curb urban sprawl and lower emissions [19]. TOD, which places housing near jobs and essential services, not only cuts emissions but also improves access to opportunities.
For instance, New York City has mandated electrification for all new buildings, finding that all-electric homes are often less costly to build than mixed-fuel alternatives [19]. Similarly, Washington, D.C.'s "Green New Deal for Housing Amendment Act" aims to create net-zero, transit-oriented social housing using sustainable construction techniques [19]. These examples highlight how emissions reduction can align with affordability goals.
California is also taking steps by launching a centralized affordable housing delivery system on July 1, 2026 [16]. This initiative aims to streamline financing and accelerate innovative construction methods. Advocating for similar centralized models in other states could help reduce both development timelines and costs.
Finally, retrofit programs - such as grants or low-cost loans - can empower low-income homeowners and affordable rental housing providers to make climate upgrades without triggering displacement or rent increases. Improvements like better insulation, cooling systems, and air filtration can enhance living conditions while addressing climate challenges. As Dana Bourland, Senior Vice President of Environment and Strategic Initiatives at The JPB Foundation, eloquently puts it:
"To solve the housing crisis, we must simultaneously solve the climate crisis, and do both in ways that prioritize those who have had the least to do with creating either." [17]
This principle should guide every data-informed policy recommendation, ensuring that solutions address both climate and housing challenges while prioritizing equity.
Case Studies: Data-Driven Policy Examples and Council Fire's Work
Examples of Data-Driven Policy in Practice
Real-world examples highlight how NGOs and nonprofits turn data into impactful policies. In February 2026, a Mid-Atlantic coastal city with a population of 28,000 leveraged NOAA sea-level data and LOCA2 precipitation models to identify $4.2 billion worth of flood-vulnerable property. This analysis guided updates to floodplain and housing regulations, including raising the required freeboard from 1 foot to 3 feet and restricting the construction of critical facilities in 500-year floodplains. The city also secured $14.7 million in federal and state grants, achieving a benefit-cost ratio of 4.2:1, and initiated a voluntary buyout program for 23 properties with repetitive flood losses [20].
In another case, a regional healthcare system operating 12 hospitals mapped patient ZIP codes against heat exposure data across 57 facilities. This revealed four areas where climate risks overlapped with chronic health challenges. The findings drove a $180 million resilience investment plan, which helped limit insurance premium increases to 8%, far less than the projected 22% [23].
Meanwhile, a Caribbean island nation with 95,000 residents used drone-based LiDAR and hydrological modeling to create a National Adaptation Plan. These efforts secured a $45 million allocation from the Green Climate Fund and a $28 million debt-for-nature swap, which funded mangrove restoration and solar desalination projects [21].
These examples underscore how systematic data analysis can lead to transformative policies and investments, paving the way for Council Fire's expertise in turning insights into actionable strategies.
How Council Fire Supports Data-Driven Solutions
Council Fire builds on these successes by helping organizations implement large-scale, data-driven initiatives. Their work demonstrates how technical analysis and practical execution come together to unlock meaningful investments.
For example, Council Fire supported a regional climate compact of 35 organizations - including 14 municipalities and 12 businesses - spanning three counties. This collaboration unlocked $280 million in climate-related investments. A key outcome was the launch of a clean energy procurement program aggregating 420 GWh of demand, which saved participants $12 million annually and secured renewable energy pricing 18% below retail rates [22].
Council Fire’s methodology blends advanced data analytics with hands-on implementation. Their services include climate resilience planning, using tools like the CDC Social Vulnerability Index and LOCA2 precipitation data, as well as stakeholder engagement strategies that foster trust among diverse coalitions. Additionally, they provide grant-readiness support, aligning vulnerability assessments with federal funding requirements from the outset. This ensures that nonprofits move beyond simply gathering data - they turn it into actionable policies that deliver enduring environmental, social, and economic benefits.
Conclusion
Effective climate and housing policies hinge on using rigorous data analysis, systems thinking, and meaningful stakeholder engagement. By combining climate-specific insights with localized housing data, policymakers can identify vulnerable communities often overlooked by traditional metrics. As Dana Bourland from The JPB Foundation aptly states:
"To solve the housing crisis, we must simultaneously solve the climate crisis, and do both in ways that prioritize those who have had the least to do with creating either" [17].
Outdated data collection methods often fail to capture the realities faced by marginalized populations [1]. This highlights the need for nonprofits to adopt frameworks that address climate mitigation, adaptation, and remediation in tandem, shifting the focus from short-term fixes to sustainable, long-term solutions.
Community-led data collection plays a critical role in shaping impactful policies. When residents contribute as co-researchers, their lived experiences illuminate hyper-local risks that aggregated datasets often miss. Combining this grassroots perspective with technical analysis creates a strong foundation for policies that deliver measurable benefits across environmental, social, and economic dimensions.
Breaking down data silos is equally important. Cross-agency collaboration and ethical data-sharing agreements ensure that housing, environmental, and public health insights inform each other rather than existing in isolation. The most effective interventions - whether addressing coastal flood risks or building green affordable housing - blend quantitative data with qualitative insights to inform evidence-based advocacy strategies [4].
As seen in the case studies discussed, Council Fire’s method of translating data into actionable policies demonstrates how organizations can foster lasting resilience. For nonprofits, data should be viewed as a powerful tool to create equitable, climate-resilient communities. By leveraging these insights, they can confidently implement strategies that drive meaningful and lasting change.
FAQs
Which datasets should we combine first for our community?
To address housing challenges effectively, begin by merging datasets that cover local housing conditions, affordability metrics, and risks of displacement. Key data sources include resident surveys, property and parcel records, and demographic details, which together provide a clearer picture of community housing needs. Adding climate impact data is equally important, as the effects of climate change often worsen housing instability and increase displacement risks. This integrated approach highlights areas with aging housing stock, affordability issues, and heightened instability, offering a roadmap for targeted resilience planning.
How do we choose the right geographic level for analysis?
When deciding on a geographic level for analysis, align it with your project’s objectives and the specific dynamics of the community. A local or neighborhood-level focus can offer precise insights into issues like land use, vulnerabilities, and community needs. On the other hand, a regional or city-wide perspective is better suited for identifying overarching trends and disparities. The choice ultimately hinges on the policy questions you're addressing, the data at your disposal, and the level of detail you aim to achieve. In many cases, localized data proves especially useful for crafting effective solutions in areas experiencing diversity or rapid change.
How can we use data without increasing displacement risk?
Using data to tackle displacement risk means pinpointing neighborhoods facing pressures like rising housing costs or other challenges and directing support where it’s needed most. This approach enables policymakers to allocate resources more effectively, back decisions with solid evidence, and track the outcomes of anti-displacement measures. By focusing on areas at the highest risk, data-driven strategies aim to improve housing stability while reducing the chances of resident displacement.
Related Blog Posts
How to Embed Equity in Local Resilience Planning for Municipalities & Government Agencies
How to Embed Equity in Local Resilience Planning for NGOs & Nonprofits
How to Use Data to Inform Climate and Housing Policy for Municipalities & Government Agencies
How to Use Data to Inform Climate and Housing Policy for Corporations
Latest Articles
©2026
Narrative Change and Power Building: The Missing Half of Advocacy
Narrative change is the process of disrupting dominant narratives that normalize inequity and advancing new narratives from historically marginalized communities.
Funding Resilience Without Federal Grants
BRIC is unreliable and FEMA is shrinking. Here's how cities fund climate resilience with dedicated revenue, blended finance, and a coordinating authority.
The ESG Blind Spot: How AI Is Finding Risks in Companies Nobody Else Is Watching
Norway's sovereign wealth fund uses AI to screen 7,200 portfolio companies for forced labor and corruption within 24 hours. The real story is the emerging-market coverage gap that traditional ESG data vendors miss — and what it means for any company with a global supply chain.
FAQ
01
What does it really mean to “redefine profit”?
02
What makes Council Fire different?
03
Who does Council Fire work with?
04
What does working with Council Fire actually look like?
05
How does Council Fire help organizations turn big goals into action?
06
How does Council Fire define and measure success?
07
How does technology fit into Council Fire’s work?
Apr 18, 2026
How to Use Data to Inform Climate and Housing Policy for NGOs & Nonprofits
Sustainability Strategy
In This Article
Guidance for nonprofits on combining localized climate and housing data to craft equitable resilience, retrofit, and anti-displacement policies.
How to Use Data to Inform Climate and Housing Policy for NGOs & Nonprofits
Data is your most powerful tool for driving climate and housing policy change. Here's how nonprofits can use it to tackle affordability and climate risks:
The Problem: Nearly 20 million U.S. homeowners face housing costs they can’t afford, while climate risks disproportionately affect low-income communities. Federal data often misses these groups, leaving them out of key decisions.
The Solution: Combining localized climate and housing data helps identify overlooked vulnerabilities, strengthen advocacy efforts, and create targeted policies.
Key Tools: Use resources like the Climate Mapping for Resilience and Adaptation (CMRA), HUD Data Catalog, and U.S. Climate Vulnerability Index (CVI) to analyze risks and housing needs.
Actionable Policies: Focus on updating building codes, creating disaster-resistant housing, and aligning housing reforms with emissions reduction goals.
Climate Action in Practice: How Data, AI, and Advocacy Are Reshaping Policy
Finding Data Sources for Climate Risks and Housing Needs
Climate and Housing Data Tools Comparison for NGOs
Accessing reliable, localized data is critical for understanding climate risks and housing challenges. Census tract-level insights reveal disparities often hidden by broader county-wide averages, and several U.S. government tools provide detailed, accessible information to help address these issues.
One key resource is the Climate Mapping for Resilience and Adaptation (CMRA) tool, developed through a collaboration involving NOAA, NASA, USGS, the Department of Energy, and the White House [5][7]. This platform focuses on five major hazards - extreme heat, drought, wildfire, flooding, and coastal inundation. It offers a real-time dashboard for current threats and a forecasting tool to assess risks across three future timeframes [5]. As the U.S. Climate Resilience Toolkit emphasizes:
"Knowing what hazards your assets might face is the first step in protecting them" [5].
For coastal communities, the Sea Level Rise Viewer provides visualizations of flood exposure and inundation scenarios [7], while the Wildfire Risk to Communities tool supports fire-prone regions in identifying and managing their vulnerabilities [8][9].
The National Risk Index (NRI), now part of FEMA's Resilience Analysis & Planning Tool (RAPT), evaluates risks from 18 natural hazards, including extreme cold and severe winter weather, down to the census tract level [6]. Communities can use this data to improve emergency plans, refine hazard mitigation strategies, and inform homeowners about local risks like flooding or extreme heat [5][6]. Additionally, the U.S. Climate Vulnerability Index (CVI) ranks over 70,000 census tracts using 184 datasets, helping pinpoint the specific factors driving climate vulnerability in targeted areas [10].
Using Climate Data Tools
Federal climate tools not only provide critical insights but also help identify communities eligible for funding under Justice40 criteria. For example, the CMRA Assessment Tool highlights census tracts and tribal lands meeting disadvantaged community standards [7]. Meanwhile, the CVI, developed with input from environmental justice leaders and published in Environment International, offers consistent and reliable indicators across the country [15].
To create a more comprehensive analysis, it's essential to pair climate data with detailed housing datasets.
Finding Housing Data
The HUD Data Catalog is a valuable resource, offering over 220 datasets covering public housing, community development, fair housing, and economic trends [12]. For a closer look at housing challenges, the CHAS dataset tracks housing cost burdens and overcrowding for low-income households at multiple geographic levels, including state, county, and census tracts [12]. CHAS also identifies how many households earning 30%, 50%, or 80% of the median income face housing issues [12].
HUD also provides annual estimates of Fair Market Rents (FMRs) for 530 metropolitan and 2,045 nonmetropolitan areas, useful for determining program eligibility and setting rent ceilings for housing assistance initiatives [12]. For homelessness data, the Point-in-Time (PIT) counts and Housing Inventory Count (HIC) reports offer snapshots of homeless populations and available housing inventory within Continuums of Care [11]. Additionally, the Building Permits Survey (BPS) delivers statistics on residential development at national, state, and local levels [13].
The American Community Survey (ACS) from the U.S. Census Bureau provides 5-year estimates on housing tenure, vacancy rates, and utility costs. These insights are essential for understanding workforce housing needs and demographic changes [13][14]. Combining tools like CMRA and CVI with housing data enables a clearer picture of where affordable, climate-resilient housing is most urgently needed.
Summary of Tools
The table below compares the focus, scale, and key features of these tools for easy reference:
Tool | Primary Focus | Geographic Scale | Key Feature |
|---|---|---|---|
CMRA | 5 Major Hazards (Heat, Flood, etc.) | Census Tract | |
NRI | 18 Natural Hazards | County & Census Tract | Risk to people, property, and agriculture [6] |
CVI | Climate Vulnerability Drivers | Census Tract | Ranks 70,000+ tracts using 184 datasets [10] |
CHAS Data | Housing problems for low-income households | State, County, Place, Tract | Tracks housing cost burdens and overcrowding [12] |
PIT Count | Sheltered and unsheltered homelessness | State, CoC | Annual estimates of homeless populations [11] |
Analyzing Data with Systems Thinking
Once climate and housing data are collected, the challenge lies in uncovering how they intersect. Traditional methods often examine risks in silos, but systems thinking digs deeper to reveal their connections. For instance, a census tract with high flood risk may also show increased eviction filings and utility shutoffs, signaling how rising climate-related costs contribute to resident displacement [4]. These connections, while theoretical, are backed by recent case studies.
Integrating diverse datasets - such as housing records with flood maps or heat indices - can uncover patterns that isolated analyses might miss. This approach highlights hidden interdependencies and provides a fuller picture of the challenges at hand [4].
In June 2024, researchers Amalie Zinn, Linna Zhu, Laurie Goodman, and Michael Neal from the Urban Institute demonstrated this by combining Verisk's probabilistic climate data with social vulnerability metrics. They shifted from FEMA's expected annual loss (EAL) methodology to a total replacement value approach, which revealed that low-to-moderate income (LMI) neighborhoods of color faced the greatest risks of riverine flooding - risks that FEMA's traditional data had obscured [1]. As the researchers explained:
"How we measure risk matters... FEMA's reliance on expected annual loss to measure the toll of a flood biases risk toward wealthier areas with more to lose financially" [1].
This kind of analysis is crucial because FEMA's methods often underrepresent the realities of vulnerable communities. By using proprietary probabilistic data, researchers were able to address nearly 90% of these gaps [1].
A similar approach has been applied in Cleveland to tackle environmental and housing challenges. In 2023, the Western Reserve Land Conservancy partnered with the city to conduct a property inventory. A team of 30 surveyors used a mobile app to grade properties on an A–F scale, combining visual inspections with utilities data from Case Western Reserve University's NEOCANDO database. This effort allowed the city to identify areas with lead paint risks and focus rehabilitation efforts on neighborhoods where poor housing quality overlapped with environmental hazards [4].
Adding a human element to the data strengthens these analyses further. Training residents as community scientists offers qualitative insights that complement numerical data [3]. For example, in Tucson, Arizona, the Sonora Environmental Research Institute is studying how rising temperatures in the Sonoran Desert impact housing. These findings help direct resources to the most vulnerable households [2]. By factoring in race and income when analyzing survey responses, NGOs ensure their efforts accurately represent the communities most in need [4].
Creating Policy Recommendations from Data
Using data-driven insights into climate and housing vulnerabilities, actionable policies can be crafted to address these pressing challenges. A balanced approach is key - policies must integrate both mitigation (reducing greenhouse gas emissions through measures like energy efficiency and green building standards) and adaptation (minimizing harm with strategies like weather-resistant designs and updated building codes). This dual focus is essential, as buildings significantly contribute to emissions, while millions of homes face increasing disaster risks. Importantly, these policies should also safeguard against rising housing costs and displacement, ensuring equitable outcomes.
For example, low-income households spend over 13% of their income on energy - nearly five times more than other households [19]. Any policy that increases construction or utility costs must include financial support, such as subsidies or innovative financing options. Aligning these efforts with the Justice40 Initiative, which ensures that 40% of federal climate and housing investments benefit disadvantaged communities [17], ensures equity remains central to these strategies.
Recommending Climate-Resilient Housing Solutions
A critical starting point for climate-resilient housing policies is updating building codes. These should mandate features like on-site solar storage, ember-proof roofing, and elevated structures in flood-prone areas [17]. Moving beyond voluntary guidelines to enforceable standards prevents cost-cutting measures that could compromise safety [18].
Established frameworks like FORTIFIED standards and Enterprise Green Communities Criteria offer proven methods to reduce weather-related losses while promoting affordable, healthy housing [17][18]. Citing such examples can lend credibility to policy recommendations and help overcome hesitation often caused by a lack of precedent [18].
Additionally, land banks and Community Land Trusts (CLTs) play a vital role in reinvesting in vacant properties while preserving affordability. For instance, the Michigan State Land Bank Authority manages over 4,500 properties and is exploring solar power development on contaminated sites. This approach not only stabilizes property values but also delivers sustainable energy solutions [17]. By leveraging data on property values and elevation, policies can direct affordable housing efforts to less vulnerable areas, avoiding displacement in communities meant to benefit from climate adaptation.
These housing-focused strategies should be complemented by broader urban planning efforts to address emissions reduction.
Aligning Housing Policy with Emissions Reduction
Reducing emissions involves rethinking both how homes are constructed and where they are located. Data supports key zoning reforms, such as encouraging denser, multifamily housing, transit-oriented development (TOD), and removing parking requirements to curb urban sprawl and lower emissions [19]. TOD, which places housing near jobs and essential services, not only cuts emissions but also improves access to opportunities.
For instance, New York City has mandated electrification for all new buildings, finding that all-electric homes are often less costly to build than mixed-fuel alternatives [19]. Similarly, Washington, D.C.'s "Green New Deal for Housing Amendment Act" aims to create net-zero, transit-oriented social housing using sustainable construction techniques [19]. These examples highlight how emissions reduction can align with affordability goals.
California is also taking steps by launching a centralized affordable housing delivery system on July 1, 2026 [16]. This initiative aims to streamline financing and accelerate innovative construction methods. Advocating for similar centralized models in other states could help reduce both development timelines and costs.
Finally, retrofit programs - such as grants or low-cost loans - can empower low-income homeowners and affordable rental housing providers to make climate upgrades without triggering displacement or rent increases. Improvements like better insulation, cooling systems, and air filtration can enhance living conditions while addressing climate challenges. As Dana Bourland, Senior Vice President of Environment and Strategic Initiatives at The JPB Foundation, eloquently puts it:
"To solve the housing crisis, we must simultaneously solve the climate crisis, and do both in ways that prioritize those who have had the least to do with creating either." [17]
This principle should guide every data-informed policy recommendation, ensuring that solutions address both climate and housing challenges while prioritizing equity.
Case Studies: Data-Driven Policy Examples and Council Fire's Work
Examples of Data-Driven Policy in Practice
Real-world examples highlight how NGOs and nonprofits turn data into impactful policies. In February 2026, a Mid-Atlantic coastal city with a population of 28,000 leveraged NOAA sea-level data and LOCA2 precipitation models to identify $4.2 billion worth of flood-vulnerable property. This analysis guided updates to floodplain and housing regulations, including raising the required freeboard from 1 foot to 3 feet and restricting the construction of critical facilities in 500-year floodplains. The city also secured $14.7 million in federal and state grants, achieving a benefit-cost ratio of 4.2:1, and initiated a voluntary buyout program for 23 properties with repetitive flood losses [20].
In another case, a regional healthcare system operating 12 hospitals mapped patient ZIP codes against heat exposure data across 57 facilities. This revealed four areas where climate risks overlapped with chronic health challenges. The findings drove a $180 million resilience investment plan, which helped limit insurance premium increases to 8%, far less than the projected 22% [23].
Meanwhile, a Caribbean island nation with 95,000 residents used drone-based LiDAR and hydrological modeling to create a National Adaptation Plan. These efforts secured a $45 million allocation from the Green Climate Fund and a $28 million debt-for-nature swap, which funded mangrove restoration and solar desalination projects [21].
These examples underscore how systematic data analysis can lead to transformative policies and investments, paving the way for Council Fire's expertise in turning insights into actionable strategies.
How Council Fire Supports Data-Driven Solutions
Council Fire builds on these successes by helping organizations implement large-scale, data-driven initiatives. Their work demonstrates how technical analysis and practical execution come together to unlock meaningful investments.
For example, Council Fire supported a regional climate compact of 35 organizations - including 14 municipalities and 12 businesses - spanning three counties. This collaboration unlocked $280 million in climate-related investments. A key outcome was the launch of a clean energy procurement program aggregating 420 GWh of demand, which saved participants $12 million annually and secured renewable energy pricing 18% below retail rates [22].
Council Fire’s methodology blends advanced data analytics with hands-on implementation. Their services include climate resilience planning, using tools like the CDC Social Vulnerability Index and LOCA2 precipitation data, as well as stakeholder engagement strategies that foster trust among diverse coalitions. Additionally, they provide grant-readiness support, aligning vulnerability assessments with federal funding requirements from the outset. This ensures that nonprofits move beyond simply gathering data - they turn it into actionable policies that deliver enduring environmental, social, and economic benefits.
Conclusion
Effective climate and housing policies hinge on using rigorous data analysis, systems thinking, and meaningful stakeholder engagement. By combining climate-specific insights with localized housing data, policymakers can identify vulnerable communities often overlooked by traditional metrics. As Dana Bourland from The JPB Foundation aptly states:
"To solve the housing crisis, we must simultaneously solve the climate crisis, and do both in ways that prioritize those who have had the least to do with creating either" [17].
Outdated data collection methods often fail to capture the realities faced by marginalized populations [1]. This highlights the need for nonprofits to adopt frameworks that address climate mitigation, adaptation, and remediation in tandem, shifting the focus from short-term fixes to sustainable, long-term solutions.
Community-led data collection plays a critical role in shaping impactful policies. When residents contribute as co-researchers, their lived experiences illuminate hyper-local risks that aggregated datasets often miss. Combining this grassroots perspective with technical analysis creates a strong foundation for policies that deliver measurable benefits across environmental, social, and economic dimensions.
Breaking down data silos is equally important. Cross-agency collaboration and ethical data-sharing agreements ensure that housing, environmental, and public health insights inform each other rather than existing in isolation. The most effective interventions - whether addressing coastal flood risks or building green affordable housing - blend quantitative data with qualitative insights to inform evidence-based advocacy strategies [4].
As seen in the case studies discussed, Council Fire’s method of translating data into actionable policies demonstrates how organizations can foster lasting resilience. For nonprofits, data should be viewed as a powerful tool to create equitable, climate-resilient communities. By leveraging these insights, they can confidently implement strategies that drive meaningful and lasting change.
FAQs
Which datasets should we combine first for our community?
To address housing challenges effectively, begin by merging datasets that cover local housing conditions, affordability metrics, and risks of displacement. Key data sources include resident surveys, property and parcel records, and demographic details, which together provide a clearer picture of community housing needs. Adding climate impact data is equally important, as the effects of climate change often worsen housing instability and increase displacement risks. This integrated approach highlights areas with aging housing stock, affordability issues, and heightened instability, offering a roadmap for targeted resilience planning.
How do we choose the right geographic level for analysis?
When deciding on a geographic level for analysis, align it with your project’s objectives and the specific dynamics of the community. A local or neighborhood-level focus can offer precise insights into issues like land use, vulnerabilities, and community needs. On the other hand, a regional or city-wide perspective is better suited for identifying overarching trends and disparities. The choice ultimately hinges on the policy questions you're addressing, the data at your disposal, and the level of detail you aim to achieve. In many cases, localized data proves especially useful for crafting effective solutions in areas experiencing diversity or rapid change.
How can we use data without increasing displacement risk?
Using data to tackle displacement risk means pinpointing neighborhoods facing pressures like rising housing costs or other challenges and directing support where it’s needed most. This approach enables policymakers to allocate resources more effectively, back decisions with solid evidence, and track the outcomes of anti-displacement measures. By focusing on areas at the highest risk, data-driven strategies aim to improve housing stability while reducing the chances of resident displacement.
Related Blog Posts
How to Embed Equity in Local Resilience Planning for Municipalities & Government Agencies
How to Embed Equity in Local Resilience Planning for NGOs & Nonprofits
How to Use Data to Inform Climate and Housing Policy for Municipalities & Government Agencies
How to Use Data to Inform Climate and Housing Policy for Corporations
Latest Articles
©2026
Narrative Change and Power Building: The Missing Half of Advocacy
Narrative change is the process of disrupting dominant narratives that normalize inequity and advancing new narratives from historically marginalized communities.
Funding Resilience Without Federal Grants
BRIC is unreliable and FEMA is shrinking. Here's how cities fund climate resilience with dedicated revenue, blended finance, and a coordinating authority.
The ESG Blind Spot: How AI Is Finding Risks in Companies Nobody Else Is Watching
Norway's sovereign wealth fund uses AI to screen 7,200 portfolio companies for forced labor and corruption within 24 hours. The real story is the emerging-market coverage gap that traditional ESG data vendors miss — and what it means for any company with a global supply chain.
FAQ
What does it really mean to “redefine profit”?
What makes Council Fire different?
Who does Council Fire work with?
What does working with Council Fire actually look like?
How does Council Fire help organizations turn big goals into action?
How does Council Fire define and measure success?
How does technology fit into Council Fire’s work?