
Apr 18, 2026
How to Use Data to Inform Climate and Housing Policy for Corporations
ESG Strategy
In This Article
How companies use climate and housing data to assess risk, target investments, and build resilient, equitable policies.
How to Use Data to Inform Climate and Housing Policy for Corporations
Businesses face a dual challenge: reducing environmental impact while addressing housing needs. The built environment contributes to 40% of global energy-related emissions, and disasters displaced 2.4 million Americans in 2023. Companies must act now by using data to align climate and housing strategies for long-term success.
Key Takeaways:
Data’s Role: Helps identify climate risks, housing gaps, and investment opportunities.
Climate Metrics: Track hazards like wildfire probability, sea-level rise, and heat waves.
Housing Insights: Use metrics like mortgage denial rates and housing affordability to target key areas.
Actionable Steps:
Collect reliable climate and housing data.
Analyze risks and opportunities using predictive models.
Implement policies that integrate climate resilience and housing stability.
Data-driven decisions not only reduce risks but also improve community outcomes and business performance. This article outlines practical strategies to achieve these goals.
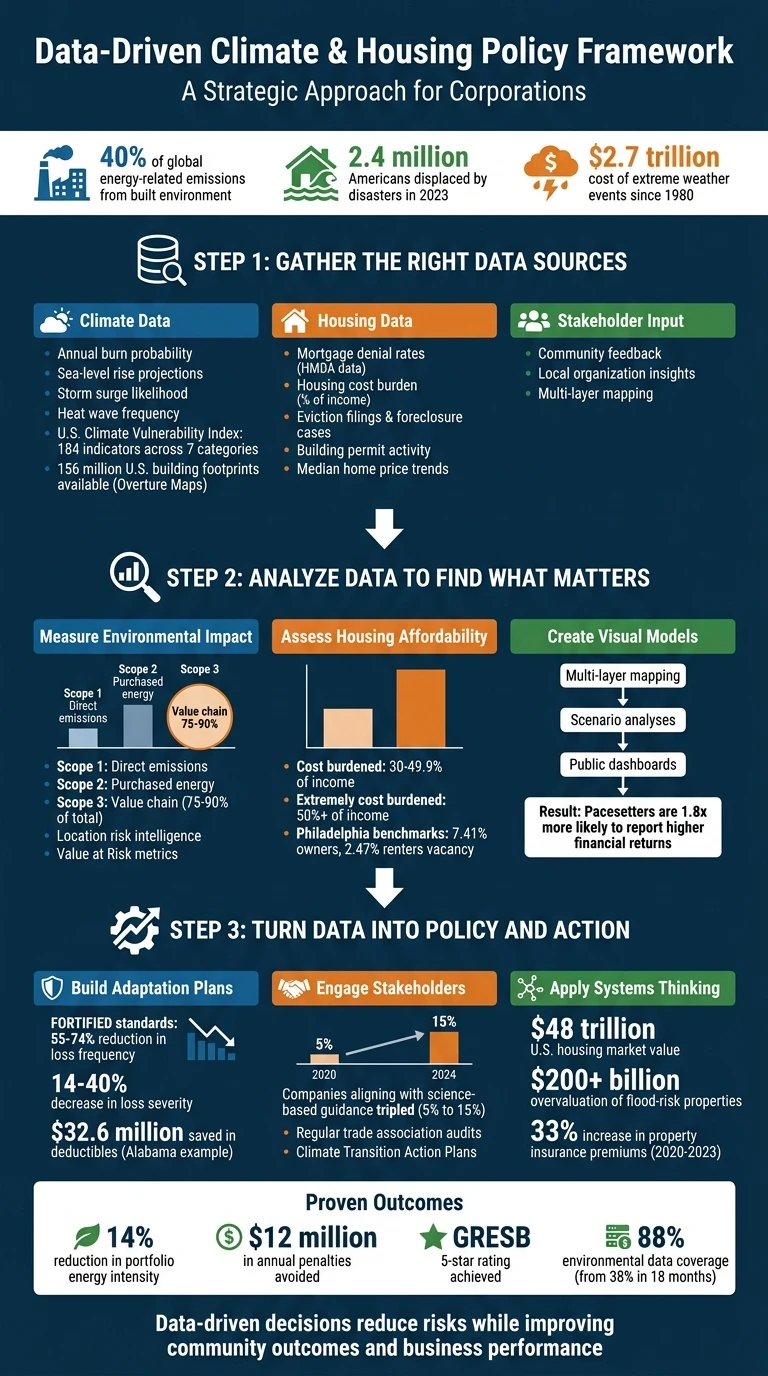
3-Step Framework for Data-Driven Climate and Housing Policy
Companies Using Climate Data To Reduce & Report Greenhouse Gas Emissions | Bloomberg Philanthropies
Step 1: Gather the Right Data Sources
Addressing environmental and housing challenges requires starting with the right data. Reliable and diverse data sets form the backbone of actionable climate and housing policies. Without this foundation, strategies risk being imprecise and ineffective.
Climate Data Essentials
To build effective climate policies, focus on three key areas: hazard probability, asset exposure, and vulnerability levels [7]. This involves gathering both historical data and future projections, such as mid-century climate scenarios or models based on a 2°C warming outcome [4][5].
Key climate metrics to track include annual burn probability, sea-level rise, storm surge likelihood, and heat wave frequency [6][7]. For example, wildfire growth rates in the western U.S. more than doubled between 2001 and 2020 due to worsening "fire weather" conditions. This makes wildfire data critical for properties in these regions [7]. Modern wildfire models now even account for wind direction to predict how fires spread from wildlands to developed areas [7].
The U.S. Climate Vulnerability Index (CVI) offers a detailed framework, using 184 indicators across seven categories to assess risk at the census tract level [5]. Public tools like the U.S. Climate Resilience Toolkit, the Fifth National Climate Assessment, and the Climate Mapping for Resilience and Adaptation (CMRA) portal provide access to both historical records and future scenarios [6]. Additionally, the Overture Maps Foundation offers open-source building footprints for 156 million U.S. buildings, helping organizations assess risk without relying on costly proprietary datasets [7].
Combining climate data with "baseline vulnerability" indicators - such as housing characteristics, infrastructure capacity, and social equity metrics - adds depth to your analysis [4][5]. Legal scholar Madison Condon highlights the importance of accessible data:
There's a growing concern that the climate risk information available to individual citizens and municipalities … is limited and expensive to access [7].
The push for "Open Climate Risk" data aims to counter the high costs and inconsistencies of many proprietary models [7]. Once climate risks are understood, the next step is examining housing market data to address affordability and stability issues.
Housing Market Data to Monitor
Housing market data helps identify affordability gaps and areas where stable housing is most at risk. Start with metrics like the gap between median household income and Area Median Income (AMI), housing cost burden (percentage of income spent on housing), and neighborhood-level rental rates [8][9].
For example, in May 2024, Indianapolis used PolicyMap to locate census tracts with mortgage denial rates exceeding 10% and 15%. By layering this data with Moody's Analytics housing gap insights, they identified specific areas in the southern and eastern parts of the city where homeownership barriers persisted despite adequate income levels. This led to targeted credit access programs [8].
Key indicators to track include:
Access and stability metrics: Mortgage denial rates (via HMDA data), eviction filings, foreclosure cases, and utility shutoff records for water, gas, and electricity [8][9].
Supply and adequacy metrics: Housing unit gaps (undersupply vs. surplus), building permit activity, and the age and condition of existing housing stock [8][9].
In Newark, New Jersey, researchers at Rutgers University analyzed residential sales from 1989 to 2020 and found that by 2020, nearly 50% of sales were to institutional buyers - a 300% increase since 2010. This data spurred Mayor Baraka and the Newark Municipal Council to launch a Homeownership Revitalization Program, which prioritized selling city-owned properties to residents at low cost [9].
Median home prices in the Indianapolis metro area surged by 83% since 2013, with a 53% jump since the COVID-19 pandemic began, underscoring how quickly market dynamics can shift [8]. County assessor data can also help track 2-4 unit properties, which often serve as affordable family housing but are at risk of foreclosure or demolition [9].
Dr. Jazmyne McNeese of PolicyMap underscores the importance of community assets:
Quality housing is most effective when paired with strong community assets such as high-performing schools, transit access, healthcare facilities, and job centers [8].
By considering proximity to these assets, you can evaluate housing accessibility beyond just affordability.
Incorporating Stakeholder Input
Quantitative data alone can't capture the full picture. Stakeholder input is essential for understanding community needs, identifying overlooked gaps, and building trust with those most affected by policy decisions.
Successful policy-making involves a collaborative approach, incorporating feedback from both technical users and community stakeholders [4]. Local organizations can provide qualitative insights into on-the-ground risks that models might miss, such as infrastructure gaps, historical inequities, or specific neighborhood concerns [5]. Local data sources often align with smaller planning geographies - like neighborhoods, wards, or boroughs - making them especially valuable [9].
Using multi-layer mapping, combine physical risk data with community asset information to see where risks overlap with resource gaps [8][10]. For example, this approach can highlight areas where communities lack the resources to respond effectively to climate challenges. As investments in climate adaptation grow, stakeholder input becomes increasingly vital for filling data gaps and ensuring policies are both practical and responsive [7]. By integrating these perspectives, organizations can craft strategies that are informed, inclusive, and impactful.
Step 2: Analyze Data to Find What Matters
The next step in leveraging data is turning it into actionable insights by identifying key risks and opportunities. This involves quantifying both physical risks, such as floods and wildfires, and transition risks like carbon pricing and regulatory changes [12][13].
Measuring Environmental Impact
Begin by assessing your organization's carbon footprint across all three scopes of emissions:
Scope 1: Direct emissions from owned sources.
Scope 2: Indirect emissions from purchased electricity and heat.
Scope 3: Emissions across the entire value chain, from suppliers to end-users.
Scope 3 emissions often dominate, making up 75% of total emissions in many industries, and surpassing 90% in sectors like food, mining, and construction [14].
To understand potential outcomes, use climate scenarios to model the effects of moderate to severe warming [12][13]. For instance, Clariant Ltd, a chemical company, uses Task Force on Climate-related Financial Disclosures (TCFD) reporting to inform strategic decisions. Dr. Elias Lützen, Program Manager for Sustainability Transformation at Clariant, noted in June 2025:
Our TCFD reporting not only serves to analyse our risk exposure, but also drives strategic decisions... as changing environmental conditions can consciously inform decision-making and enable future competitive advantages [12].
Similarly, Cemex reduced its carbon emissions per ton by 40% in European operations, leveraging strict climate regulations to refine global solutions [14].
Incorporate location risk intelligence to determine which assets are most vulnerable to extreme weather events like droughts, heat waves, and storm surges [11][12]. Use "Value at Risk" metrics to evaluate property resilience and prioritize investments in adaptation [13].
Assessing Housing Affordability and Access
In parallel, housing data can uncover socioeconomic vulnerabilities. Analyzing affordability involves examining cost burdens and access barriers. Households spending 30–49.9% of income on housing are classified as "cost burdened", while those spending over 50% are deemed "extremely cost burdened" [1].
In August 2025, Dr. Jazmyne McNeese utilized PolicyMap's extensive indicators for a housing needs assessment in Indianapolis. This analysis revealed census tracts with mortgage denial rates above 15% and significant housing shortages, particularly in urban areas where median home prices had surged 53% since the onset of the COVID-19 pandemic [8]. Overlaying this data with income metrics pinpointed areas where access barriers were highest.
To further refine these insights, calculate housing unit gaps by comparing current vacancy rates to benchmarks. For example, Philadelphia uses 7.41% for owners and 2.47% for renters as equilibrium rates [1]. Combining this with mortgage denial data from the Home Mortgage Disclosure Act (HMDA) highlights areas where demand exists but access remains restricted.
When analyzing climate-vulnerable areas, consider the Total Replacement Value of structures rather than market value. This approach avoids bias toward wealthier areas and accounts for the effects of historical disinvestment in lower-income neighborhoods and communities of color [15].
Creating Visual Models and Scenarios
Once you've quantified environmental and housing challenges, synthesize these findings into visual models to guide decision-making. Multi-layer mapping can combine data on climate risks, housing shortages, income levels, and public land availability to identify the most impactful intervention points [8][1].
In July 2025, Philadelphia launched the "Housing Opportunities Made Easy" (H.O.M.E.) initiative, a $2 billion plan to create or preserve 30,000 housing units. Using data from Moody's Analytics and PolicyMap, the city identified acute housing shortages at the census tract level. By overlaying building permits and occupancy certificates, the team ensured that development efforts aligned with identified needs. This data-driven approach enabled Philadelphia to secure $800 million in bonds by demonstrating specific, evidence-based needs across neighborhoods [1].
Employ both top-down and bottom-up scenario analyses to balance macro goals like net-zero targets with granular, asset-level insights. For example, a global commodities finance bank collaborated with EY-Parthenon to design net-zero strategies while measuring greenhouse gas emissions at the client level. These metrics were integrated into the bank's capital allocation and credit portfolio processes to guide growth [17].
Finally, create public-facing dashboards to share progress transparently. This not only informs the community but also encourages participation in tracking initiatives [1]. Organizations taking this proactive, data-driven approach - labeled "Pacesetters" in climate action - are 1.8 times more likely to report higher-than-expected financial returns from their initiatives compared to less active peers [14].
Step 3: Turn Data into Policy and Action
Once climate risks and housing vulnerabilities are analyzed, the next step is turning these insights into actionable policies. This means moving beyond raw data to build strategies that protect assets, support communities, and address the interconnected challenges of climate and housing.
Building Climate Adaptation Plans
Adaptation planning requires forward-thinking building standards that account for future risks rather than relying on outdated data. Since 1980, extreme weather events have cost the U.S. economy more than $2.7 trillion [2]. Despite this, many building codes still rely on historical climate patterns, leaving new developments exposed to escalating risks.
One effective approach is adopting FORTIFIED construction standards, created by the Insurance Institute for Business & Home Safety. For instance, Alabama’s "Strengthen Alabama Homes" program retrofitted homes to meet these standards after Hurricane Sally, leading to a 55–74% reduction in loss frequency and a 14–40% decrease in loss severity. These measures potentially saved $32.6 million in deductibles [2]. While resilient construction can increase costs by 30% to 50%, partnerships with state governments and insurers can help create subsidy programs to make these upgrades more affordable.
In California, the Department of Insurance took a proactive step in 2022 by requiring premium discounts for homeowners who implement wildfire safety measures. This policy directly incentivizes risk reduction at the property level [2].
Using Stakeholder Feedback in Policy Design
Between 2020 and 2024, the percentage of companies aligning their advocacy with science-based guidance tripled, rising from 5% to 15% [18]. Achieving this kind of alignment requires ongoing collaboration with industry partners, government entities, and local communities, all while applying the insights gained from data analysis.
Iberdrola, under the leadership of Gonzalo Sáenz de Miera, Director of Climate Change and Alliances, has embraced this collaborative approach to tackle what he calls the "trilemma" of sustainability, social impact, and competitiveness:
"Climate change is far too complex and important of an issue for any company to address alone, and Iberdrola has built our strategic alliances to address a trilemma of related issues: sustainability, social impact, and competitiveness." [18]
Unilever offers another example of effective stakeholder engagement. Through annual reviews of its industry association memberships, the company ensures alignment with its climate transition goals. Fiona Duggan, Global Sustainability Senior Manager at Unilever, explained:
"When our trade associations aren't aligned with our climate transition plans, that's not good value for our money. Misalignment means we're invested in an association, but it is not reflecting our values or our business needs." [18]
Conducting regular audits of trade association memberships and implementing Climate Transition Action Plans can help maintain transparency and ensure that stakeholder engagement aligns with sustainability objectives.
Applying Systems Thinking to Connect the Dots
Addressing climate and housing challenges requires a systems-thinking approach that considers the broader connections between land-use decisions, financial markets, and governance [2]. The U.S. housing market, valued at approximately $48 trillion [16], includes residential properties at flood risk that may be overvalued by more than $200 billion [2]. This highlights the need for coordinated, large-scale action.
Rising insurance and reinsurance costs serve as a clear signal for urgent adaptation. Between 2020 and 2023, average nominal property insurance premiums rose by 33% [16], reflecting the market's response to evolving climate risks.
Regional resilience strategies often prove more effective than isolated property-level solutions. For example, Copenhagen’s plan for carbon neutrality by 2025 combines cycling infrastructure with district heating networks powered by renewable energy [19]. Similarly, Singapore uses real-time sensor networks and public-private stakeholder forums to manage its limited space efficiently [19]. These examples demonstrate how standardized building codes, stakeholder collaboration, and comprehensive adaptation strategies can drive meaningful change.
Case Study: Data-Driven Climate and Housing Strategy in Action
This case study highlights how leveraging data can transform insights into actionable strategies, addressing both climate challenges and housing needs.
Protecting Housing Finance from Climate Risks
In March 2025, Sabra Health Care REIT revamped its approach to climate risk management across its portfolio of skilled nursing and senior housing facilities. Under the leadership of EVP of Asset Management Peter Nyland, the company integrated hazard data from ClimateCheck into its due diligence and portfolio management processes. Rather than viewing climate assessments as a regulatory formality, Sabra used predictive data to pinpoint properties most vulnerable to risks like wildfires, extreme heat, and flooding. This enabled the company to prioritize cost-effective upgrades for these high-risk properties.
As part of this initiative, Sabra established the $5 million "Green Links Fund", which provided full upfront financing for energy and water efficiency upgrades across its operator network. Operators were able to implement improvements such as HVAC upgrades, LED lighting installations, and water-saving systems without bearing the initial costs. The fund was repaid through the utility savings generated by these enhancements [20]. Nyland explained the strategy:
"Climate risk is operating risk. Whether it is an acquisition, repurposing a facility, or energy retrofit. We're using ClimateCheck projected data to better understand where we can help Sabra and our operators make smart investments to reduce operating costs." [20]
This approach demonstrates how data can be used to mitigate risks while achieving financial and operational efficiency.
Tailoring Solutions to Local Conditions
Another example comes from a publicly traded commercial REIT managing an $8.2 billion portfolio of 120 properties. Between 2024 and 2026, this company adopted a localized, data-driven strategy to address specific regulatory and operational challenges. The REIT evaluated 31 properties for compliance with local building performance standards, such as New York's Local Law 97 and Denver's Building Performance Standards. By analyzing emissions data and estimating retrofit costs, the company identified three properties where compliance expenses and climate risks outweighed the benefits of continued ownership, leading to their sale [3].
To address tenant-related data gaps, the REIT incorporated green lease provisions into 68% of new leases, improving utility monitoring and data collection. This effort expanded environmental data coverage from 38% to 88% of the portfolio's total floor area in just 18 months. The results were substantial: a 14% reduction in portfolio energy intensity over two years, avoidance of approximately $12 million in annual penalties, and a GRESB 5-star rating [3]. By focusing on hyperlocal data and aligning strategies with specific regulations and property needs, the REIT achieved measurable financial savings and environmental benefits, proving the value of precision-driven decision-making.
Conclusion
What Corporate Leaders Should Remember
Turning sustainability goals into reality starts with data. Leaders need to gather insights from climate models, housing market trends, and stakeholder input, then analyze this information to identify risks, opportunities, and areas where compliance may fall short. These insights should be seamlessly integrated into business strategies to drive meaningful action.
Research highlights that sustainable properties command higher premiums compared to inefficient, high-carbon counterparts. By leveraging predictive climate models and localized housing data, companies can make informed decisions to allocate resources effectively, reduce risks, and achieve both environmental and financial gains. This approach transforms sustainability from a regulatory checkbox into a strategic advantage.
How Council Fire Helps Turn Sustainability into Results
Council Fire applies data-driven insights to deliver measurable outcomes. For example, between February 2024 and February 2026, they partnered with a publicly traded REIT to boost property-level environmental data coverage from 38% to 88% in just 18 months. By embedding ESG criteria into investment decisions and creating carbon abatement cost curves, the REIT earned a GRESB 5-star rating and cut portfolio energy intensity by 14% [3].
Their expertise lies in tackling complex data challenges, such as bridging tenant data gaps in real estate portfolios or designing resilience plans that meet federal and state funding requirements. Council Fire integrates sustainability into essential business processes, ensuring each recommendation balances environmental benefits with financial returns. From navigating regulations like New York's Local Law 97 to preparing for TCFD-aligned disclosures or crafting climate adaptation strategies, Council Fire delivers tangible progress through a blend of systems thinking and decades of hands-on experience.
FAQs
What data should we collect first?
To address housing affordability and climate-related risks effectively, begin by gathering comprehensive data on key factors such as supply and demand dynamics, natural disaster trends, and associated property damage costs. Pay close attention to metrics like median home prices, mortgage affordability rates, and statistics on climate impacts, including the frequency and severity of natural disasters. This data serves as the groundwork for pinpointing critical challenges and crafting policies that balance climate resilience with affordable housing solutions.
How do we link climate risk to housing affordability?
Understanding the connection between climate risk and housing affordability involves recognizing how events like floods and wildfires drive up housing costs. These disasters lead to higher insurance premiums and significant property damage, which can make it harder for low- and moderate-income families to find affordable housing.
Tools such as risk indexes play a key role in pinpointing areas most at risk. By using these insights, investments can be directed toward building resilient infrastructure and retrofitting affordable housing. These measures help reduce vulnerability while ensuring housing remains within reach for those who need it most.
How do we turn the analysis into policy fast?
To move from analysis to policy efficiently, leveraging precise, location-specific data is key to crafting actionable strategies. Take Philadelphia as an example: by analyzing housing gap data, the city developed a housing plan in just six months. This plan set clear objectives, such as creating or preserving 30,000 housing units. Similarly, using data-driven methods allows policymakers to pinpoint local opportunities, enabling them to address housing and climate challenges with targeted, effective solutions.
Related Blog Posts
Latest Articles
©2026

Narrative Change and Power Building: The Missing Half of Advocacy
Narrative change is the process of disrupting dominant narratives that normalize inequity and advancing new narratives from historically marginalized communities.

Funding Resilience Without Federal Grants
BRIC is unreliable and FEMA is shrinking. Here's how cities fund climate resilience with dedicated revenue, blended finance, and a coordinating authority.

The ESG Blind Spot: How AI Is Finding Risks in Companies Nobody Else Is Watching
Norway's sovereign wealth fund uses AI to screen 7,200 portfolio companies for forced labor and corruption within 24 hours. The real story is the emerging-market coverage gap that traditional ESG data vendors miss — and what it means for any company with a global supply chain.
Narrative Change and Power Building: The Missing Half of Advocacy
Narrative change is the process of disrupting dominant narratives that normalize inequity and advancing new narratives from historically marginalized communities.
Funding Resilience Without Federal Grants
BRIC is unreliable and FEMA is shrinking. Here's how cities fund climate resilience with dedicated revenue, blended finance, and a coordinating authority.
The ESG Blind Spot: How AI Is Finding Risks in Companies Nobody Else Is Watching
Norway's sovereign wealth fund uses AI to screen 7,200 portfolio companies for forced labor and corruption within 24 hours. The real story is the emerging-market coverage gap that traditional ESG data vendors miss — and what it means for any company with a global supply chain.
FAQ
01
What does it really mean to “redefine profit”?
02
What makes Council Fire different?
03
Who does Council Fire work with?
04
What does working with Council Fire actually look like?
05
How does Council Fire help organizations turn big goals into action?
06
How does Council Fire define and measure success?
07
How does technology fit into Council Fire’s work?
Apr 18, 2026
How to Use Data to Inform Climate and Housing Policy for Corporations
ESG Strategy
In This Article
How companies use climate and housing data to assess risk, target investments, and build resilient, equitable policies.
How to Use Data to Inform Climate and Housing Policy for Corporations
Businesses face a dual challenge: reducing environmental impact while addressing housing needs. The built environment contributes to 40% of global energy-related emissions, and disasters displaced 2.4 million Americans in 2023. Companies must act now by using data to align climate and housing strategies for long-term success.
Key Takeaways:
Data’s Role: Helps identify climate risks, housing gaps, and investment opportunities.
Climate Metrics: Track hazards like wildfire probability, sea-level rise, and heat waves.
Housing Insights: Use metrics like mortgage denial rates and housing affordability to target key areas.
Actionable Steps:
Collect reliable climate and housing data.
Analyze risks and opportunities using predictive models.
Implement policies that integrate climate resilience and housing stability.
Data-driven decisions not only reduce risks but also improve community outcomes and business performance. This article outlines practical strategies to achieve these goals.
3-Step Framework for Data-Driven Climate and Housing Policy
Companies Using Climate Data To Reduce & Report Greenhouse Gas Emissions | Bloomberg Philanthropies
Step 1: Gather the Right Data Sources
Addressing environmental and housing challenges requires starting with the right data. Reliable and diverse data sets form the backbone of actionable climate and housing policies. Without this foundation, strategies risk being imprecise and ineffective.
Climate Data Essentials
To build effective climate policies, focus on three key areas: hazard probability, asset exposure, and vulnerability levels [7]. This involves gathering both historical data and future projections, such as mid-century climate scenarios or models based on a 2°C warming outcome [4][5].
Key climate metrics to track include annual burn probability, sea-level rise, storm surge likelihood, and heat wave frequency [6][7]. For example, wildfire growth rates in the western U.S. more than doubled between 2001 and 2020 due to worsening "fire weather" conditions. This makes wildfire data critical for properties in these regions [7]. Modern wildfire models now even account for wind direction to predict how fires spread from wildlands to developed areas [7].
The U.S. Climate Vulnerability Index (CVI) offers a detailed framework, using 184 indicators across seven categories to assess risk at the census tract level [5]. Public tools like the U.S. Climate Resilience Toolkit, the Fifth National Climate Assessment, and the Climate Mapping for Resilience and Adaptation (CMRA) portal provide access to both historical records and future scenarios [6]. Additionally, the Overture Maps Foundation offers open-source building footprints for 156 million U.S. buildings, helping organizations assess risk without relying on costly proprietary datasets [7].
Combining climate data with "baseline vulnerability" indicators - such as housing characteristics, infrastructure capacity, and social equity metrics - adds depth to your analysis [4][5]. Legal scholar Madison Condon highlights the importance of accessible data:
There's a growing concern that the climate risk information available to individual citizens and municipalities … is limited and expensive to access [7].
The push for "Open Climate Risk" data aims to counter the high costs and inconsistencies of many proprietary models [7]. Once climate risks are understood, the next step is examining housing market data to address affordability and stability issues.
Housing Market Data to Monitor
Housing market data helps identify affordability gaps and areas where stable housing is most at risk. Start with metrics like the gap between median household income and Area Median Income (AMI), housing cost burden (percentage of income spent on housing), and neighborhood-level rental rates [8][9].
For example, in May 2024, Indianapolis used PolicyMap to locate census tracts with mortgage denial rates exceeding 10% and 15%. By layering this data with Moody's Analytics housing gap insights, they identified specific areas in the southern and eastern parts of the city where homeownership barriers persisted despite adequate income levels. This led to targeted credit access programs [8].
Key indicators to track include:
Access and stability metrics: Mortgage denial rates (via HMDA data), eviction filings, foreclosure cases, and utility shutoff records for water, gas, and electricity [8][9].
Supply and adequacy metrics: Housing unit gaps (undersupply vs. surplus), building permit activity, and the age and condition of existing housing stock [8][9].
In Newark, New Jersey, researchers at Rutgers University analyzed residential sales from 1989 to 2020 and found that by 2020, nearly 50% of sales were to institutional buyers - a 300% increase since 2010. This data spurred Mayor Baraka and the Newark Municipal Council to launch a Homeownership Revitalization Program, which prioritized selling city-owned properties to residents at low cost [9].
Median home prices in the Indianapolis metro area surged by 83% since 2013, with a 53% jump since the COVID-19 pandemic began, underscoring how quickly market dynamics can shift [8]. County assessor data can also help track 2-4 unit properties, which often serve as affordable family housing but are at risk of foreclosure or demolition [9].
Dr. Jazmyne McNeese of PolicyMap underscores the importance of community assets:
Quality housing is most effective when paired with strong community assets such as high-performing schools, transit access, healthcare facilities, and job centers [8].
By considering proximity to these assets, you can evaluate housing accessibility beyond just affordability.
Incorporating Stakeholder Input
Quantitative data alone can't capture the full picture. Stakeholder input is essential for understanding community needs, identifying overlooked gaps, and building trust with those most affected by policy decisions.
Successful policy-making involves a collaborative approach, incorporating feedback from both technical users and community stakeholders [4]. Local organizations can provide qualitative insights into on-the-ground risks that models might miss, such as infrastructure gaps, historical inequities, or specific neighborhood concerns [5]. Local data sources often align with smaller planning geographies - like neighborhoods, wards, or boroughs - making them especially valuable [9].
Using multi-layer mapping, combine physical risk data with community asset information to see where risks overlap with resource gaps [8][10]. For example, this approach can highlight areas where communities lack the resources to respond effectively to climate challenges. As investments in climate adaptation grow, stakeholder input becomes increasingly vital for filling data gaps and ensuring policies are both practical and responsive [7]. By integrating these perspectives, organizations can craft strategies that are informed, inclusive, and impactful.
Step 2: Analyze Data to Find What Matters
The next step in leveraging data is turning it into actionable insights by identifying key risks and opportunities. This involves quantifying both physical risks, such as floods and wildfires, and transition risks like carbon pricing and regulatory changes [12][13].
Measuring Environmental Impact
Begin by assessing your organization's carbon footprint across all three scopes of emissions:
Scope 1: Direct emissions from owned sources.
Scope 2: Indirect emissions from purchased electricity and heat.
Scope 3: Emissions across the entire value chain, from suppliers to end-users.
Scope 3 emissions often dominate, making up 75% of total emissions in many industries, and surpassing 90% in sectors like food, mining, and construction [14].
To understand potential outcomes, use climate scenarios to model the effects of moderate to severe warming [12][13]. For instance, Clariant Ltd, a chemical company, uses Task Force on Climate-related Financial Disclosures (TCFD) reporting to inform strategic decisions. Dr. Elias Lützen, Program Manager for Sustainability Transformation at Clariant, noted in June 2025:
Our TCFD reporting not only serves to analyse our risk exposure, but also drives strategic decisions... as changing environmental conditions can consciously inform decision-making and enable future competitive advantages [12].
Similarly, Cemex reduced its carbon emissions per ton by 40% in European operations, leveraging strict climate regulations to refine global solutions [14].
Incorporate location risk intelligence to determine which assets are most vulnerable to extreme weather events like droughts, heat waves, and storm surges [11][12]. Use "Value at Risk" metrics to evaluate property resilience and prioritize investments in adaptation [13].
Assessing Housing Affordability and Access
In parallel, housing data can uncover socioeconomic vulnerabilities. Analyzing affordability involves examining cost burdens and access barriers. Households spending 30–49.9% of income on housing are classified as "cost burdened", while those spending over 50% are deemed "extremely cost burdened" [1].
In August 2025, Dr. Jazmyne McNeese utilized PolicyMap's extensive indicators for a housing needs assessment in Indianapolis. This analysis revealed census tracts with mortgage denial rates above 15% and significant housing shortages, particularly in urban areas where median home prices had surged 53% since the onset of the COVID-19 pandemic [8]. Overlaying this data with income metrics pinpointed areas where access barriers were highest.
To further refine these insights, calculate housing unit gaps by comparing current vacancy rates to benchmarks. For example, Philadelphia uses 7.41% for owners and 2.47% for renters as equilibrium rates [1]. Combining this with mortgage denial data from the Home Mortgage Disclosure Act (HMDA) highlights areas where demand exists but access remains restricted.
When analyzing climate-vulnerable areas, consider the Total Replacement Value of structures rather than market value. This approach avoids bias toward wealthier areas and accounts for the effects of historical disinvestment in lower-income neighborhoods and communities of color [15].
Creating Visual Models and Scenarios
Once you've quantified environmental and housing challenges, synthesize these findings into visual models to guide decision-making. Multi-layer mapping can combine data on climate risks, housing shortages, income levels, and public land availability to identify the most impactful intervention points [8][1].
In July 2025, Philadelphia launched the "Housing Opportunities Made Easy" (H.O.M.E.) initiative, a $2 billion plan to create or preserve 30,000 housing units. Using data from Moody's Analytics and PolicyMap, the city identified acute housing shortages at the census tract level. By overlaying building permits and occupancy certificates, the team ensured that development efforts aligned with identified needs. This data-driven approach enabled Philadelphia to secure $800 million in bonds by demonstrating specific, evidence-based needs across neighborhoods [1].
Employ both top-down and bottom-up scenario analyses to balance macro goals like net-zero targets with granular, asset-level insights. For example, a global commodities finance bank collaborated with EY-Parthenon to design net-zero strategies while measuring greenhouse gas emissions at the client level. These metrics were integrated into the bank's capital allocation and credit portfolio processes to guide growth [17].
Finally, create public-facing dashboards to share progress transparently. This not only informs the community but also encourages participation in tracking initiatives [1]. Organizations taking this proactive, data-driven approach - labeled "Pacesetters" in climate action - are 1.8 times more likely to report higher-than-expected financial returns from their initiatives compared to less active peers [14].
Step 3: Turn Data into Policy and Action
Once climate risks and housing vulnerabilities are analyzed, the next step is turning these insights into actionable policies. This means moving beyond raw data to build strategies that protect assets, support communities, and address the interconnected challenges of climate and housing.
Building Climate Adaptation Plans
Adaptation planning requires forward-thinking building standards that account for future risks rather than relying on outdated data. Since 1980, extreme weather events have cost the U.S. economy more than $2.7 trillion [2]. Despite this, many building codes still rely on historical climate patterns, leaving new developments exposed to escalating risks.
One effective approach is adopting FORTIFIED construction standards, created by the Insurance Institute for Business & Home Safety. For instance, Alabama’s "Strengthen Alabama Homes" program retrofitted homes to meet these standards after Hurricane Sally, leading to a 55–74% reduction in loss frequency and a 14–40% decrease in loss severity. These measures potentially saved $32.6 million in deductibles [2]. While resilient construction can increase costs by 30% to 50%, partnerships with state governments and insurers can help create subsidy programs to make these upgrades more affordable.
In California, the Department of Insurance took a proactive step in 2022 by requiring premium discounts for homeowners who implement wildfire safety measures. This policy directly incentivizes risk reduction at the property level [2].
Using Stakeholder Feedback in Policy Design
Between 2020 and 2024, the percentage of companies aligning their advocacy with science-based guidance tripled, rising from 5% to 15% [18]. Achieving this kind of alignment requires ongoing collaboration with industry partners, government entities, and local communities, all while applying the insights gained from data analysis.
Iberdrola, under the leadership of Gonzalo Sáenz de Miera, Director of Climate Change and Alliances, has embraced this collaborative approach to tackle what he calls the "trilemma" of sustainability, social impact, and competitiveness:
"Climate change is far too complex and important of an issue for any company to address alone, and Iberdrola has built our strategic alliances to address a trilemma of related issues: sustainability, social impact, and competitiveness." [18]
Unilever offers another example of effective stakeholder engagement. Through annual reviews of its industry association memberships, the company ensures alignment with its climate transition goals. Fiona Duggan, Global Sustainability Senior Manager at Unilever, explained:
"When our trade associations aren't aligned with our climate transition plans, that's not good value for our money. Misalignment means we're invested in an association, but it is not reflecting our values or our business needs." [18]
Conducting regular audits of trade association memberships and implementing Climate Transition Action Plans can help maintain transparency and ensure that stakeholder engagement aligns with sustainability objectives.
Applying Systems Thinking to Connect the Dots
Addressing climate and housing challenges requires a systems-thinking approach that considers the broader connections between land-use decisions, financial markets, and governance [2]. The U.S. housing market, valued at approximately $48 trillion [16], includes residential properties at flood risk that may be overvalued by more than $200 billion [2]. This highlights the need for coordinated, large-scale action.
Rising insurance and reinsurance costs serve as a clear signal for urgent adaptation. Between 2020 and 2023, average nominal property insurance premiums rose by 33% [16], reflecting the market's response to evolving climate risks.
Regional resilience strategies often prove more effective than isolated property-level solutions. For example, Copenhagen’s plan for carbon neutrality by 2025 combines cycling infrastructure with district heating networks powered by renewable energy [19]. Similarly, Singapore uses real-time sensor networks and public-private stakeholder forums to manage its limited space efficiently [19]. These examples demonstrate how standardized building codes, stakeholder collaboration, and comprehensive adaptation strategies can drive meaningful change.
Case Study: Data-Driven Climate and Housing Strategy in Action
This case study highlights how leveraging data can transform insights into actionable strategies, addressing both climate challenges and housing needs.
Protecting Housing Finance from Climate Risks
In March 2025, Sabra Health Care REIT revamped its approach to climate risk management across its portfolio of skilled nursing and senior housing facilities. Under the leadership of EVP of Asset Management Peter Nyland, the company integrated hazard data from ClimateCheck into its due diligence and portfolio management processes. Rather than viewing climate assessments as a regulatory formality, Sabra used predictive data to pinpoint properties most vulnerable to risks like wildfires, extreme heat, and flooding. This enabled the company to prioritize cost-effective upgrades for these high-risk properties.
As part of this initiative, Sabra established the $5 million "Green Links Fund", which provided full upfront financing for energy and water efficiency upgrades across its operator network. Operators were able to implement improvements such as HVAC upgrades, LED lighting installations, and water-saving systems without bearing the initial costs. The fund was repaid through the utility savings generated by these enhancements [20]. Nyland explained the strategy:
"Climate risk is operating risk. Whether it is an acquisition, repurposing a facility, or energy retrofit. We're using ClimateCheck projected data to better understand where we can help Sabra and our operators make smart investments to reduce operating costs." [20]
This approach demonstrates how data can be used to mitigate risks while achieving financial and operational efficiency.
Tailoring Solutions to Local Conditions
Another example comes from a publicly traded commercial REIT managing an $8.2 billion portfolio of 120 properties. Between 2024 and 2026, this company adopted a localized, data-driven strategy to address specific regulatory and operational challenges. The REIT evaluated 31 properties for compliance with local building performance standards, such as New York's Local Law 97 and Denver's Building Performance Standards. By analyzing emissions data and estimating retrofit costs, the company identified three properties where compliance expenses and climate risks outweighed the benefits of continued ownership, leading to their sale [3].
To address tenant-related data gaps, the REIT incorporated green lease provisions into 68% of new leases, improving utility monitoring and data collection. This effort expanded environmental data coverage from 38% to 88% of the portfolio's total floor area in just 18 months. The results were substantial: a 14% reduction in portfolio energy intensity over two years, avoidance of approximately $12 million in annual penalties, and a GRESB 5-star rating [3]. By focusing on hyperlocal data and aligning strategies with specific regulations and property needs, the REIT achieved measurable financial savings and environmental benefits, proving the value of precision-driven decision-making.
Conclusion
What Corporate Leaders Should Remember
Turning sustainability goals into reality starts with data. Leaders need to gather insights from climate models, housing market trends, and stakeholder input, then analyze this information to identify risks, opportunities, and areas where compliance may fall short. These insights should be seamlessly integrated into business strategies to drive meaningful action.
Research highlights that sustainable properties command higher premiums compared to inefficient, high-carbon counterparts. By leveraging predictive climate models and localized housing data, companies can make informed decisions to allocate resources effectively, reduce risks, and achieve both environmental and financial gains. This approach transforms sustainability from a regulatory checkbox into a strategic advantage.
How Council Fire Helps Turn Sustainability into Results
Council Fire applies data-driven insights to deliver measurable outcomes. For example, between February 2024 and February 2026, they partnered with a publicly traded REIT to boost property-level environmental data coverage from 38% to 88% in just 18 months. By embedding ESG criteria into investment decisions and creating carbon abatement cost curves, the REIT earned a GRESB 5-star rating and cut portfolio energy intensity by 14% [3].
Their expertise lies in tackling complex data challenges, such as bridging tenant data gaps in real estate portfolios or designing resilience plans that meet federal and state funding requirements. Council Fire integrates sustainability into essential business processes, ensuring each recommendation balances environmental benefits with financial returns. From navigating regulations like New York's Local Law 97 to preparing for TCFD-aligned disclosures or crafting climate adaptation strategies, Council Fire delivers tangible progress through a blend of systems thinking and decades of hands-on experience.
FAQs
What data should we collect first?
To address housing affordability and climate-related risks effectively, begin by gathering comprehensive data on key factors such as supply and demand dynamics, natural disaster trends, and associated property damage costs. Pay close attention to metrics like median home prices, mortgage affordability rates, and statistics on climate impacts, including the frequency and severity of natural disasters. This data serves as the groundwork for pinpointing critical challenges and crafting policies that balance climate resilience with affordable housing solutions.
How do we link climate risk to housing affordability?
Understanding the connection between climate risk and housing affordability involves recognizing how events like floods and wildfires drive up housing costs. These disasters lead to higher insurance premiums and significant property damage, which can make it harder for low- and moderate-income families to find affordable housing.
Tools such as risk indexes play a key role in pinpointing areas most at risk. By using these insights, investments can be directed toward building resilient infrastructure and retrofitting affordable housing. These measures help reduce vulnerability while ensuring housing remains within reach for those who need it most.
How do we turn the analysis into policy fast?
To move from analysis to policy efficiently, leveraging precise, location-specific data is key to crafting actionable strategies. Take Philadelphia as an example: by analyzing housing gap data, the city developed a housing plan in just six months. This plan set clear objectives, such as creating or preserving 30,000 housing units. Similarly, using data-driven methods allows policymakers to pinpoint local opportunities, enabling them to address housing and climate challenges with targeted, effective solutions.
Related Blog Posts
Latest Articles
©2026
Narrative Change and Power Building: The Missing Half of Advocacy
Narrative change is the process of disrupting dominant narratives that normalize inequity and advancing new narratives from historically marginalized communities.
Funding Resilience Without Federal Grants
BRIC is unreliable and FEMA is shrinking. Here's how cities fund climate resilience with dedicated revenue, blended finance, and a coordinating authority.
The ESG Blind Spot: How AI Is Finding Risks in Companies Nobody Else Is Watching
Norway's sovereign wealth fund uses AI to screen 7,200 portfolio companies for forced labor and corruption within 24 hours. The real story is the emerging-market coverage gap that traditional ESG data vendors miss — and what it means for any company with a global supply chain.
FAQ
01
What does it really mean to “redefine profit”?
02
What makes Council Fire different?
03
Who does Council Fire work with?
04
What does working with Council Fire actually look like?
05
How does Council Fire help organizations turn big goals into action?
06
How does Council Fire define and measure success?
07
How does technology fit into Council Fire’s work?
Apr 18, 2026
How to Use Data to Inform Climate and Housing Policy for Corporations
ESG Strategy
In This Article
How companies use climate and housing data to assess risk, target investments, and build resilient, equitable policies.
How to Use Data to Inform Climate and Housing Policy for Corporations
Businesses face a dual challenge: reducing environmental impact while addressing housing needs. The built environment contributes to 40% of global energy-related emissions, and disasters displaced 2.4 million Americans in 2023. Companies must act now by using data to align climate and housing strategies for long-term success.
Key Takeaways:
Data’s Role: Helps identify climate risks, housing gaps, and investment opportunities.
Climate Metrics: Track hazards like wildfire probability, sea-level rise, and heat waves.
Housing Insights: Use metrics like mortgage denial rates and housing affordability to target key areas.
Actionable Steps:
Collect reliable climate and housing data.
Analyze risks and opportunities using predictive models.
Implement policies that integrate climate resilience and housing stability.
Data-driven decisions not only reduce risks but also improve community outcomes and business performance. This article outlines practical strategies to achieve these goals.
3-Step Framework for Data-Driven Climate and Housing Policy
Companies Using Climate Data To Reduce & Report Greenhouse Gas Emissions | Bloomberg Philanthropies
Step 1: Gather the Right Data Sources
Addressing environmental and housing challenges requires starting with the right data. Reliable and diverse data sets form the backbone of actionable climate and housing policies. Without this foundation, strategies risk being imprecise and ineffective.
Climate Data Essentials
To build effective climate policies, focus on three key areas: hazard probability, asset exposure, and vulnerability levels [7]. This involves gathering both historical data and future projections, such as mid-century climate scenarios or models based on a 2°C warming outcome [4][5].
Key climate metrics to track include annual burn probability, sea-level rise, storm surge likelihood, and heat wave frequency [6][7]. For example, wildfire growth rates in the western U.S. more than doubled between 2001 and 2020 due to worsening "fire weather" conditions. This makes wildfire data critical for properties in these regions [7]. Modern wildfire models now even account for wind direction to predict how fires spread from wildlands to developed areas [7].
The U.S. Climate Vulnerability Index (CVI) offers a detailed framework, using 184 indicators across seven categories to assess risk at the census tract level [5]. Public tools like the U.S. Climate Resilience Toolkit, the Fifth National Climate Assessment, and the Climate Mapping for Resilience and Adaptation (CMRA) portal provide access to both historical records and future scenarios [6]. Additionally, the Overture Maps Foundation offers open-source building footprints for 156 million U.S. buildings, helping organizations assess risk without relying on costly proprietary datasets [7].
Combining climate data with "baseline vulnerability" indicators - such as housing characteristics, infrastructure capacity, and social equity metrics - adds depth to your analysis [4][5]. Legal scholar Madison Condon highlights the importance of accessible data:
There's a growing concern that the climate risk information available to individual citizens and municipalities … is limited and expensive to access [7].
The push for "Open Climate Risk" data aims to counter the high costs and inconsistencies of many proprietary models [7]. Once climate risks are understood, the next step is examining housing market data to address affordability and stability issues.
Housing Market Data to Monitor
Housing market data helps identify affordability gaps and areas where stable housing is most at risk. Start with metrics like the gap between median household income and Area Median Income (AMI), housing cost burden (percentage of income spent on housing), and neighborhood-level rental rates [8][9].
For example, in May 2024, Indianapolis used PolicyMap to locate census tracts with mortgage denial rates exceeding 10% and 15%. By layering this data with Moody's Analytics housing gap insights, they identified specific areas in the southern and eastern parts of the city where homeownership barriers persisted despite adequate income levels. This led to targeted credit access programs [8].
Key indicators to track include:
Access and stability metrics: Mortgage denial rates (via HMDA data), eviction filings, foreclosure cases, and utility shutoff records for water, gas, and electricity [8][9].
Supply and adequacy metrics: Housing unit gaps (undersupply vs. surplus), building permit activity, and the age and condition of existing housing stock [8][9].
In Newark, New Jersey, researchers at Rutgers University analyzed residential sales from 1989 to 2020 and found that by 2020, nearly 50% of sales were to institutional buyers - a 300% increase since 2010. This data spurred Mayor Baraka and the Newark Municipal Council to launch a Homeownership Revitalization Program, which prioritized selling city-owned properties to residents at low cost [9].
Median home prices in the Indianapolis metro area surged by 83% since 2013, with a 53% jump since the COVID-19 pandemic began, underscoring how quickly market dynamics can shift [8]. County assessor data can also help track 2-4 unit properties, which often serve as affordable family housing but are at risk of foreclosure or demolition [9].
Dr. Jazmyne McNeese of PolicyMap underscores the importance of community assets:
Quality housing is most effective when paired with strong community assets such as high-performing schools, transit access, healthcare facilities, and job centers [8].
By considering proximity to these assets, you can evaluate housing accessibility beyond just affordability.
Incorporating Stakeholder Input
Quantitative data alone can't capture the full picture. Stakeholder input is essential for understanding community needs, identifying overlooked gaps, and building trust with those most affected by policy decisions.
Successful policy-making involves a collaborative approach, incorporating feedback from both technical users and community stakeholders [4]. Local organizations can provide qualitative insights into on-the-ground risks that models might miss, such as infrastructure gaps, historical inequities, or specific neighborhood concerns [5]. Local data sources often align with smaller planning geographies - like neighborhoods, wards, or boroughs - making them especially valuable [9].
Using multi-layer mapping, combine physical risk data with community asset information to see where risks overlap with resource gaps [8][10]. For example, this approach can highlight areas where communities lack the resources to respond effectively to climate challenges. As investments in climate adaptation grow, stakeholder input becomes increasingly vital for filling data gaps and ensuring policies are both practical and responsive [7]. By integrating these perspectives, organizations can craft strategies that are informed, inclusive, and impactful.
Step 2: Analyze Data to Find What Matters
The next step in leveraging data is turning it into actionable insights by identifying key risks and opportunities. This involves quantifying both physical risks, such as floods and wildfires, and transition risks like carbon pricing and regulatory changes [12][13].
Measuring Environmental Impact
Begin by assessing your organization's carbon footprint across all three scopes of emissions:
Scope 1: Direct emissions from owned sources.
Scope 2: Indirect emissions from purchased electricity and heat.
Scope 3: Emissions across the entire value chain, from suppliers to end-users.
Scope 3 emissions often dominate, making up 75% of total emissions in many industries, and surpassing 90% in sectors like food, mining, and construction [14].
To understand potential outcomes, use climate scenarios to model the effects of moderate to severe warming [12][13]. For instance, Clariant Ltd, a chemical company, uses Task Force on Climate-related Financial Disclosures (TCFD) reporting to inform strategic decisions. Dr. Elias Lützen, Program Manager for Sustainability Transformation at Clariant, noted in June 2025:
Our TCFD reporting not only serves to analyse our risk exposure, but also drives strategic decisions... as changing environmental conditions can consciously inform decision-making and enable future competitive advantages [12].
Similarly, Cemex reduced its carbon emissions per ton by 40% in European operations, leveraging strict climate regulations to refine global solutions [14].
Incorporate location risk intelligence to determine which assets are most vulnerable to extreme weather events like droughts, heat waves, and storm surges [11][12]. Use "Value at Risk" metrics to evaluate property resilience and prioritize investments in adaptation [13].
Assessing Housing Affordability and Access
In parallel, housing data can uncover socioeconomic vulnerabilities. Analyzing affordability involves examining cost burdens and access barriers. Households spending 30–49.9% of income on housing are classified as "cost burdened", while those spending over 50% are deemed "extremely cost burdened" [1].
In August 2025, Dr. Jazmyne McNeese utilized PolicyMap's extensive indicators for a housing needs assessment in Indianapolis. This analysis revealed census tracts with mortgage denial rates above 15% and significant housing shortages, particularly in urban areas where median home prices had surged 53% since the onset of the COVID-19 pandemic [8]. Overlaying this data with income metrics pinpointed areas where access barriers were highest.
To further refine these insights, calculate housing unit gaps by comparing current vacancy rates to benchmarks. For example, Philadelphia uses 7.41% for owners and 2.47% for renters as equilibrium rates [1]. Combining this with mortgage denial data from the Home Mortgage Disclosure Act (HMDA) highlights areas where demand exists but access remains restricted.
When analyzing climate-vulnerable areas, consider the Total Replacement Value of structures rather than market value. This approach avoids bias toward wealthier areas and accounts for the effects of historical disinvestment in lower-income neighborhoods and communities of color [15].
Creating Visual Models and Scenarios
Once you've quantified environmental and housing challenges, synthesize these findings into visual models to guide decision-making. Multi-layer mapping can combine data on climate risks, housing shortages, income levels, and public land availability to identify the most impactful intervention points [8][1].
In July 2025, Philadelphia launched the "Housing Opportunities Made Easy" (H.O.M.E.) initiative, a $2 billion plan to create or preserve 30,000 housing units. Using data from Moody's Analytics and PolicyMap, the city identified acute housing shortages at the census tract level. By overlaying building permits and occupancy certificates, the team ensured that development efforts aligned with identified needs. This data-driven approach enabled Philadelphia to secure $800 million in bonds by demonstrating specific, evidence-based needs across neighborhoods [1].
Employ both top-down and bottom-up scenario analyses to balance macro goals like net-zero targets with granular, asset-level insights. For example, a global commodities finance bank collaborated with EY-Parthenon to design net-zero strategies while measuring greenhouse gas emissions at the client level. These metrics were integrated into the bank's capital allocation and credit portfolio processes to guide growth [17].
Finally, create public-facing dashboards to share progress transparently. This not only informs the community but also encourages participation in tracking initiatives [1]. Organizations taking this proactive, data-driven approach - labeled "Pacesetters" in climate action - are 1.8 times more likely to report higher-than-expected financial returns from their initiatives compared to less active peers [14].
Step 3: Turn Data into Policy and Action
Once climate risks and housing vulnerabilities are analyzed, the next step is turning these insights into actionable policies. This means moving beyond raw data to build strategies that protect assets, support communities, and address the interconnected challenges of climate and housing.
Building Climate Adaptation Plans
Adaptation planning requires forward-thinking building standards that account for future risks rather than relying on outdated data. Since 1980, extreme weather events have cost the U.S. economy more than $2.7 trillion [2]. Despite this, many building codes still rely on historical climate patterns, leaving new developments exposed to escalating risks.
One effective approach is adopting FORTIFIED construction standards, created by the Insurance Institute for Business & Home Safety. For instance, Alabama’s "Strengthen Alabama Homes" program retrofitted homes to meet these standards after Hurricane Sally, leading to a 55–74% reduction in loss frequency and a 14–40% decrease in loss severity. These measures potentially saved $32.6 million in deductibles [2]. While resilient construction can increase costs by 30% to 50%, partnerships with state governments and insurers can help create subsidy programs to make these upgrades more affordable.
In California, the Department of Insurance took a proactive step in 2022 by requiring premium discounts for homeowners who implement wildfire safety measures. This policy directly incentivizes risk reduction at the property level [2].
Using Stakeholder Feedback in Policy Design
Between 2020 and 2024, the percentage of companies aligning their advocacy with science-based guidance tripled, rising from 5% to 15% [18]. Achieving this kind of alignment requires ongoing collaboration with industry partners, government entities, and local communities, all while applying the insights gained from data analysis.
Iberdrola, under the leadership of Gonzalo Sáenz de Miera, Director of Climate Change and Alliances, has embraced this collaborative approach to tackle what he calls the "trilemma" of sustainability, social impact, and competitiveness:
"Climate change is far too complex and important of an issue for any company to address alone, and Iberdrola has built our strategic alliances to address a trilemma of related issues: sustainability, social impact, and competitiveness." [18]
Unilever offers another example of effective stakeholder engagement. Through annual reviews of its industry association memberships, the company ensures alignment with its climate transition goals. Fiona Duggan, Global Sustainability Senior Manager at Unilever, explained:
"When our trade associations aren't aligned with our climate transition plans, that's not good value for our money. Misalignment means we're invested in an association, but it is not reflecting our values or our business needs." [18]
Conducting regular audits of trade association memberships and implementing Climate Transition Action Plans can help maintain transparency and ensure that stakeholder engagement aligns with sustainability objectives.
Applying Systems Thinking to Connect the Dots
Addressing climate and housing challenges requires a systems-thinking approach that considers the broader connections between land-use decisions, financial markets, and governance [2]. The U.S. housing market, valued at approximately $48 trillion [16], includes residential properties at flood risk that may be overvalued by more than $200 billion [2]. This highlights the need for coordinated, large-scale action.
Rising insurance and reinsurance costs serve as a clear signal for urgent adaptation. Between 2020 and 2023, average nominal property insurance premiums rose by 33% [16], reflecting the market's response to evolving climate risks.
Regional resilience strategies often prove more effective than isolated property-level solutions. For example, Copenhagen’s plan for carbon neutrality by 2025 combines cycling infrastructure with district heating networks powered by renewable energy [19]. Similarly, Singapore uses real-time sensor networks and public-private stakeholder forums to manage its limited space efficiently [19]. These examples demonstrate how standardized building codes, stakeholder collaboration, and comprehensive adaptation strategies can drive meaningful change.
Case Study: Data-Driven Climate and Housing Strategy in Action
This case study highlights how leveraging data can transform insights into actionable strategies, addressing both climate challenges and housing needs.
Protecting Housing Finance from Climate Risks
In March 2025, Sabra Health Care REIT revamped its approach to climate risk management across its portfolio of skilled nursing and senior housing facilities. Under the leadership of EVP of Asset Management Peter Nyland, the company integrated hazard data from ClimateCheck into its due diligence and portfolio management processes. Rather than viewing climate assessments as a regulatory formality, Sabra used predictive data to pinpoint properties most vulnerable to risks like wildfires, extreme heat, and flooding. This enabled the company to prioritize cost-effective upgrades for these high-risk properties.
As part of this initiative, Sabra established the $5 million "Green Links Fund", which provided full upfront financing for energy and water efficiency upgrades across its operator network. Operators were able to implement improvements such as HVAC upgrades, LED lighting installations, and water-saving systems without bearing the initial costs. The fund was repaid through the utility savings generated by these enhancements [20]. Nyland explained the strategy:
"Climate risk is operating risk. Whether it is an acquisition, repurposing a facility, or energy retrofit. We're using ClimateCheck projected data to better understand where we can help Sabra and our operators make smart investments to reduce operating costs." [20]
This approach demonstrates how data can be used to mitigate risks while achieving financial and operational efficiency.
Tailoring Solutions to Local Conditions
Another example comes from a publicly traded commercial REIT managing an $8.2 billion portfolio of 120 properties. Between 2024 and 2026, this company adopted a localized, data-driven strategy to address specific regulatory and operational challenges. The REIT evaluated 31 properties for compliance with local building performance standards, such as New York's Local Law 97 and Denver's Building Performance Standards. By analyzing emissions data and estimating retrofit costs, the company identified three properties where compliance expenses and climate risks outweighed the benefits of continued ownership, leading to their sale [3].
To address tenant-related data gaps, the REIT incorporated green lease provisions into 68% of new leases, improving utility monitoring and data collection. This effort expanded environmental data coverage from 38% to 88% of the portfolio's total floor area in just 18 months. The results were substantial: a 14% reduction in portfolio energy intensity over two years, avoidance of approximately $12 million in annual penalties, and a GRESB 5-star rating [3]. By focusing on hyperlocal data and aligning strategies with specific regulations and property needs, the REIT achieved measurable financial savings and environmental benefits, proving the value of precision-driven decision-making.
Conclusion
What Corporate Leaders Should Remember
Turning sustainability goals into reality starts with data. Leaders need to gather insights from climate models, housing market trends, and stakeholder input, then analyze this information to identify risks, opportunities, and areas where compliance may fall short. These insights should be seamlessly integrated into business strategies to drive meaningful action.
Research highlights that sustainable properties command higher premiums compared to inefficient, high-carbon counterparts. By leveraging predictive climate models and localized housing data, companies can make informed decisions to allocate resources effectively, reduce risks, and achieve both environmental and financial gains. This approach transforms sustainability from a regulatory checkbox into a strategic advantage.
How Council Fire Helps Turn Sustainability into Results
Council Fire applies data-driven insights to deliver measurable outcomes. For example, between February 2024 and February 2026, they partnered with a publicly traded REIT to boost property-level environmental data coverage from 38% to 88% in just 18 months. By embedding ESG criteria into investment decisions and creating carbon abatement cost curves, the REIT earned a GRESB 5-star rating and cut portfolio energy intensity by 14% [3].
Their expertise lies in tackling complex data challenges, such as bridging tenant data gaps in real estate portfolios or designing resilience plans that meet federal and state funding requirements. Council Fire integrates sustainability into essential business processes, ensuring each recommendation balances environmental benefits with financial returns. From navigating regulations like New York's Local Law 97 to preparing for TCFD-aligned disclosures or crafting climate adaptation strategies, Council Fire delivers tangible progress through a blend of systems thinking and decades of hands-on experience.
FAQs
What data should we collect first?
To address housing affordability and climate-related risks effectively, begin by gathering comprehensive data on key factors such as supply and demand dynamics, natural disaster trends, and associated property damage costs. Pay close attention to metrics like median home prices, mortgage affordability rates, and statistics on climate impacts, including the frequency and severity of natural disasters. This data serves as the groundwork for pinpointing critical challenges and crafting policies that balance climate resilience with affordable housing solutions.
How do we link climate risk to housing affordability?
Understanding the connection between climate risk and housing affordability involves recognizing how events like floods and wildfires drive up housing costs. These disasters lead to higher insurance premiums and significant property damage, which can make it harder for low- and moderate-income families to find affordable housing.
Tools such as risk indexes play a key role in pinpointing areas most at risk. By using these insights, investments can be directed toward building resilient infrastructure and retrofitting affordable housing. These measures help reduce vulnerability while ensuring housing remains within reach for those who need it most.
How do we turn the analysis into policy fast?
To move from analysis to policy efficiently, leveraging precise, location-specific data is key to crafting actionable strategies. Take Philadelphia as an example: by analyzing housing gap data, the city developed a housing plan in just six months. This plan set clear objectives, such as creating or preserving 30,000 housing units. Similarly, using data-driven methods allows policymakers to pinpoint local opportunities, enabling them to address housing and climate challenges with targeted, effective solutions.
Related Blog Posts
Latest Articles
©2026
Narrative Change and Power Building: The Missing Half of Advocacy
Narrative change is the process of disrupting dominant narratives that normalize inequity and advancing new narratives from historically marginalized communities.
Funding Resilience Without Federal Grants
BRIC is unreliable and FEMA is shrinking. Here's how cities fund climate resilience with dedicated revenue, blended finance, and a coordinating authority.
The ESG Blind Spot: How AI Is Finding Risks in Companies Nobody Else Is Watching
Norway's sovereign wealth fund uses AI to screen 7,200 portfolio companies for forced labor and corruption within 24 hours. The real story is the emerging-market coverage gap that traditional ESG data vendors miss — and what it means for any company with a global supply chain.
FAQ
What does it really mean to “redefine profit”?
What makes Council Fire different?
Who does Council Fire work with?
What does working with Council Fire actually look like?
How does Council Fire help organizations turn big goals into action?
How does Council Fire define and measure success?
How does technology fit into Council Fire’s work?