
Apr 9, 2026
How to Use Data to Inform Climate and Housing Policy for Municipalities & Government Agencies
Capacity Building
In This Article
How municipalities use local climate, housing, and equity data to target risks, retrofit homes, plan safe development, and measure results.
How to Use Data to Inform Climate and Housing Policy for Municipalities & Government Agencies
Data is the key to solving housing shortages and addressing climate risks effectively. By using local datasets like building permits, tax records, and climate risk tools, municipalities can make smarter decisions, allocate resources efficiently, and help the communities most in need. Here's a quick breakdown of how data can guide policy:
Assess Risks: Use tools like FEMA's Resilience Analysis and Planning Tool (RAPT) and the National Risk Index to evaluate climate and housing vulnerabilities.
Identify Vulnerable Communities: Combine socioeconomic and climate risk data to locate areas with the greatest needs.
Improve Existing Housing: Target retrofits and energy upgrades in underserved areas while preventing displacement.
Plan New Developments: Use climate projections to select safer sites and design resilient housing.
Measure Impact: Track progress with clear metrics like energy savings, housing affordability, and disaster resilience.
With over $370 billion in federal funding available for climate and housing projects, data-driven strategies are essential for securing resources and achieving long-term solutions. Every $1 spent on hazard mitigation saves $6 in disaster-related costs - making data a powerful tool for policy success.
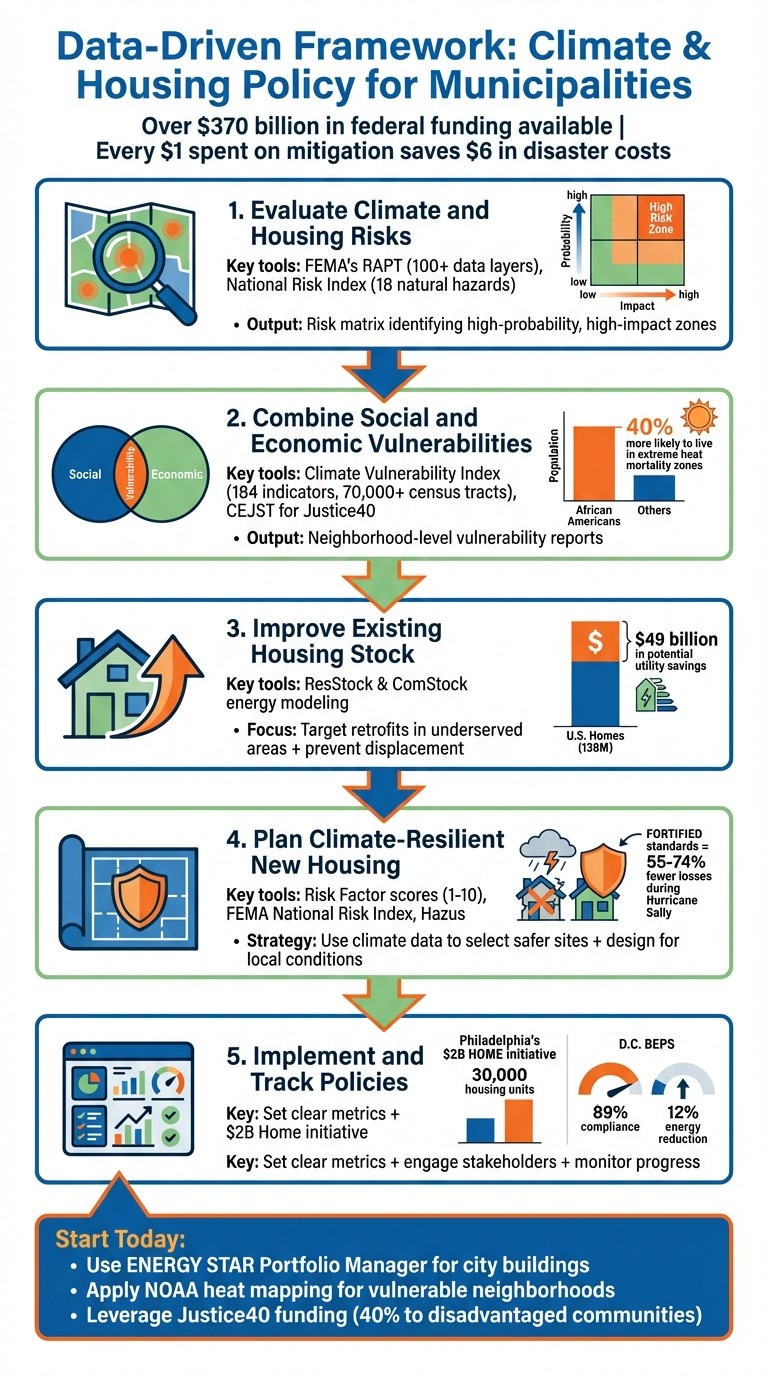
5-Step Data-Driven Framework for Climate-Resilient Housing Policy
Step 1: Evaluate Climate and Housing Risks
Federal Tools for Risk Assessment
Municipalities have access to several federal tools designed to help assess climate and housing vulnerabilities. One of the most comprehensive resources is FEMA's Resilience Analysis and Planning Tool (RAPT). This GIS-based web map integrates over 100 data layers, covering everything from population demographics to critical infrastructure and natural hazards [5][8]. Additionally, the National Risk Index (NRI) provides baseline risk measurements for 18 natural hazards at both county and census tract levels. The latest update, version 1.20 from December 2025, includes improved data on hazards like tsunamis, inland flooding, landslides, and earthquakes [6].
Other tools, such as CMRA, offer climate projections for five key hazards while also linking to federal funding opportunities. Meanwhile, the CRE platform provides neighborhood-level social vulnerability metrics, with specialized datasets like "CRE for Heat" and "CRE for Response", which were most recently updated on April 7, 2026 [4][7].
Once these tools are utilized for assessing risks, the next step is to evaluate the economic and housing impacts of these vulnerabilities.
Measure Economic and Housing Impacts
The Expected Annual Loss (EAL) metric from the National Risk Index is a valuable tool for estimating the economic toll of natural hazards on local property and agriculture. It calculates this by multiplying the probability of a hazard occurring by its financial and social consequences, making it easier to identify "High-High" risk zones [6][9]. By integrating this data with local property values using RAPT, municipalities can visualize the severity of risks across neighborhoods. This process enables local governments to create a risk matrix that pinpoints areas with both high event probabilities and significant potential losses [9].
For a more detailed analysis, municipalities can develop an asset vulnerability spreadsheet. This document should catalog assets, assigning ratings for their impact, sensitivity, and capacity to adapt. To standardize assessments, classify events likely to occur within five years as "high probability" and those expected every 5 to 20 years as "medium probability." Estimating the potential magnitude of loss can be achieved by analyzing recent local hazard events or referencing recovery costs from comparable communities [9].
The next step involves identifying the specific communities most at risk.
Find Vulnerable Communities
Combining climate risk data with socioeconomic factors helps identify neighborhoods facing the greatest threats. Tools like the CRE Viewer and the "Neighborhoods at Risk" tool allow municipalities to map areas where high social vulnerability intersects with significant disaster costs [3][7].
This analysis also reveals potential cascading failures. For example, damage to a critical asset like a bridge could disrupt interconnected systems, amplifying the overall risk [9]. Municipalities can access these resources through official government websites, download National Risk Index data via OpenFEMA, and get additional guidance from FEMA's technical support team at FEMA-NRI@fema.dhs.gov [6].
Step 2: Combine Social and Economic Vulnerabilities
How Inequality Increases Climate Risks
Climate risks hit some communities harder than others. Systemic issues like discriminatory housing policies, unequal labor market opportunities, and gaps in environmental protections have deepened vulnerabilities, leaving certain groups less equipped to cope with the impacts of climate change [12][13]. For instance, African Americans are 40% more likely to reside in areas where extreme temperatures significantly increase mortality rates [13]. In the U.S., race is a stronger predictor than income for determining the placement of toxic facilities [13].
"Better understanding of the intersections between growing climate risks and pre-existing, long-term health, social, environmental, and economic conditions is critical to effectively building climate resilience for everyone." - Environmental Defense Fund [12]
These compounded vulnerabilities amplify the effects of climate events. A neighborhood lacking quality housing, green spaces, and located near toxic sites will struggle far more during heatwaves or floods compared to wealthier areas with better infrastructure [12][13]. To address this, municipalities need to evaluate cumulative impacts when assessing climate risks.
The next step involves standardizing these findings using environmental justice metrics.
Apply Environmental Justice Indexes
To address disparities, environmental justice indexes can help quantify local climate vulnerabilities. The U.S. Climate Vulnerability Index (CVI), for example, uses 184 indicators to rank over 70,000 U.S. Census tracts. This approach provides a detailed picture of how health, social, economic, and infrastructure stressors intersect with climate risks [12][13]. By focusing on census tracts - each averaging 4,000 people - this tool uncovers hyperlocal patterns that broader county-level data often misses [10].
For federal funding initiatives, particularly those tied to Justice40, the Climate & Economic Justice Screening Tool (CEJST) is invaluable. This tool identifies disadvantaged communities based on two criteria: an environmental burden threshold (90th percentile for hazards like flooding or wildfire risk) and a socioeconomic threshold (65th percentile for low income) [14]. This dual requirement ensures that resources are directed to the most affected areas rather than being spread too thinly.
Build Neighborhood-Level Vulnerability Reports
Once standardized indexes are in place, the next step is to create neighborhood-level vulnerability reports by merging multiple datasets. Converting data into percentiles allows for a unified comparison scale, integrating indicators like poverty rates, asthma prevalence, housing cost burdens, and flood risks into a single analysis [10]. Key data sources include the American Community Survey (ACS), FEMA's National Risk Index, and the CDC's PLACES database [14].
Housing-related indicators are especially insightful for assessing a neighborhood's adaptability. Factors such as the lack of central air conditioning, high renter populations, mobile homes, housing costs exceeding 30% of income, and older homes with potential lead paint risks (built before 1960) are essential to include [11][14]. Richmond's Climate Equity Index is a strong example of this approach, combining 39 factors - spanning health, income, housing, and demographics - to measure vulnerability at the census tract level [11].
These detailed reports can guide targeted actions, such as prioritizing neighborhoods for weatherization programs, establishing cooling centers, or building flood mitigation infrastructure. They also highlight critical data gaps, like the effects of climate change on tribal lands or maternal health outcomes, which require further study and policy focus [12][10].
Step 3: Improve Existing Housing Stock
Select Properties for Climate Upgrades
To make meaningful climate upgrades, start by identifying specific buildings using detailed and precise data. Tools like ResStock (for residential buildings) and ComStock (for commercial properties) are invaluable resources for municipalities. These open-source energy modeling platforms analyze energy usage down to individual facilities and systems, helping pinpoint neighborhoods and building types - such as single-family homes or smaller multi-unit buildings - that hold the greatest potential for energy savings and electrification [16][15].
Customizing these models with local data can significantly enhance their effectiveness. For instance, Chicago used ResStock, incorporating actual utility data, to identify retrofit packages capable of achieving over 50% energy savings. This approach also helped target neighborhoods with high electrification potential [15]. As Janet Reyna, a researcher at NREL, explains:
"You need to be able to understand what's actually driving energy use to be able to know what to improve. If you don't have that sort of detailed, disaggregated analysis, you're kind of shooting in the dark" [16].
Equity is a crucial factor in this process. Prioritize properties in underserved communities by combining equity metrics with energy savings data [17]. Across the 138 million homes in the U.S., there’s an estimated $49 billion in potential utility savings [16]. However, achieving these savings requires targeted, data-driven strategies that focus on areas where they can make the biggest difference. This groundwork also helps inform updates to housing codes that align with these improvements.
Update Housing Codes for Climate Resilience
Local housing codes should be examined for vulnerabilities to risks like wind, flooding, and extreme heat, with updates made to enhance energy and water efficiency while maintaining health and safety standards [18]. A multi-hazard approach is essential - flood resilience measures, for example, should not undermine protections against heat or wind [18]. These updates work hand-in-hand with targeted retrofits to ensure long-term climate resilience and adaptability.
Prevent Displacement During Climate Upgrades
While climate upgrades are vital, they can unintentionally lead to resident displacement. In some Massachusetts communities, for example, no-cause evictions and rent hikes exceeding 20% have followed property improvements [20]. To prevent such outcomes, proactive measures must be taken.
Strategies include enforcing affordability covenants, creating tenant habitability plans, and closely monitoring eviction rates [19][20]. The Residential Retrofits for Energy Equity (R2E2) initiative offers a model for aligning energy efficiency goals with tenant protections, ensuring rent increases and displacement are avoided [19]. Policies like just-cause eviction protections and restrictions on passing upgrade costs to tenants can further safeguard residents during these transitions [19][20].
Climate Action in Practice: How Data, AI, and Advocacy Are Reshaping Policy
Step 4: Plan Climate-Resilient New Housing
This step builds on previous risk assessments and vulnerability analyses, focusing on how to use climate data to select safer development sites, design durable buildings, and avoid construction in high-risk areas.
Choose Development Sites Using Climate Data
When planning new housing, leveraging detailed climate data is critical for identifying secure locations. By overlaying downscaled climate projections - such as NOAA sea level rise data or LOCA2 precipitation patterns - with parcel and infrastructure data in GIS tools, planners can pinpoint parcels with minimal climate risks while flagging areas that should remain undeveloped for safety reasons[22].
Several tools provide the granular insights needed for informed decisions:
Risk Factor by First Street Foundation assigns properties a Flood Factor and Fire Factor score (from 1 to 10) based on a 30-year risk projection[23].
FEMA's National Risk Index offers data on 18 natural hazards at the county and census tract levels.
Resilience Analysis and Planning Tool (RAPT) integrates hazard data with over 100 layers of population and infrastructure information[25].
Hazus, now integrated with ArcGIS Pro, estimates potential losses from floods, hurricanes, and tsunamis for property-specific assessments[24].
To manage risk, municipalities can use tools like the Transfer of Development Rights (TDR) system to focus development on safer parcels while preserving flood-prone areas[21]. Similarly, creating Wildfire Lands Overlays within urban growth boundaries can regulate construction in fire-prone zones. Before approving any development, conducting thorough audits of landslide and flood-prone areas can help evaluate potential climate impacts[21].
This data-driven approach ensures that housing is built on safer ground, forming the basis for climate-resilient design.
Design for Local Climate Conditions
Adapting building codes to reflect future climate realities is a key step. For instance, a Mid-Atlantic coastal city updated its floodplain regulations in February 2026 to mandate 3 feet of freeboard and restrict new critical facilities within the 500-year floodplain. This update secured $14.7 million in grants with a 4.2:1 benefit-cost ratio[22].
Frameworks like the American Society of Civil Engineers' ASCE 24-05 for flood-resistant design and the FORTIFIED standards for wind, hail, and hurricane resilience offer proven guidelines[21][26]. Alabama’s "Strengthen Alabama Homes" program demonstrated the impact of these measures: homes built to FORTIFIED standards experienced 55% to 74% fewer losses and reduced loss severity by 14% to 40% during Hurricane Sally in 2020. If applied universally, this could have saved policyholders $32.6 million in deductibles[26].
Incorporating passive cooling strategies such as natural ventilation and shading, along with nature-based solutions like living shorelines, bioswales, and rain gardens, can also improve resilience. For example, a Mid-Atlantic coastal city installed 1.2 miles of living shorelines, which reduced wave energy by 40–60% during storm events[22].
Prevent Construction in High-Risk Zones
Even the most resilient designs lose their effectiveness if built in hazardous locations. Preventing development in high-risk zones is essential for long-term safety. Tools like the Climate Mapping for Resilience and Adaptation (CMRA) provide future climate projections across hazards like drought, wildfire, and coastal flooding[4]. The Neighborhoods at Risk tool combines climate data with socioeconomic insights to guide land-use decisions[3].
Overlay zoning can help enforce these restrictions by clearly marking boundaries for wildfire-prone areas and flood zones. Municipalities can also limit impervious surfaces in new developments to reduce stormwater runoff and mitigate urban heat island effects[21].
Finally, running multi-scenario models for timeframes such as 2030, 2050, and 2100 under varying emissions scenarios provides a broader view of potential climate futures. This ensures that housing developments built today remain safe and viable for decades to come[22].
Step 5: Implement and Track Policies
With a thorough understanding of risks and vulnerabilities from earlier steps, the focus now shifts to transforming data insights into actionable policies. This involves strategic resource allocation, establishing clear metrics for success, and fostering collaboration across sectors to ensure policies achieve their intended impact.
Structure Policies for Maximum Impact
Data should be the cornerstone for deciding where and how resources are deployed. For example, Philadelphia's "Housing Opportunities Made Easy" (HOME) initiative, launched in July 2024, is a $2 billion effort to create or preserve 30,000 housing units. By leveraging Moody's Analytics Housing Gap data, the city identified that 78% of the housing need must be addressed to meet this goal. The initiative strategically allocates $800 million in bonds and $1 billion in public land, targeting investments based on income levels and specific neighborhood shortages [27].
"Sound data is essential for effective policy and strategic resource allocation." – Angela Brooks, Chief Housing & Urban Development Officer, City of Philadelphia [27]
To maximize impact, overlay various data layers, such as housing shortage maps, flood zones, and environmental justice metrics, to pinpoint high-priority areas. Tools like Market Value Analysis can help gauge neighborhood market strength, ensuring public land sales are tailored appropriately and avoiding unnecessary subsidies in strong markets [27]. Cross-agency collaboration is also key - integrating data from housing, planning, and utilities can break down silos and offer a more holistic view of community needs [1].
Once policies are structured, it’s essential to define metrics that measure their effectiveness.
Set Metrics to Measure Success
Clear, measurable indicators are vital for tracking progress. For instance, Washington D.C.'s Building Energy Performance Standards (BEPS), enacted in 2021, required buildings over 50,000 square feet to meet energy targets or face fines. By 2024, this policy achieved an 89% compliance rate and a 12% average reduction in energy use across the city’s building portfolio [28].
Portland, Oregon, offers another example. Between 2005 and 2024, the city reduced vehicle miles traveled (VMT) per capita by 14%, even as its population grew by 28%. This was achieved through an Urban Growth Boundary combined with transit-oriented development incentives, avoiding nearly 890,000 metric tons of CO₂ emissions [28]. Tracking data at granular levels, such as neighborhoods or parcels, improves accuracy, as national datasets often miss the nuances of smaller geographies [1].
For housing policies, monitor affordability by tracking metrics like cost burden rates (households spending more than 30% or 50% of income on housing), median sale prices, and rent levels. Use tax assessor data and rental registries for precision. Housing stability can be assessed through eviction filings, foreclosure rates, and utility shutoffs, using data from court records and utility companies [1]. Additionally, overlay building permits and certificates of occupancy on housing shortage maps to confirm whether development aligns with identified needs [27].
Engaging stakeholders is the next critical step to ensure these metrics translate into meaningful action.
Work with Stakeholders on Implementation
Successful implementation hinges on collaboration with property managers, developers, community organizations, and residents. A Mid-Atlantic coastal city of 28,000 residents demonstrated this through a three-tier engagement process: community surveys (with a 22% response rate), neighborhood workshops offering childcare and translation services, and an 18-member advisory committee. This approach led to unanimous adoption of a resilience plan and the acquisition of $14.7 million in federal and state grants within 18 months [22].
Community co-design has proven to be especially effective. Programs developed with extensive community input achieved 2.3 times the emissions reductions compared to those created through technical consultations alone [28]. In Boston, the Green Ribbon Commission - a public-private governance structure established in 2010 - has sustained climate action across multiple mayoral administrations, helping the city meet its 2020 emissions reduction target two years ahead of schedule [28].
Reaching vulnerable populations requires embedding feedback mechanisms into existing services. For example, Philadelphia Community Legal Services and the Housing Initiative at Penn included a survey in the city’s emergency rental assistance application during 2022–2023. This effort collected over 6,000 responses, creating the largest renter dataset in the city’s history [1]. Similarly, Boulder County, Colorado, implemented data-sharing between its Homeless Management Information System and "Boulder County Connect", enabling service providers to better match resources to individual needs through case conferencing [1].
Transparency is also vital. Public-facing dashboards can show how policy-funded activities align with original data-driven targets, building trust within the community [27]. Partnering with academic institutions or consultancies for independent reviews of emissions inventories and policy outcomes can further enhance credibility with both the public and investors [28].
Conclusion: From Data to Policy Action
Main Points to Remember
This guide has shown how municipalities can use data-driven strategies to tackle the interconnected challenges of climate change and housing. The foundation of effective policy lies in combining demographic, economic, housing, and environmental data to uncover overlapping issues [2][29]. Local administrative records, such as building permits, tax assessments, and 311 complaints, provide more timely and detailed insights than national datasets [1].
Equity must remain a priority. Data can expose how past injustices have amplified climate risks, enabling policymakers to address these disparities [1][29]. Incorporating spatial analytics (GIS) throughout the policymaking process - from assessments to implementation and monitoring - ensures a more dynamic and responsive approach, rather than treating GIS as a one-time tool [29].
Collaboration across departments is equally critical. Housing, planning, utilities, and human services must share data through formal agreements to create a holistic understanding of community needs [1][29]. Where data gaps exist, partnerships with local universities or organizations can help analyze complex datasets and enhance technical expertise [1].
With these principles in place, the next step is to turn insights into actionable policies using the tools and resources already available.
Start Using Data Today
Begin taking action now. Use tools like ENERGY STAR Portfolio Manager to evaluate city-owned buildings and identify the top 10 energy consumers for retrofitting [32]. Apply NOAA heat island mapping to locate vulnerable neighborhoods in need of tree planting and cooling centers [32]. Leverage program intake forms, such as those for emergency rental assistance, to collect valuable information on housing conditions and tenant needs [1].
"Local residents and community-driven organizations are best positioned to gather and interpret data, yielding the most effective solutions." - Urban Institute [30]
The federal government has made over $370 billion available through the Inflation Reduction Act and Bipartisan Infrastructure Law for climate and clean energy projects [32]. With Justice40 requirements ensuring that 40% of benefits go to disadvantaged communities, data-driven vulnerability assessments are crucial for securing this funding and directing resources to where they are most needed [32]. It’s worth remembering: every $1 spent on hazard mitigation saves $6 in disaster-related costs [31].
FAQs
What local data should we collect first to start this work?
To start crafting climate and housing policies, gather detailed local data that reflects your community's housing conditions and environmental challenges. Pay attention to demographic and economic information, including population makeup, income distribution, housing availability, and affordability. Tap into resources like permitting records, property sales data, and community surveys. Geographic Information System (GIS) tools and census data can be invaluable for pinpointing geographic inequalities and environmental vulnerabilities, such as areas prone to flooding or regions with excessive energy consumption.
How do we combine climate risk and equity data to pick priority neighborhoods?
To effectively prioritize neighborhoods, integrate climate risk data with equity metrics by mapping social vulnerabilities such as income levels and housing stability alongside climate-related threats like flooding or extreme heat. Employ frameworks centered on equity to examine disparities, then layer this analysis with climate data. This approach allows for resilience strategies tailored to each neighborhood, ensuring resources are distributed fairly and interventions are directed toward the communities most at risk.
How can we fund retrofits without causing rent hikes or displacement?
Funding retrofits in a way that avoids rent increases or tenant displacement relies on leveraging various federal and state programs, such as HUD initiatives, climate-focused grants, and local government funding. By using data-driven planning, upgrades can be prioritized to maximize efficiency and impact. Engaging the community throughout the process and implementing policies like rent caps during construction projects further safeguard tenants. This combination of strategies ensures energy-efficient improvements are made without placing financial strain on residents or forcing them to relocate.
Related Blog Posts
How to Build a Climate Resilience Plan for Municipalities & Government Agencies
How to Integrate Climate Risk into Infrastructure Planning for Municipalities & Government Agencies
How to Conduct Vulnerability Assessment & Equity Mapping for Municipalities & Government Agencies
How to Embed Equity in Local Resilience Planning for Municipalities & Government Agencies
Latest Articles
©2025


FAQ
01
What does it really mean to “redefine profit”?
02
What makes Council Fire different?
03
Who does Council Fire you work with?
04
What does working with Council Fire actually look like?
05
How does Council Fire help organizations turn big goals into action?
06
How does Council Fire define and measure success?
Apr 9, 2026
How to Use Data to Inform Climate and Housing Policy for Municipalities & Government Agencies
Capacity Building
In This Article
How municipalities use local climate, housing, and equity data to target risks, retrofit homes, plan safe development, and measure results.
How to Use Data to Inform Climate and Housing Policy for Municipalities & Government Agencies
Data is the key to solving housing shortages and addressing climate risks effectively. By using local datasets like building permits, tax records, and climate risk tools, municipalities can make smarter decisions, allocate resources efficiently, and help the communities most in need. Here's a quick breakdown of how data can guide policy:
Assess Risks: Use tools like FEMA's Resilience Analysis and Planning Tool (RAPT) and the National Risk Index to evaluate climate and housing vulnerabilities.
Identify Vulnerable Communities: Combine socioeconomic and climate risk data to locate areas with the greatest needs.
Improve Existing Housing: Target retrofits and energy upgrades in underserved areas while preventing displacement.
Plan New Developments: Use climate projections to select safer sites and design resilient housing.
Measure Impact: Track progress with clear metrics like energy savings, housing affordability, and disaster resilience.
With over $370 billion in federal funding available for climate and housing projects, data-driven strategies are essential for securing resources and achieving long-term solutions. Every $1 spent on hazard mitigation saves $6 in disaster-related costs - making data a powerful tool for policy success.
5-Step Data-Driven Framework for Climate-Resilient Housing Policy
Step 1: Evaluate Climate and Housing Risks
Federal Tools for Risk Assessment
Municipalities have access to several federal tools designed to help assess climate and housing vulnerabilities. One of the most comprehensive resources is FEMA's Resilience Analysis and Planning Tool (RAPT). This GIS-based web map integrates over 100 data layers, covering everything from population demographics to critical infrastructure and natural hazards [5][8]. Additionally, the National Risk Index (NRI) provides baseline risk measurements for 18 natural hazards at both county and census tract levels. The latest update, version 1.20 from December 2025, includes improved data on hazards like tsunamis, inland flooding, landslides, and earthquakes [6].
Other tools, such as CMRA, offer climate projections for five key hazards while also linking to federal funding opportunities. Meanwhile, the CRE platform provides neighborhood-level social vulnerability metrics, with specialized datasets like "CRE for Heat" and "CRE for Response", which were most recently updated on April 7, 2026 [4][7].
Once these tools are utilized for assessing risks, the next step is to evaluate the economic and housing impacts of these vulnerabilities.
Measure Economic and Housing Impacts
The Expected Annual Loss (EAL) metric from the National Risk Index is a valuable tool for estimating the economic toll of natural hazards on local property and agriculture. It calculates this by multiplying the probability of a hazard occurring by its financial and social consequences, making it easier to identify "High-High" risk zones [6][9]. By integrating this data with local property values using RAPT, municipalities can visualize the severity of risks across neighborhoods. This process enables local governments to create a risk matrix that pinpoints areas with both high event probabilities and significant potential losses [9].
For a more detailed analysis, municipalities can develop an asset vulnerability spreadsheet. This document should catalog assets, assigning ratings for their impact, sensitivity, and capacity to adapt. To standardize assessments, classify events likely to occur within five years as "high probability" and those expected every 5 to 20 years as "medium probability." Estimating the potential magnitude of loss can be achieved by analyzing recent local hazard events or referencing recovery costs from comparable communities [9].
The next step involves identifying the specific communities most at risk.
Find Vulnerable Communities
Combining climate risk data with socioeconomic factors helps identify neighborhoods facing the greatest threats. Tools like the CRE Viewer and the "Neighborhoods at Risk" tool allow municipalities to map areas where high social vulnerability intersects with significant disaster costs [3][7].
This analysis also reveals potential cascading failures. For example, damage to a critical asset like a bridge could disrupt interconnected systems, amplifying the overall risk [9]. Municipalities can access these resources through official government websites, download National Risk Index data via OpenFEMA, and get additional guidance from FEMA's technical support team at FEMA-NRI@fema.dhs.gov [6].
Step 2: Combine Social and Economic Vulnerabilities
How Inequality Increases Climate Risks
Climate risks hit some communities harder than others. Systemic issues like discriminatory housing policies, unequal labor market opportunities, and gaps in environmental protections have deepened vulnerabilities, leaving certain groups less equipped to cope with the impacts of climate change [12][13]. For instance, African Americans are 40% more likely to reside in areas where extreme temperatures significantly increase mortality rates [13]. In the U.S., race is a stronger predictor than income for determining the placement of toxic facilities [13].
"Better understanding of the intersections between growing climate risks and pre-existing, long-term health, social, environmental, and economic conditions is critical to effectively building climate resilience for everyone." - Environmental Defense Fund [12]
These compounded vulnerabilities amplify the effects of climate events. A neighborhood lacking quality housing, green spaces, and located near toxic sites will struggle far more during heatwaves or floods compared to wealthier areas with better infrastructure [12][13]. To address this, municipalities need to evaluate cumulative impacts when assessing climate risks.
The next step involves standardizing these findings using environmental justice metrics.
Apply Environmental Justice Indexes
To address disparities, environmental justice indexes can help quantify local climate vulnerabilities. The U.S. Climate Vulnerability Index (CVI), for example, uses 184 indicators to rank over 70,000 U.S. Census tracts. This approach provides a detailed picture of how health, social, economic, and infrastructure stressors intersect with climate risks [12][13]. By focusing on census tracts - each averaging 4,000 people - this tool uncovers hyperlocal patterns that broader county-level data often misses [10].
For federal funding initiatives, particularly those tied to Justice40, the Climate & Economic Justice Screening Tool (CEJST) is invaluable. This tool identifies disadvantaged communities based on two criteria: an environmental burden threshold (90th percentile for hazards like flooding or wildfire risk) and a socioeconomic threshold (65th percentile for low income) [14]. This dual requirement ensures that resources are directed to the most affected areas rather than being spread too thinly.
Build Neighborhood-Level Vulnerability Reports
Once standardized indexes are in place, the next step is to create neighborhood-level vulnerability reports by merging multiple datasets. Converting data into percentiles allows for a unified comparison scale, integrating indicators like poverty rates, asthma prevalence, housing cost burdens, and flood risks into a single analysis [10]. Key data sources include the American Community Survey (ACS), FEMA's National Risk Index, and the CDC's PLACES database [14].
Housing-related indicators are especially insightful for assessing a neighborhood's adaptability. Factors such as the lack of central air conditioning, high renter populations, mobile homes, housing costs exceeding 30% of income, and older homes with potential lead paint risks (built before 1960) are essential to include [11][14]. Richmond's Climate Equity Index is a strong example of this approach, combining 39 factors - spanning health, income, housing, and demographics - to measure vulnerability at the census tract level [11].
These detailed reports can guide targeted actions, such as prioritizing neighborhoods for weatherization programs, establishing cooling centers, or building flood mitigation infrastructure. They also highlight critical data gaps, like the effects of climate change on tribal lands or maternal health outcomes, which require further study and policy focus [12][10].
Step 3: Improve Existing Housing Stock
Select Properties for Climate Upgrades
To make meaningful climate upgrades, start by identifying specific buildings using detailed and precise data. Tools like ResStock (for residential buildings) and ComStock (for commercial properties) are invaluable resources for municipalities. These open-source energy modeling platforms analyze energy usage down to individual facilities and systems, helping pinpoint neighborhoods and building types - such as single-family homes or smaller multi-unit buildings - that hold the greatest potential for energy savings and electrification [16][15].
Customizing these models with local data can significantly enhance their effectiveness. For instance, Chicago used ResStock, incorporating actual utility data, to identify retrofit packages capable of achieving over 50% energy savings. This approach also helped target neighborhoods with high electrification potential [15]. As Janet Reyna, a researcher at NREL, explains:
"You need to be able to understand what's actually driving energy use to be able to know what to improve. If you don't have that sort of detailed, disaggregated analysis, you're kind of shooting in the dark" [16].
Equity is a crucial factor in this process. Prioritize properties in underserved communities by combining equity metrics with energy savings data [17]. Across the 138 million homes in the U.S., there’s an estimated $49 billion in potential utility savings [16]. However, achieving these savings requires targeted, data-driven strategies that focus on areas where they can make the biggest difference. This groundwork also helps inform updates to housing codes that align with these improvements.
Update Housing Codes for Climate Resilience
Local housing codes should be examined for vulnerabilities to risks like wind, flooding, and extreme heat, with updates made to enhance energy and water efficiency while maintaining health and safety standards [18]. A multi-hazard approach is essential - flood resilience measures, for example, should not undermine protections against heat or wind [18]. These updates work hand-in-hand with targeted retrofits to ensure long-term climate resilience and adaptability.
Prevent Displacement During Climate Upgrades
While climate upgrades are vital, they can unintentionally lead to resident displacement. In some Massachusetts communities, for example, no-cause evictions and rent hikes exceeding 20% have followed property improvements [20]. To prevent such outcomes, proactive measures must be taken.
Strategies include enforcing affordability covenants, creating tenant habitability plans, and closely monitoring eviction rates [19][20]. The Residential Retrofits for Energy Equity (R2E2) initiative offers a model for aligning energy efficiency goals with tenant protections, ensuring rent increases and displacement are avoided [19]. Policies like just-cause eviction protections and restrictions on passing upgrade costs to tenants can further safeguard residents during these transitions [19][20].
Climate Action in Practice: How Data, AI, and Advocacy Are Reshaping Policy
Step 4: Plan Climate-Resilient New Housing
This step builds on previous risk assessments and vulnerability analyses, focusing on how to use climate data to select safer development sites, design durable buildings, and avoid construction in high-risk areas.
Choose Development Sites Using Climate Data
When planning new housing, leveraging detailed climate data is critical for identifying secure locations. By overlaying downscaled climate projections - such as NOAA sea level rise data or LOCA2 precipitation patterns - with parcel and infrastructure data in GIS tools, planners can pinpoint parcels with minimal climate risks while flagging areas that should remain undeveloped for safety reasons[22].
Several tools provide the granular insights needed for informed decisions:
Risk Factor by First Street Foundation assigns properties a Flood Factor and Fire Factor score (from 1 to 10) based on a 30-year risk projection[23].
FEMA's National Risk Index offers data on 18 natural hazards at the county and census tract levels.
Resilience Analysis and Planning Tool (RAPT) integrates hazard data with over 100 layers of population and infrastructure information[25].
Hazus, now integrated with ArcGIS Pro, estimates potential losses from floods, hurricanes, and tsunamis for property-specific assessments[24].
To manage risk, municipalities can use tools like the Transfer of Development Rights (TDR) system to focus development on safer parcels while preserving flood-prone areas[21]. Similarly, creating Wildfire Lands Overlays within urban growth boundaries can regulate construction in fire-prone zones. Before approving any development, conducting thorough audits of landslide and flood-prone areas can help evaluate potential climate impacts[21].
This data-driven approach ensures that housing is built on safer ground, forming the basis for climate-resilient design.
Design for Local Climate Conditions
Adapting building codes to reflect future climate realities is a key step. For instance, a Mid-Atlantic coastal city updated its floodplain regulations in February 2026 to mandate 3 feet of freeboard and restrict new critical facilities within the 500-year floodplain. This update secured $14.7 million in grants with a 4.2:1 benefit-cost ratio[22].
Frameworks like the American Society of Civil Engineers' ASCE 24-05 for flood-resistant design and the FORTIFIED standards for wind, hail, and hurricane resilience offer proven guidelines[21][26]. Alabama’s "Strengthen Alabama Homes" program demonstrated the impact of these measures: homes built to FORTIFIED standards experienced 55% to 74% fewer losses and reduced loss severity by 14% to 40% during Hurricane Sally in 2020. If applied universally, this could have saved policyholders $32.6 million in deductibles[26].
Incorporating passive cooling strategies such as natural ventilation and shading, along with nature-based solutions like living shorelines, bioswales, and rain gardens, can also improve resilience. For example, a Mid-Atlantic coastal city installed 1.2 miles of living shorelines, which reduced wave energy by 40–60% during storm events[22].
Prevent Construction in High-Risk Zones
Even the most resilient designs lose their effectiveness if built in hazardous locations. Preventing development in high-risk zones is essential for long-term safety. Tools like the Climate Mapping for Resilience and Adaptation (CMRA) provide future climate projections across hazards like drought, wildfire, and coastal flooding[4]. The Neighborhoods at Risk tool combines climate data with socioeconomic insights to guide land-use decisions[3].
Overlay zoning can help enforce these restrictions by clearly marking boundaries for wildfire-prone areas and flood zones. Municipalities can also limit impervious surfaces in new developments to reduce stormwater runoff and mitigate urban heat island effects[21].
Finally, running multi-scenario models for timeframes such as 2030, 2050, and 2100 under varying emissions scenarios provides a broader view of potential climate futures. This ensures that housing developments built today remain safe and viable for decades to come[22].
Step 5: Implement and Track Policies
With a thorough understanding of risks and vulnerabilities from earlier steps, the focus now shifts to transforming data insights into actionable policies. This involves strategic resource allocation, establishing clear metrics for success, and fostering collaboration across sectors to ensure policies achieve their intended impact.
Structure Policies for Maximum Impact
Data should be the cornerstone for deciding where and how resources are deployed. For example, Philadelphia's "Housing Opportunities Made Easy" (HOME) initiative, launched in July 2024, is a $2 billion effort to create or preserve 30,000 housing units. By leveraging Moody's Analytics Housing Gap data, the city identified that 78% of the housing need must be addressed to meet this goal. The initiative strategically allocates $800 million in bonds and $1 billion in public land, targeting investments based on income levels and specific neighborhood shortages [27].
"Sound data is essential for effective policy and strategic resource allocation." – Angela Brooks, Chief Housing & Urban Development Officer, City of Philadelphia [27]
To maximize impact, overlay various data layers, such as housing shortage maps, flood zones, and environmental justice metrics, to pinpoint high-priority areas. Tools like Market Value Analysis can help gauge neighborhood market strength, ensuring public land sales are tailored appropriately and avoiding unnecessary subsidies in strong markets [27]. Cross-agency collaboration is also key - integrating data from housing, planning, and utilities can break down silos and offer a more holistic view of community needs [1].
Once policies are structured, it’s essential to define metrics that measure their effectiveness.
Set Metrics to Measure Success
Clear, measurable indicators are vital for tracking progress. For instance, Washington D.C.'s Building Energy Performance Standards (BEPS), enacted in 2021, required buildings over 50,000 square feet to meet energy targets or face fines. By 2024, this policy achieved an 89% compliance rate and a 12% average reduction in energy use across the city’s building portfolio [28].
Portland, Oregon, offers another example. Between 2005 and 2024, the city reduced vehicle miles traveled (VMT) per capita by 14%, even as its population grew by 28%. This was achieved through an Urban Growth Boundary combined with transit-oriented development incentives, avoiding nearly 890,000 metric tons of CO₂ emissions [28]. Tracking data at granular levels, such as neighborhoods or parcels, improves accuracy, as national datasets often miss the nuances of smaller geographies [1].
For housing policies, monitor affordability by tracking metrics like cost burden rates (households spending more than 30% or 50% of income on housing), median sale prices, and rent levels. Use tax assessor data and rental registries for precision. Housing stability can be assessed through eviction filings, foreclosure rates, and utility shutoffs, using data from court records and utility companies [1]. Additionally, overlay building permits and certificates of occupancy on housing shortage maps to confirm whether development aligns with identified needs [27].
Engaging stakeholders is the next critical step to ensure these metrics translate into meaningful action.
Work with Stakeholders on Implementation
Successful implementation hinges on collaboration with property managers, developers, community organizations, and residents. A Mid-Atlantic coastal city of 28,000 residents demonstrated this through a three-tier engagement process: community surveys (with a 22% response rate), neighborhood workshops offering childcare and translation services, and an 18-member advisory committee. This approach led to unanimous adoption of a resilience plan and the acquisition of $14.7 million in federal and state grants within 18 months [22].
Community co-design has proven to be especially effective. Programs developed with extensive community input achieved 2.3 times the emissions reductions compared to those created through technical consultations alone [28]. In Boston, the Green Ribbon Commission - a public-private governance structure established in 2010 - has sustained climate action across multiple mayoral administrations, helping the city meet its 2020 emissions reduction target two years ahead of schedule [28].
Reaching vulnerable populations requires embedding feedback mechanisms into existing services. For example, Philadelphia Community Legal Services and the Housing Initiative at Penn included a survey in the city’s emergency rental assistance application during 2022–2023. This effort collected over 6,000 responses, creating the largest renter dataset in the city’s history [1]. Similarly, Boulder County, Colorado, implemented data-sharing between its Homeless Management Information System and "Boulder County Connect", enabling service providers to better match resources to individual needs through case conferencing [1].
Transparency is also vital. Public-facing dashboards can show how policy-funded activities align with original data-driven targets, building trust within the community [27]. Partnering with academic institutions or consultancies for independent reviews of emissions inventories and policy outcomes can further enhance credibility with both the public and investors [28].
Conclusion: From Data to Policy Action
Main Points to Remember
This guide has shown how municipalities can use data-driven strategies to tackle the interconnected challenges of climate change and housing. The foundation of effective policy lies in combining demographic, economic, housing, and environmental data to uncover overlapping issues [2][29]. Local administrative records, such as building permits, tax assessments, and 311 complaints, provide more timely and detailed insights than national datasets [1].
Equity must remain a priority. Data can expose how past injustices have amplified climate risks, enabling policymakers to address these disparities [1][29]. Incorporating spatial analytics (GIS) throughout the policymaking process - from assessments to implementation and monitoring - ensures a more dynamic and responsive approach, rather than treating GIS as a one-time tool [29].
Collaboration across departments is equally critical. Housing, planning, utilities, and human services must share data through formal agreements to create a holistic understanding of community needs [1][29]. Where data gaps exist, partnerships with local universities or organizations can help analyze complex datasets and enhance technical expertise [1].
With these principles in place, the next step is to turn insights into actionable policies using the tools and resources already available.
Start Using Data Today
Begin taking action now. Use tools like ENERGY STAR Portfolio Manager to evaluate city-owned buildings and identify the top 10 energy consumers for retrofitting [32]. Apply NOAA heat island mapping to locate vulnerable neighborhoods in need of tree planting and cooling centers [32]. Leverage program intake forms, such as those for emergency rental assistance, to collect valuable information on housing conditions and tenant needs [1].
"Local residents and community-driven organizations are best positioned to gather and interpret data, yielding the most effective solutions." - Urban Institute [30]
The federal government has made over $370 billion available through the Inflation Reduction Act and Bipartisan Infrastructure Law for climate and clean energy projects [32]. With Justice40 requirements ensuring that 40% of benefits go to disadvantaged communities, data-driven vulnerability assessments are crucial for securing this funding and directing resources to where they are most needed [32]. It’s worth remembering: every $1 spent on hazard mitigation saves $6 in disaster-related costs [31].
FAQs
What local data should we collect first to start this work?
To start crafting climate and housing policies, gather detailed local data that reflects your community's housing conditions and environmental challenges. Pay attention to demographic and economic information, including population makeup, income distribution, housing availability, and affordability. Tap into resources like permitting records, property sales data, and community surveys. Geographic Information System (GIS) tools and census data can be invaluable for pinpointing geographic inequalities and environmental vulnerabilities, such as areas prone to flooding or regions with excessive energy consumption.
How do we combine climate risk and equity data to pick priority neighborhoods?
To effectively prioritize neighborhoods, integrate climate risk data with equity metrics by mapping social vulnerabilities such as income levels and housing stability alongside climate-related threats like flooding or extreme heat. Employ frameworks centered on equity to examine disparities, then layer this analysis with climate data. This approach allows for resilience strategies tailored to each neighborhood, ensuring resources are distributed fairly and interventions are directed toward the communities most at risk.
How can we fund retrofits without causing rent hikes or displacement?
Funding retrofits in a way that avoids rent increases or tenant displacement relies on leveraging various federal and state programs, such as HUD initiatives, climate-focused grants, and local government funding. By using data-driven planning, upgrades can be prioritized to maximize efficiency and impact. Engaging the community throughout the process and implementing policies like rent caps during construction projects further safeguard tenants. This combination of strategies ensures energy-efficient improvements are made without placing financial strain on residents or forcing them to relocate.
Related Blog Posts
How to Build a Climate Resilience Plan for Municipalities & Government Agencies
How to Integrate Climate Risk into Infrastructure Planning for Municipalities & Government Agencies
How to Conduct Vulnerability Assessment & Equity Mapping for Municipalities & Government Agencies
How to Embed Equity in Local Resilience Planning for Municipalities & Government Agencies
FAQ
What does it really mean to “redefine profit”?
What makes Council Fire different?
Who does Council Fire you work with?
What does working with Council Fire actually look like?
How does Council Fire help organizations turn big goals into action?
How does Council Fire define and measure success?