
Apr 20, 2026
How to Use Data to Inform Climate and Housing Policy for Foundations & Philanthropic Organizations
Sustainability Strategy
In This Article
Use mapping, EJScreen, FEMA, ENERGY STAR and predictive models to target funding for equitable, climate-resilient housing.
How to Use Data to Inform Climate and Housing Policy for Foundations & Philanthropic Organizations
$1.1 trillion in assets, but only 5% allocated to impact investments. This stark contrast highlights the untapped potential for foundations and philanthropic organizations to address two pressing issues: climate change and housing insecurity. Data-driven strategies can bridge this gap, offering actionable insights to allocate resources effectively and create long-term solutions.
Key takeaways:
Climate and housing challenges are intertwined: Extreme heat kills over 1,220 Americans annually, while housing insecurity increases job loss risks by 22%.
Data tools guide impactful decisions: Tools like EPA's EJScreen, FEMA's National Risk Index, and ENERGY STAR Portfolio Manager help identify vulnerable communities, assess risks, and improve building performance.
Predictive models ensure future resilience: These models help avoid high-risk areas for housing development and align with emissions reduction goals.
Foundations can leverage these insights to drive smarter investments, reduce risks, and support equitable housing policies that address systemic inequalities and climate vulnerabilities.
Climate Action in Practice: How Data, AI, and Advocacy Are Reshaping Policy
Assessing Climate Risks and Vulnerabilities
To address climate challenges effectively, foundations must identify where environmental hazards intersect with social vulnerabilities. This involves pinpointing neighborhoods that face the highest combined risks due to climate threats and long-standing inequities.
Climate vulnerability isn't just about exposure to extreme weather. As the Environmental Defense Fund highlights:
Better understanding of the intersection of vulnerability and climate change risks is key to effectively building resilience because it helps define where climate action and investments are needed most [8].
Factors such as housing quality, infrastructure resilience, and economic stability - often shaped by systemic inequalities - play a significant role in determining how well communities can endure climate impacts. Mapping tools are essential for uncovering these critical intersections and guiding targeted action.
Using Mapping Tools for Climate Risk Assessment
Federal tools provide valuable insights into climate risks at a detailed level. The Climate Mapping for Resilience and Adaptation (CMRA) focuses on five major hazards: extreme heat, drought, wildfires, flooding, and coastal inundation [7]. With its free, user-friendly platform, CMRA allows users to search by address or county and view projections across three future time frames.
For a broader analysis, the U.S. Climate Vulnerability Index (CVI), developed by the Environmental Defense Fund and Texas A&M University, combines 184 indicators to assess cumulative vulnerability across more than 70,000 U.S. Census tracts [4][6]. This tool integrates data on health conditions, housing characteristics, and infrastructure gaps with climate impacts, offering a comprehensive view of community risks.
Census tracts, typically housing between 1,000 and 8,000 people (with an average of 4,000), provide the fine-grained detail necessary for local interventions. Unlike county-level data, which can obscure disparities, these granular projections help target resources to the neighborhoods most in need. Such precision ensures housing initiatives directly address the communities facing the greatest risks.
Identifying High-Risk Communities
Layering demographic and housing data onto mapping results further sharpens the focus on vulnerable neighborhoods. The CVI's "Top Drivers" feature identifies whether a community's vulnerability stems more from climate hazards, such as flooding, or baseline issues like poor housing conditions and infrastructure deficits [5]. This distinction is critical for designing effective solutions.
Key housing metrics in the CVI include redlining history, the prevalence of mobile homes, foreclosure risk, overcrowding, and the age of housing stock [10][11]. These indicators link climate vulnerability directly to housing policy needs. For instance, African Americans are 40% more likely to live in areas where extreme temperatures will result in higher mortality rates [9]. Such disparities often trace back to housing quality and location, underscoring the importance of targeted interventions in these communities.
Combining Environmental Justice and Socioeconomic Data
Crafting effective policies requires blending physical risk data with insights into social vulnerabilities. Environmental justice data highlights how pollution, climate risks, and socioeconomic challenges often intersect, creating disproportionate impacts on certain communities. By merging these datasets, organizations can design strategies that address both environmental risks and the systemic inequities that worsen them.
By layering environmental burdens with socioeconomic indicators at the census tract level, hidden disparities come into focus. For example, a tract might face severe flooding risks, but the response will vary significantly if residents also struggle with high housing costs, limited English proficiency, or shorter life expectancies. These combined factors shape a community’s ability to prepare for, endure, and recover from climate-related challenges.
Using EPA's Environmental Justice Screening Tool
The EPA's EJScreen is a key resource for this type of analysis. It combines 13 environmental indicators - such as diesel particulate matter, traffic proximity, and ozone levels - with demographic data to create EJ Indexes and Supplemental Indexes [15][16]. The EJ Index calculates an average based on the percentage of low-income residents and people of color in a given area [15]. Meanwhile, the Supplemental Demographic Index digs deeper, incorporating five factors: low income, disability, limited English proficiency, lower educational attainment, and reduced life expectancy [15].
For housing-related policies, these Supplemental Indexes are especially useful. They highlight areas where environmental burdens overlap with socioeconomic vulnerabilities. For example, the Greenhouse Gas Reduction Fund (GGRF) defines disadvantaged communities as those in the 90th percentile or higher on EJScreen’s Supplemental Indexes [15]. This helps direct resources to areas where they can make the most impact.
EJScreen also includes lead paint exposure as a housing-specific indicator [15]. This is critical for identifying neighborhoods where children may face heightened health risks from older housing stock. When combined with income data, this information can guide housing rehabilitation efforts. While EJScreen’s percentile rankings allow for quick comparisons across regions, it’s important to supplement this data with local knowledge, as the tool’s data may be several years old [16].
To complement EJScreen’s demographic focus, FEMA offers a tool that quantifies the financial and human costs of climate events.
Incorporating FEMA's National Risk Index
The FEMA National Risk Index (NRI) provides a detailed look at potential losses from climate-related disasters. It calculates expected annual losses for buildings, populations, and agriculture across 14 natural hazards, including coastal flooding, heat waves, and hurricanes [13][14]. This data helps organizations identify not just where risks are high, but also the potential financial and human toll.
The NRI includes metrics like building and population loss rates [13]. For example, population loss rates consider one injury as equivalent to one-tenth of a fatality when calculating annual risk [13]. These metrics allow for direct comparisons of climate vulnerabilities across different hazards and regions, enabling more informed resource allocation.
When paired with socioeconomic data, the NRI becomes an even more effective tool for equitable policy-making. The Climate and Economic Justice Screening Tool (CEJST) integrates FEMA’s data with income thresholds to pinpoint disadvantaged communities. A tract is typically classified as disadvantaged if it ranks in the 90th percentile or higher for climate or environmental burdens and in the 65th percentile or higher for low income [13][14]. This dual-criteria approach ensures resources are directed to areas with both high physical risks and limited capacity to adapt.
Tool | Primary Methodology | Key Housing/Climate Indicators |
|---|---|---|
EPA EJScreen | Indexing (Environmental × Demographic) | Lead paint, diesel PM, traffic proximity, ozone [15] |
CEJST | Threshold-based (90th percentile burden + 65th percentile income) | Historic redlining, housing cost, green space, indoor plumbing [14] |
FEMA NRI | Expected Annual Loss (EAL) | Building loss rate, population loss rate, agriculture loss rate [14] |
CEJST also incorporates data on historic underinvestment, using 1935–1940 redlining maps, as well as indicators like high housing cost burdens (households earning under 80% of the Area Median Family Income and spending more than 30% on housing) and lack of indoor plumbing [13][14]. These metrics connect environmental justice to actionable housing initiatives, paving the way for investments that not only improve climate resilience but also address longstanding inequities. By integrating these tools, policymakers can create targeted strategies to enhance both housing equity and climate preparedness.
Improving Building Efficiency with Data
Addressing the buildings themselves is just as important as identifying vulnerable communities. Energy use directly impacts both emissions and tenant expenses, making building-level data a key resource for designing effective retrofits. By monitoring energy consumption, water usage, and emissions, organizations can identify inefficiencies and focus on upgrades that not only protect tenants but also align with climate objectives. This data serves as a bridge between recognizing community needs and implementing targeted improvements.
Energy performance benchmarking is now a standard in the commercial and multifamily housing sectors, with more state and local governments adopting ordinances and building performance standards [17]. This shift has made data more accessible than ever, but interpreting and using it effectively requires the right tools and partnerships.
Benchmarking Emissions and Energy Use with ENERGY STAR
The ENERGY STAR Portfolio Manager is one of the most widely used platforms for tracking building-level energy and water usage. Property owners can input monthly utility data to calculate key metrics like Energy Use Intensity (EUI) and receive an ENERGY STAR Score - a 1–100 rating often used by cities to set performance benchmarks and prioritize buildings for upgrades [21]. The Portfolio Manager Data Explorer contains energy data for over 150,000 U.S. properties, including commercial, multifamily, and single-family buildings, providing a valuable resource for comparing performance across similar structures [20].
For example, in September 2023, the City of San Francisco collaborated with local utility providers to deliver aggregated energy data directly to multifamily building owners via Portfolio Manager. This initiative boosted energy benchmarking participation by 20% and achieved a 15% reduction in energy consumption within the first year [18].
To streamline the benchmarking process, building owners should complete the ENERGY STAR data collection worksheet before entering their data. For those managing large property portfolios, automating data submission through utility partnerships or third-party services can greatly reduce administrative workloads and enable real-time performance monitoring [22]. Improving building efficiency not only supports climate-resilient housing initiatives but also helps lower tenant costs.
Collaborating with Utility Providers
Efficient data collection from utility companies is essential for successful energy management. Currently, more than 75 utilities across the U.S. offer aggregate whole-building data, which simplifies benchmarking in Portfolio Manager by removing the need for manual data entry [17]. This is especially crucial for multifamily properties where tenants pay utilities directly, making whole-building data inaccessible to property owners [18].
Utility data can be integrated into Portfolio Manager via API or spreadsheets. The API option is preferred for its speed and accuracy, as it automates data updates and provides actionable insights for creating more effective efficiency programs [17][19]. Building owners can use interactive ENERGY STAR maps to check if their local utilities support data services [22][23]. If not, standardized Data Request Reference Guides can help initiate the process [23].
"When thoughtfully deployed, utility data access solutions can address a clear customer need while also positioning the utility as a trusted partner to help building owners pursue their energy and sustainability goals." – ENERGY STAR [17]
Aggregate whole-building data ensures tenant privacy by preventing the identification of individual consumption patterns [23]. Tools like BETTER use monthly energy data to generate targeted, cost-effective efficiency recommendations [21].
Using Predictive Models for Climate-Resilient Housing
Predictive modeling is revolutionizing how housing policies adapt to the challenges of climate resilience. Beyond benchmarking, these models help guide the development of new housing by integrating diverse data sources - hazard probabilities, building exposure, and vulnerability assessments - to predict climate risks decades ahead. The aim is straightforward: ensure affordable housing is not built in areas that may become uninhabitable or uninsurable as climate conditions evolve. This method refines earlier data-driven evaluations and enhances decision-making for site selection.
These models rely on a mix of hazard data (like burn probability maps and meteorological inputs), high-resolution building exposure data, and vulnerability information such as building materials and fire mitigation features. When paired with Global Climate Models and emissions scenarios, they provide increasingly reliable projections of mid-century risks. For example, such forecasts can highlight wildfire-prone regions or areas susceptible to extreme weather events [12].
However, the accuracy and transparency of these models remain a challenge. A 2023 study comparing 13 risk model vendors revealed significant inconsistencies in results for the same locations, complicating trust and decision-making. Open-source initiatives like Open Climate Risk are addressing this by promoting transparency. Their platform, for instance, evaluates wildfire risk for approximately 156 million buildings across the contiguous U.S., using wind-driven spread modeling. This approach effectively predicts how embers bypass traditional fire barriers during high-wind conditions [12].
Siting New Housing in Climate-Safe Locations
Selecting locations for new housing requires more than avoiding obvious hazard zones. Tools like heat mapping, which illustrate urban temperature variations, are particularly useful. These maps help planners identify cooler areas within cities, reducing exposure to the urban heat island effect. Community-led temperature data collection projects further highlight high-heat zones where targeted cooling solutions may be necessary [2].
In wildfire-prone areas, wind-driven models play a crucial role in refining site selection. These models consider local wind patterns during "fire weather" days, offering insights into how fires spread from wildlands into urban areas. Validating these models against historical data, such as the Interagency Wildland Fire Perimeter History, ensures their reliability before making long-term housing investments.
The intersection of climate risk and affordable housing development is becoming increasingly apparent. In the U.S., there is a shortage of 7.1 million affordable rental homes for extremely low-income renters - a crisis worsened by rising construction costs and climate risks [24]. Predictive models can help identify locations that are likely to remain viable over time, minimizing the risk of stranded assets or forced displacement.
Aligning Housing with Decarbonization Goals
Where housing is built doesn’t just affect climate resilience - it also shapes transportation patterns and carbon emissions. By analyzing vehicle miles traveled (VMT), planners can pinpoint sites that reduce transportation-related emissions. For example, in Lima, Peru, a transport decarbonization initiative using predictive models projects a reduction of 0.64 tons of CO₂ equivalent by 2030 and 1.03 tons by 2050. These models also predict a significant shift in transportation habits, with bicycle use expected to grow from 0.9% in 2019 to 11.6% by 2050 [2].
"Too many households are forced to live far from their workplace, simply to find a home they can afford. But long commutes come with high stress, crushing transportation costs, and extra childcare expenses." – National Alliance to End Homelessness [24]
By situating housing near public transit and employment hubs, planners can reduce emissions and improve accessibility, especially during climate emergencies. Data from programs like IFC's EDGE, which certified 27% of new buildings in Colombia as green in 2022, demonstrates how green building standards and incentives can track and enhance energy and water efficiency during the design phase [2]. Foundations in the U.S. can leverage similar incentives to support energy-efficient solutions such as better insulation and advanced HVAC systems.
Predictive models should also factor in transportation accessibility during climate disruptions. This involves considering variables like route redundancy, travel-time increases, and reachability. Such layers ensure that housing remains accessible even when primary routes are blocked or damaged, a critical factor during natural disasters [25].
Measuring Impact and Implementing Policies
Analyzing Carbon Footprints and Social Impact
To gauge the effectiveness of policies, it's essential to track both environmental and social outcomes. One clear indicator comes from insurance premiums. Between 2020 and 2023, the average homeowners insurance premium increased by 33%, reflecting a 13% rise after adjusting for inflation. By separating insurance costs from mortgage escrow payments, foundations can monitor how climate risks are being priced in specific markets and assess whether interventions are easing this financial burden [26][28].
Property valuation analysis reveals that environmental risks, like rising sea levels, can artificially inflate property values. For instance, residential properties vulnerable to flooding are estimated to be overvalued by more than $200 billion [27]. Monitoring this discrepancy helps determine if policies are effectively redirecting development from high-risk areas or merely delaying inevitable losses.
Social impact metrics are equally revealing. Linking disaster relief data with consumer credit records shows that receiving federal disaster loans reduces the likelihood of bankruptcy by 61% within three years of a disaster [26]. In 2023 alone, 2.4 million Americans were displaced by disasters, with 16% still unable to return home. Tracking displacement and recovery rates offers vital insights into the success of policies aimed at aiding recovery [27].
"Price signals from insurance premiums are the most direct information most households have on their risk, and these signals should induce responses in the form of resilience investments or exit." – Benjamin J. Keys, Professor, University of Pennsylvania [26]
In addition to historical data, catastrophe modeling provides a forward-looking lens to evaluate whether policies are reducing vulnerability under evolving conditions. For example, adopting construction standards like FORTIFIED - which can lower the frequency of losses by 55% to 74% during severe weather - demonstrates the tangible benefits of robust building codes [27]. By tracking both process and outcome metrics, policymakers can gain a comprehensive understanding of their impact [29]. These tools and methods create a foundation for actionable strategies, as seen in Council Fire’s tailored consulting solutions.
Partnering with Council Fire for Sustainability Consulting

Council Fire specializes in turning data into actionable strategies, helping organizations measure and act on their environmental impact. Their work includes establishing greenhouse gas (GHG) inventories across Scopes 1, 2, and 3 and setting science-based targets aligned with 1.5°C climate pathways. For instance, a state Department of Transportation partnered with Council Fire to create a phased fleet electrification strategy, aiming to cut fleet emissions by 65% by 2035 [30].
Beyond impact measurement, Council Fire focuses on building robust data systems to guide strategic resilience investments. This involves enhancing data infrastructure through standardized semantics, metadata, and interoperable systems to ensure reliable climate performance metrics. Their approach also includes vulnerability assessments that examine exposure to climate hazards, the sensitivity of infrastructure and populations, and the adaptive capacity to respond [29]. By prioritizing stakeholder needs, Council Fire ensures that resilience investments are paired with protections like affordable housing to minimize unintended displacement.
Comparison of Data Tools for Climate and Housing Policy
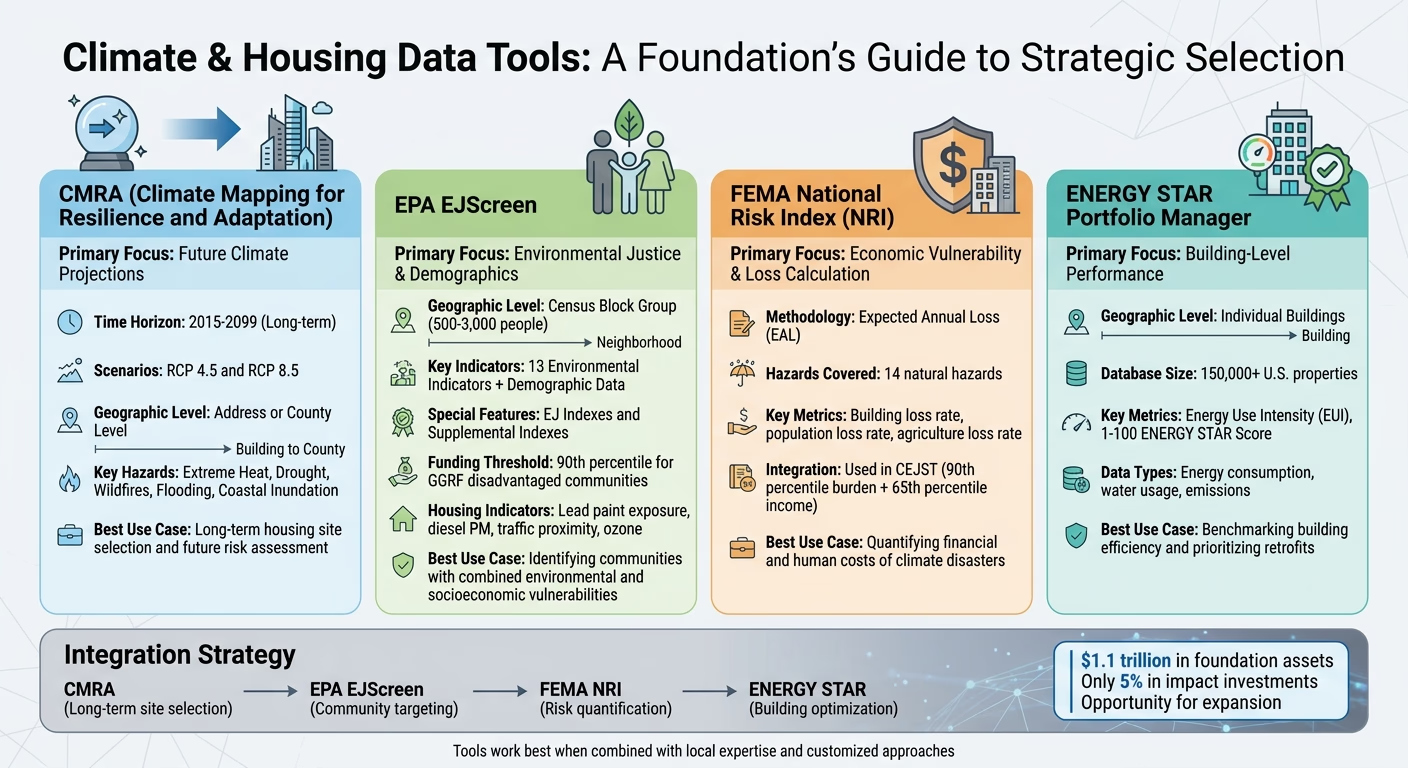
Comparison of Climate and Housing Data Tools for Foundations
This section highlights the distinct strengths of various data tools to aid strategic decision-making for foundations. Choosing the right tool depends on clearly defined objectives.
CMRA (Climate Mapping for Resilience and Adaptation) stands out for its ability to project future climate conditions. It offers climate projections across three future periods (2015–2099) under two Representative Concentration Pathway (RCP) scenarios: RCP 4.5 and RCP 8.5 [7][32]. This focus on long-term trends makes it particularly useful for evaluating the safety of potential housing development sites against risks such as extreme heat, drought, wildfires, flooding, and coastal inundation over decades [7].
Meanwhile, tools like EPA EJScreen excel in providing detailed demographic data. EJScreen delivers granular geographic insights at the Census Block Group level, typically representing populations of 500 to 3,000 people [32][15]. It is a key resource for identifying communities that face both environmental challenges and socioeconomic disadvantages. For federal funding applications, EJScreen’s Supplemental Indexes are invaluable. For example, the Greenhouse Gas Reduction Fund (GGRF) identifies disadvantaged communities as those ranking at or above the 90th percentile on these indexes [15].
FEMA's National Risk Index (NRI) focuses on economic vulnerability, using Expected Annual Loss (EAL) calculations that integrate hazard exposure with social and resilience factors [31]. This makes it a critical tool for pinpointing areas where disasters are likely to cause the greatest financial damage and identifying communities with limited capacity to recover [31].
On the other hand, Energy Star operates at the building level, benchmarking energy use and emissions to support decarbonization efforts. By evaluating building performance, Energy Star provides detailed data that complements broader geographic and socioeconomic insights offered by CMRA, EPA EJScreen, and FEMA’s NRI. Together, these tools enable foundations to allocate resources effectively and drive impactful climate-resilient housing policies.
Conclusion
Foundations face an urgent need to tackle the intertwined challenges of climate change and housing with tools grounded in data and evidence. The strategies highlighted here - ranging from mapping tools and environmental justice screening to predictive modeling and building efficiency benchmarking - offer a solid framework for informed decision-making. However, success lies in combining these tools with local expertise and customized approaches to achieve meaningful outcomes.
Recent grant programs illustrate these principles in action. For instance, the 2024 Robert Wood Johnson Foundation's "Local Data for Equitable Communities" initiative supported thirty organizations nationwide in transforming data into tangible results. In Tucson, Arizona, the Sonora Environmental Research Institute assessed climate vulnerabilities in housing to better allocate sustainability resources in response to rising desert temperatures. Similarly, in New Mexico, the Ramah Navajo School Board conducted housing quality evaluations to advocate for investments in tribal housing initiatives[1].
As climate data continues to advance, strategies for policy must also evolve. Foundations can play a critical role by funding community-driven data collection efforts, creating public dashboards to monitor key metrics like tenant instability and corporate property ownership, and ensuring regular, comprehensive risk assessments[1]. With over $1.1 trillion in assets under management but only 5% currently allocated to impact investments[3], philanthropic organizations have an immense opportunity to expand these efforts and amplify their environmental and social contributions.
For those seeking to transform data into actionable sustainability outcomes, Council Fire offers a pathway. From analyzing carbon footprints to fostering stakeholder collaboration, Council Fire helps organizations align their sustainability goals with system-level results, delivering long-term benefits across environmental, social, and economic dimensions. These efforts echo the strategic approaches outlined above, bridging insights with impactful action.
FAQs
Which data tool should we start with for our region?
To get started in your region, consider using the Community Assessment Reporting Tool (CART). This tool provides a wealth of detailed information, including data on HUD investments, property details, and demographic statistics across different geographic areas. By leveraging CART, you can pinpoint local vulnerabilities and make informed decisions about climate and housing policies.
How do we combine climate risk and equity data correctly?
Integrating climate risk and equity data involves merging various datasets to create a thorough understanding of vulnerabilities. Tools such as climate risk assessments can pinpoint areas most at risk, while local data on housing, displacement, and socioeconomic conditions provide critical context. By synthesizing these datasets, it's possible to identify communities that simultaneously face significant climate threats and social inequities. This approach ensures that solutions are both targeted and fair, addressing climate adaptation alongside social resilience.
What impact metrics should we track over time?
Tracking specific metrics is essential for understanding and improving housing stability and resilience in the face of climate challenges. Key areas to monitor include:
Housing affordability: This can be measured by the percentage of households facing high cost burdens.
Displacement and eviction rates: These figures reveal how often individuals and families are forced to leave their homes.
Housing stock condition and safety: Evaluating the quality and safety of housing structures helps identify areas in need of improvement.
Climate resilience indicators: Metrics such as the frequency and severity of natural disasters provide insight into how well housing systems withstand environmental risks.
Insurance claims and premiums: Tracking these, especially those tied to climate risks, highlights the financial impacts on homeowners and communities.
By consistently monitoring these metrics over time, policymakers can gauge the effectiveness of initiatives aimed at enhancing housing stability and building resilience against climate-related challenges.
Related Blog Posts
How to Embed Equity in Local Resilience Planning for Municipalities & Government Agencies
How to Use Data to Inform Climate and Housing Policy for Municipalities & Government Agencies
How to Use Data to Inform Climate and Housing Policy for Corporations
How to Use Data to Inform Climate and Housing Policy for NGOs & Nonprofits
Latest Articles
©2026

Narrative Change and Power Building: The Missing Half of Advocacy
Narrative change is the process of disrupting dominant narratives that normalize inequity and advancing new narratives from historically marginalized communities.

Funding Resilience Without Federal Grants
BRIC is unreliable and FEMA is shrinking. Here's how cities fund climate resilience with dedicated revenue, blended finance, and a coordinating authority.

The ESG Blind Spot: How AI Is Finding Risks in Companies Nobody Else Is Watching
Norway's sovereign wealth fund uses AI to screen 7,200 portfolio companies for forced labor and corruption within 24 hours. The real story is the emerging-market coverage gap that traditional ESG data vendors miss — and what it means for any company with a global supply chain.
Narrative Change and Power Building: The Missing Half of Advocacy
Narrative change is the process of disrupting dominant narratives that normalize inequity and advancing new narratives from historically marginalized communities.
Funding Resilience Without Federal Grants
BRIC is unreliable and FEMA is shrinking. Here's how cities fund climate resilience with dedicated revenue, blended finance, and a coordinating authority.
The ESG Blind Spot: How AI Is Finding Risks in Companies Nobody Else Is Watching
Norway's sovereign wealth fund uses AI to screen 7,200 portfolio companies for forced labor and corruption within 24 hours. The real story is the emerging-market coverage gap that traditional ESG data vendors miss — and what it means for any company with a global supply chain.
FAQ
01
What does it really mean to “redefine profit”?
02
What makes Council Fire different?
03
Who does Council Fire work with?
04
What does working with Council Fire actually look like?
05
How does Council Fire help organizations turn big goals into action?
06
How does Council Fire define and measure success?
07
How does technology fit into Council Fire’s work?
Apr 20, 2026
How to Use Data to Inform Climate and Housing Policy for Foundations & Philanthropic Organizations
Sustainability Strategy
In This Article
Use mapping, EJScreen, FEMA, ENERGY STAR and predictive models to target funding for equitable, climate-resilient housing.
How to Use Data to Inform Climate and Housing Policy for Foundations & Philanthropic Organizations
$1.1 trillion in assets, but only 5% allocated to impact investments. This stark contrast highlights the untapped potential for foundations and philanthropic organizations to address two pressing issues: climate change and housing insecurity. Data-driven strategies can bridge this gap, offering actionable insights to allocate resources effectively and create long-term solutions.
Key takeaways:
Climate and housing challenges are intertwined: Extreme heat kills over 1,220 Americans annually, while housing insecurity increases job loss risks by 22%.
Data tools guide impactful decisions: Tools like EPA's EJScreen, FEMA's National Risk Index, and ENERGY STAR Portfolio Manager help identify vulnerable communities, assess risks, and improve building performance.
Predictive models ensure future resilience: These models help avoid high-risk areas for housing development and align with emissions reduction goals.
Foundations can leverage these insights to drive smarter investments, reduce risks, and support equitable housing policies that address systemic inequalities and climate vulnerabilities.
Climate Action in Practice: How Data, AI, and Advocacy Are Reshaping Policy
Assessing Climate Risks and Vulnerabilities
To address climate challenges effectively, foundations must identify where environmental hazards intersect with social vulnerabilities. This involves pinpointing neighborhoods that face the highest combined risks due to climate threats and long-standing inequities.
Climate vulnerability isn't just about exposure to extreme weather. As the Environmental Defense Fund highlights:
Better understanding of the intersection of vulnerability and climate change risks is key to effectively building resilience because it helps define where climate action and investments are needed most [8].
Factors such as housing quality, infrastructure resilience, and economic stability - often shaped by systemic inequalities - play a significant role in determining how well communities can endure climate impacts. Mapping tools are essential for uncovering these critical intersections and guiding targeted action.
Using Mapping Tools for Climate Risk Assessment
Federal tools provide valuable insights into climate risks at a detailed level. The Climate Mapping for Resilience and Adaptation (CMRA) focuses on five major hazards: extreme heat, drought, wildfires, flooding, and coastal inundation [7]. With its free, user-friendly platform, CMRA allows users to search by address or county and view projections across three future time frames.
For a broader analysis, the U.S. Climate Vulnerability Index (CVI), developed by the Environmental Defense Fund and Texas A&M University, combines 184 indicators to assess cumulative vulnerability across more than 70,000 U.S. Census tracts [4][6]. This tool integrates data on health conditions, housing characteristics, and infrastructure gaps with climate impacts, offering a comprehensive view of community risks.
Census tracts, typically housing between 1,000 and 8,000 people (with an average of 4,000), provide the fine-grained detail necessary for local interventions. Unlike county-level data, which can obscure disparities, these granular projections help target resources to the neighborhoods most in need. Such precision ensures housing initiatives directly address the communities facing the greatest risks.
Identifying High-Risk Communities
Layering demographic and housing data onto mapping results further sharpens the focus on vulnerable neighborhoods. The CVI's "Top Drivers" feature identifies whether a community's vulnerability stems more from climate hazards, such as flooding, or baseline issues like poor housing conditions and infrastructure deficits [5]. This distinction is critical for designing effective solutions.
Key housing metrics in the CVI include redlining history, the prevalence of mobile homes, foreclosure risk, overcrowding, and the age of housing stock [10][11]. These indicators link climate vulnerability directly to housing policy needs. For instance, African Americans are 40% more likely to live in areas where extreme temperatures will result in higher mortality rates [9]. Such disparities often trace back to housing quality and location, underscoring the importance of targeted interventions in these communities.
Combining Environmental Justice and Socioeconomic Data
Crafting effective policies requires blending physical risk data with insights into social vulnerabilities. Environmental justice data highlights how pollution, climate risks, and socioeconomic challenges often intersect, creating disproportionate impacts on certain communities. By merging these datasets, organizations can design strategies that address both environmental risks and the systemic inequities that worsen them.
By layering environmental burdens with socioeconomic indicators at the census tract level, hidden disparities come into focus. For example, a tract might face severe flooding risks, but the response will vary significantly if residents also struggle with high housing costs, limited English proficiency, or shorter life expectancies. These combined factors shape a community’s ability to prepare for, endure, and recover from climate-related challenges.
Using EPA's Environmental Justice Screening Tool
The EPA's EJScreen is a key resource for this type of analysis. It combines 13 environmental indicators - such as diesel particulate matter, traffic proximity, and ozone levels - with demographic data to create EJ Indexes and Supplemental Indexes [15][16]. The EJ Index calculates an average based on the percentage of low-income residents and people of color in a given area [15]. Meanwhile, the Supplemental Demographic Index digs deeper, incorporating five factors: low income, disability, limited English proficiency, lower educational attainment, and reduced life expectancy [15].
For housing-related policies, these Supplemental Indexes are especially useful. They highlight areas where environmental burdens overlap with socioeconomic vulnerabilities. For example, the Greenhouse Gas Reduction Fund (GGRF) defines disadvantaged communities as those in the 90th percentile or higher on EJScreen’s Supplemental Indexes [15]. This helps direct resources to areas where they can make the most impact.
EJScreen also includes lead paint exposure as a housing-specific indicator [15]. This is critical for identifying neighborhoods where children may face heightened health risks from older housing stock. When combined with income data, this information can guide housing rehabilitation efforts. While EJScreen’s percentile rankings allow for quick comparisons across regions, it’s important to supplement this data with local knowledge, as the tool’s data may be several years old [16].
To complement EJScreen’s demographic focus, FEMA offers a tool that quantifies the financial and human costs of climate events.
Incorporating FEMA's National Risk Index
The FEMA National Risk Index (NRI) provides a detailed look at potential losses from climate-related disasters. It calculates expected annual losses for buildings, populations, and agriculture across 14 natural hazards, including coastal flooding, heat waves, and hurricanes [13][14]. This data helps organizations identify not just where risks are high, but also the potential financial and human toll.
The NRI includes metrics like building and population loss rates [13]. For example, population loss rates consider one injury as equivalent to one-tenth of a fatality when calculating annual risk [13]. These metrics allow for direct comparisons of climate vulnerabilities across different hazards and regions, enabling more informed resource allocation.
When paired with socioeconomic data, the NRI becomes an even more effective tool for equitable policy-making. The Climate and Economic Justice Screening Tool (CEJST) integrates FEMA’s data with income thresholds to pinpoint disadvantaged communities. A tract is typically classified as disadvantaged if it ranks in the 90th percentile or higher for climate or environmental burdens and in the 65th percentile or higher for low income [13][14]. This dual-criteria approach ensures resources are directed to areas with both high physical risks and limited capacity to adapt.
Tool | Primary Methodology | Key Housing/Climate Indicators |
|---|---|---|
EPA EJScreen | Indexing (Environmental × Demographic) | Lead paint, diesel PM, traffic proximity, ozone [15] |
CEJST | Threshold-based (90th percentile burden + 65th percentile income) | Historic redlining, housing cost, green space, indoor plumbing [14] |
FEMA NRI | Expected Annual Loss (EAL) | Building loss rate, population loss rate, agriculture loss rate [14] |
CEJST also incorporates data on historic underinvestment, using 1935–1940 redlining maps, as well as indicators like high housing cost burdens (households earning under 80% of the Area Median Family Income and spending more than 30% on housing) and lack of indoor plumbing [13][14]. These metrics connect environmental justice to actionable housing initiatives, paving the way for investments that not only improve climate resilience but also address longstanding inequities. By integrating these tools, policymakers can create targeted strategies to enhance both housing equity and climate preparedness.
Improving Building Efficiency with Data
Addressing the buildings themselves is just as important as identifying vulnerable communities. Energy use directly impacts both emissions and tenant expenses, making building-level data a key resource for designing effective retrofits. By monitoring energy consumption, water usage, and emissions, organizations can identify inefficiencies and focus on upgrades that not only protect tenants but also align with climate objectives. This data serves as a bridge between recognizing community needs and implementing targeted improvements.
Energy performance benchmarking is now a standard in the commercial and multifamily housing sectors, with more state and local governments adopting ordinances and building performance standards [17]. This shift has made data more accessible than ever, but interpreting and using it effectively requires the right tools and partnerships.
Benchmarking Emissions and Energy Use with ENERGY STAR
The ENERGY STAR Portfolio Manager is one of the most widely used platforms for tracking building-level energy and water usage. Property owners can input monthly utility data to calculate key metrics like Energy Use Intensity (EUI) and receive an ENERGY STAR Score - a 1–100 rating often used by cities to set performance benchmarks and prioritize buildings for upgrades [21]. The Portfolio Manager Data Explorer contains energy data for over 150,000 U.S. properties, including commercial, multifamily, and single-family buildings, providing a valuable resource for comparing performance across similar structures [20].
For example, in September 2023, the City of San Francisco collaborated with local utility providers to deliver aggregated energy data directly to multifamily building owners via Portfolio Manager. This initiative boosted energy benchmarking participation by 20% and achieved a 15% reduction in energy consumption within the first year [18].
To streamline the benchmarking process, building owners should complete the ENERGY STAR data collection worksheet before entering their data. For those managing large property portfolios, automating data submission through utility partnerships or third-party services can greatly reduce administrative workloads and enable real-time performance monitoring [22]. Improving building efficiency not only supports climate-resilient housing initiatives but also helps lower tenant costs.
Collaborating with Utility Providers
Efficient data collection from utility companies is essential for successful energy management. Currently, more than 75 utilities across the U.S. offer aggregate whole-building data, which simplifies benchmarking in Portfolio Manager by removing the need for manual data entry [17]. This is especially crucial for multifamily properties where tenants pay utilities directly, making whole-building data inaccessible to property owners [18].
Utility data can be integrated into Portfolio Manager via API or spreadsheets. The API option is preferred for its speed and accuracy, as it automates data updates and provides actionable insights for creating more effective efficiency programs [17][19]. Building owners can use interactive ENERGY STAR maps to check if their local utilities support data services [22][23]. If not, standardized Data Request Reference Guides can help initiate the process [23].
"When thoughtfully deployed, utility data access solutions can address a clear customer need while also positioning the utility as a trusted partner to help building owners pursue their energy and sustainability goals." – ENERGY STAR [17]
Aggregate whole-building data ensures tenant privacy by preventing the identification of individual consumption patterns [23]. Tools like BETTER use monthly energy data to generate targeted, cost-effective efficiency recommendations [21].
Using Predictive Models for Climate-Resilient Housing
Predictive modeling is revolutionizing how housing policies adapt to the challenges of climate resilience. Beyond benchmarking, these models help guide the development of new housing by integrating diverse data sources - hazard probabilities, building exposure, and vulnerability assessments - to predict climate risks decades ahead. The aim is straightforward: ensure affordable housing is not built in areas that may become uninhabitable or uninsurable as climate conditions evolve. This method refines earlier data-driven evaluations and enhances decision-making for site selection.
These models rely on a mix of hazard data (like burn probability maps and meteorological inputs), high-resolution building exposure data, and vulnerability information such as building materials and fire mitigation features. When paired with Global Climate Models and emissions scenarios, they provide increasingly reliable projections of mid-century risks. For example, such forecasts can highlight wildfire-prone regions or areas susceptible to extreme weather events [12].
However, the accuracy and transparency of these models remain a challenge. A 2023 study comparing 13 risk model vendors revealed significant inconsistencies in results for the same locations, complicating trust and decision-making. Open-source initiatives like Open Climate Risk are addressing this by promoting transparency. Their platform, for instance, evaluates wildfire risk for approximately 156 million buildings across the contiguous U.S., using wind-driven spread modeling. This approach effectively predicts how embers bypass traditional fire barriers during high-wind conditions [12].
Siting New Housing in Climate-Safe Locations
Selecting locations for new housing requires more than avoiding obvious hazard zones. Tools like heat mapping, which illustrate urban temperature variations, are particularly useful. These maps help planners identify cooler areas within cities, reducing exposure to the urban heat island effect. Community-led temperature data collection projects further highlight high-heat zones where targeted cooling solutions may be necessary [2].
In wildfire-prone areas, wind-driven models play a crucial role in refining site selection. These models consider local wind patterns during "fire weather" days, offering insights into how fires spread from wildlands into urban areas. Validating these models against historical data, such as the Interagency Wildland Fire Perimeter History, ensures their reliability before making long-term housing investments.
The intersection of climate risk and affordable housing development is becoming increasingly apparent. In the U.S., there is a shortage of 7.1 million affordable rental homes for extremely low-income renters - a crisis worsened by rising construction costs and climate risks [24]. Predictive models can help identify locations that are likely to remain viable over time, minimizing the risk of stranded assets or forced displacement.
Aligning Housing with Decarbonization Goals
Where housing is built doesn’t just affect climate resilience - it also shapes transportation patterns and carbon emissions. By analyzing vehicle miles traveled (VMT), planners can pinpoint sites that reduce transportation-related emissions. For example, in Lima, Peru, a transport decarbonization initiative using predictive models projects a reduction of 0.64 tons of CO₂ equivalent by 2030 and 1.03 tons by 2050. These models also predict a significant shift in transportation habits, with bicycle use expected to grow from 0.9% in 2019 to 11.6% by 2050 [2].
"Too many households are forced to live far from their workplace, simply to find a home they can afford. But long commutes come with high stress, crushing transportation costs, and extra childcare expenses." – National Alliance to End Homelessness [24]
By situating housing near public transit and employment hubs, planners can reduce emissions and improve accessibility, especially during climate emergencies. Data from programs like IFC's EDGE, which certified 27% of new buildings in Colombia as green in 2022, demonstrates how green building standards and incentives can track and enhance energy and water efficiency during the design phase [2]. Foundations in the U.S. can leverage similar incentives to support energy-efficient solutions such as better insulation and advanced HVAC systems.
Predictive models should also factor in transportation accessibility during climate disruptions. This involves considering variables like route redundancy, travel-time increases, and reachability. Such layers ensure that housing remains accessible even when primary routes are blocked or damaged, a critical factor during natural disasters [25].
Measuring Impact and Implementing Policies
Analyzing Carbon Footprints and Social Impact
To gauge the effectiveness of policies, it's essential to track both environmental and social outcomes. One clear indicator comes from insurance premiums. Between 2020 and 2023, the average homeowners insurance premium increased by 33%, reflecting a 13% rise after adjusting for inflation. By separating insurance costs from mortgage escrow payments, foundations can monitor how climate risks are being priced in specific markets and assess whether interventions are easing this financial burden [26][28].
Property valuation analysis reveals that environmental risks, like rising sea levels, can artificially inflate property values. For instance, residential properties vulnerable to flooding are estimated to be overvalued by more than $200 billion [27]. Monitoring this discrepancy helps determine if policies are effectively redirecting development from high-risk areas or merely delaying inevitable losses.
Social impact metrics are equally revealing. Linking disaster relief data with consumer credit records shows that receiving federal disaster loans reduces the likelihood of bankruptcy by 61% within three years of a disaster [26]. In 2023 alone, 2.4 million Americans were displaced by disasters, with 16% still unable to return home. Tracking displacement and recovery rates offers vital insights into the success of policies aimed at aiding recovery [27].
"Price signals from insurance premiums are the most direct information most households have on their risk, and these signals should induce responses in the form of resilience investments or exit." – Benjamin J. Keys, Professor, University of Pennsylvania [26]
In addition to historical data, catastrophe modeling provides a forward-looking lens to evaluate whether policies are reducing vulnerability under evolving conditions. For example, adopting construction standards like FORTIFIED - which can lower the frequency of losses by 55% to 74% during severe weather - demonstrates the tangible benefits of robust building codes [27]. By tracking both process and outcome metrics, policymakers can gain a comprehensive understanding of their impact [29]. These tools and methods create a foundation for actionable strategies, as seen in Council Fire’s tailored consulting solutions.
Partnering with Council Fire for Sustainability Consulting
Council Fire specializes in turning data into actionable strategies, helping organizations measure and act on their environmental impact. Their work includes establishing greenhouse gas (GHG) inventories across Scopes 1, 2, and 3 and setting science-based targets aligned with 1.5°C climate pathways. For instance, a state Department of Transportation partnered with Council Fire to create a phased fleet electrification strategy, aiming to cut fleet emissions by 65% by 2035 [30].
Beyond impact measurement, Council Fire focuses on building robust data systems to guide strategic resilience investments. This involves enhancing data infrastructure through standardized semantics, metadata, and interoperable systems to ensure reliable climate performance metrics. Their approach also includes vulnerability assessments that examine exposure to climate hazards, the sensitivity of infrastructure and populations, and the adaptive capacity to respond [29]. By prioritizing stakeholder needs, Council Fire ensures that resilience investments are paired with protections like affordable housing to minimize unintended displacement.
Comparison of Data Tools for Climate and Housing Policy
Comparison of Climate and Housing Data Tools for Foundations
This section highlights the distinct strengths of various data tools to aid strategic decision-making for foundations. Choosing the right tool depends on clearly defined objectives.
CMRA (Climate Mapping for Resilience and Adaptation) stands out for its ability to project future climate conditions. It offers climate projections across three future periods (2015–2099) under two Representative Concentration Pathway (RCP) scenarios: RCP 4.5 and RCP 8.5 [7][32]. This focus on long-term trends makes it particularly useful for evaluating the safety of potential housing development sites against risks such as extreme heat, drought, wildfires, flooding, and coastal inundation over decades [7].
Meanwhile, tools like EPA EJScreen excel in providing detailed demographic data. EJScreen delivers granular geographic insights at the Census Block Group level, typically representing populations of 500 to 3,000 people [32][15]. It is a key resource for identifying communities that face both environmental challenges and socioeconomic disadvantages. For federal funding applications, EJScreen’s Supplemental Indexes are invaluable. For example, the Greenhouse Gas Reduction Fund (GGRF) identifies disadvantaged communities as those ranking at or above the 90th percentile on these indexes [15].
FEMA's National Risk Index (NRI) focuses on economic vulnerability, using Expected Annual Loss (EAL) calculations that integrate hazard exposure with social and resilience factors [31]. This makes it a critical tool for pinpointing areas where disasters are likely to cause the greatest financial damage and identifying communities with limited capacity to recover [31].
On the other hand, Energy Star operates at the building level, benchmarking energy use and emissions to support decarbonization efforts. By evaluating building performance, Energy Star provides detailed data that complements broader geographic and socioeconomic insights offered by CMRA, EPA EJScreen, and FEMA’s NRI. Together, these tools enable foundations to allocate resources effectively and drive impactful climate-resilient housing policies.
Conclusion
Foundations face an urgent need to tackle the intertwined challenges of climate change and housing with tools grounded in data and evidence. The strategies highlighted here - ranging from mapping tools and environmental justice screening to predictive modeling and building efficiency benchmarking - offer a solid framework for informed decision-making. However, success lies in combining these tools with local expertise and customized approaches to achieve meaningful outcomes.
Recent grant programs illustrate these principles in action. For instance, the 2024 Robert Wood Johnson Foundation's "Local Data for Equitable Communities" initiative supported thirty organizations nationwide in transforming data into tangible results. In Tucson, Arizona, the Sonora Environmental Research Institute assessed climate vulnerabilities in housing to better allocate sustainability resources in response to rising desert temperatures. Similarly, in New Mexico, the Ramah Navajo School Board conducted housing quality evaluations to advocate for investments in tribal housing initiatives[1].
As climate data continues to advance, strategies for policy must also evolve. Foundations can play a critical role by funding community-driven data collection efforts, creating public dashboards to monitor key metrics like tenant instability and corporate property ownership, and ensuring regular, comprehensive risk assessments[1]. With over $1.1 trillion in assets under management but only 5% currently allocated to impact investments[3], philanthropic organizations have an immense opportunity to expand these efforts and amplify their environmental and social contributions.
For those seeking to transform data into actionable sustainability outcomes, Council Fire offers a pathway. From analyzing carbon footprints to fostering stakeholder collaboration, Council Fire helps organizations align their sustainability goals with system-level results, delivering long-term benefits across environmental, social, and economic dimensions. These efforts echo the strategic approaches outlined above, bridging insights with impactful action.
FAQs
Which data tool should we start with for our region?
To get started in your region, consider using the Community Assessment Reporting Tool (CART). This tool provides a wealth of detailed information, including data on HUD investments, property details, and demographic statistics across different geographic areas. By leveraging CART, you can pinpoint local vulnerabilities and make informed decisions about climate and housing policies.
How do we combine climate risk and equity data correctly?
Integrating climate risk and equity data involves merging various datasets to create a thorough understanding of vulnerabilities. Tools such as climate risk assessments can pinpoint areas most at risk, while local data on housing, displacement, and socioeconomic conditions provide critical context. By synthesizing these datasets, it's possible to identify communities that simultaneously face significant climate threats and social inequities. This approach ensures that solutions are both targeted and fair, addressing climate adaptation alongside social resilience.
What impact metrics should we track over time?
Tracking specific metrics is essential for understanding and improving housing stability and resilience in the face of climate challenges. Key areas to monitor include:
Housing affordability: This can be measured by the percentage of households facing high cost burdens.
Displacement and eviction rates: These figures reveal how often individuals and families are forced to leave their homes.
Housing stock condition and safety: Evaluating the quality and safety of housing structures helps identify areas in need of improvement.
Climate resilience indicators: Metrics such as the frequency and severity of natural disasters provide insight into how well housing systems withstand environmental risks.
Insurance claims and premiums: Tracking these, especially those tied to climate risks, highlights the financial impacts on homeowners and communities.
By consistently monitoring these metrics over time, policymakers can gauge the effectiveness of initiatives aimed at enhancing housing stability and building resilience against climate-related challenges.
Related Blog Posts
How to Embed Equity in Local Resilience Planning for Municipalities & Government Agencies
How to Use Data to Inform Climate and Housing Policy for Municipalities & Government Agencies
How to Use Data to Inform Climate and Housing Policy for Corporations
How to Use Data to Inform Climate and Housing Policy for NGOs & Nonprofits
Latest Articles
©2026
Narrative Change and Power Building: The Missing Half of Advocacy
Narrative change is the process of disrupting dominant narratives that normalize inequity and advancing new narratives from historically marginalized communities.
Funding Resilience Without Federal Grants
BRIC is unreliable and FEMA is shrinking. Here's how cities fund climate resilience with dedicated revenue, blended finance, and a coordinating authority.
The ESG Blind Spot: How AI Is Finding Risks in Companies Nobody Else Is Watching
Norway's sovereign wealth fund uses AI to screen 7,200 portfolio companies for forced labor and corruption within 24 hours. The real story is the emerging-market coverage gap that traditional ESG data vendors miss — and what it means for any company with a global supply chain.
FAQ
01
What does it really mean to “redefine profit”?
02
What makes Council Fire different?
03
Who does Council Fire work with?
04
What does working with Council Fire actually look like?
05
How does Council Fire help organizations turn big goals into action?
06
How does Council Fire define and measure success?
07
How does technology fit into Council Fire’s work?
Apr 20, 2026
How to Use Data to Inform Climate and Housing Policy for Foundations & Philanthropic Organizations
Sustainability Strategy
In This Article
Use mapping, EJScreen, FEMA, ENERGY STAR and predictive models to target funding for equitable, climate-resilient housing.
How to Use Data to Inform Climate and Housing Policy for Foundations & Philanthropic Organizations
$1.1 trillion in assets, but only 5% allocated to impact investments. This stark contrast highlights the untapped potential for foundations and philanthropic organizations to address two pressing issues: climate change and housing insecurity. Data-driven strategies can bridge this gap, offering actionable insights to allocate resources effectively and create long-term solutions.
Key takeaways:
Climate and housing challenges are intertwined: Extreme heat kills over 1,220 Americans annually, while housing insecurity increases job loss risks by 22%.
Data tools guide impactful decisions: Tools like EPA's EJScreen, FEMA's National Risk Index, and ENERGY STAR Portfolio Manager help identify vulnerable communities, assess risks, and improve building performance.
Predictive models ensure future resilience: These models help avoid high-risk areas for housing development and align with emissions reduction goals.
Foundations can leverage these insights to drive smarter investments, reduce risks, and support equitable housing policies that address systemic inequalities and climate vulnerabilities.
Climate Action in Practice: How Data, AI, and Advocacy Are Reshaping Policy
Assessing Climate Risks and Vulnerabilities
To address climate challenges effectively, foundations must identify where environmental hazards intersect with social vulnerabilities. This involves pinpointing neighborhoods that face the highest combined risks due to climate threats and long-standing inequities.
Climate vulnerability isn't just about exposure to extreme weather. As the Environmental Defense Fund highlights:
Better understanding of the intersection of vulnerability and climate change risks is key to effectively building resilience because it helps define where climate action and investments are needed most [8].
Factors such as housing quality, infrastructure resilience, and economic stability - often shaped by systemic inequalities - play a significant role in determining how well communities can endure climate impacts. Mapping tools are essential for uncovering these critical intersections and guiding targeted action.
Using Mapping Tools for Climate Risk Assessment
Federal tools provide valuable insights into climate risks at a detailed level. The Climate Mapping for Resilience and Adaptation (CMRA) focuses on five major hazards: extreme heat, drought, wildfires, flooding, and coastal inundation [7]. With its free, user-friendly platform, CMRA allows users to search by address or county and view projections across three future time frames.
For a broader analysis, the U.S. Climate Vulnerability Index (CVI), developed by the Environmental Defense Fund and Texas A&M University, combines 184 indicators to assess cumulative vulnerability across more than 70,000 U.S. Census tracts [4][6]. This tool integrates data on health conditions, housing characteristics, and infrastructure gaps with climate impacts, offering a comprehensive view of community risks.
Census tracts, typically housing between 1,000 and 8,000 people (with an average of 4,000), provide the fine-grained detail necessary for local interventions. Unlike county-level data, which can obscure disparities, these granular projections help target resources to the neighborhoods most in need. Such precision ensures housing initiatives directly address the communities facing the greatest risks.
Identifying High-Risk Communities
Layering demographic and housing data onto mapping results further sharpens the focus on vulnerable neighborhoods. The CVI's "Top Drivers" feature identifies whether a community's vulnerability stems more from climate hazards, such as flooding, or baseline issues like poor housing conditions and infrastructure deficits [5]. This distinction is critical for designing effective solutions.
Key housing metrics in the CVI include redlining history, the prevalence of mobile homes, foreclosure risk, overcrowding, and the age of housing stock [10][11]. These indicators link climate vulnerability directly to housing policy needs. For instance, African Americans are 40% more likely to live in areas where extreme temperatures will result in higher mortality rates [9]. Such disparities often trace back to housing quality and location, underscoring the importance of targeted interventions in these communities.
Combining Environmental Justice and Socioeconomic Data
Crafting effective policies requires blending physical risk data with insights into social vulnerabilities. Environmental justice data highlights how pollution, climate risks, and socioeconomic challenges often intersect, creating disproportionate impacts on certain communities. By merging these datasets, organizations can design strategies that address both environmental risks and the systemic inequities that worsen them.
By layering environmental burdens with socioeconomic indicators at the census tract level, hidden disparities come into focus. For example, a tract might face severe flooding risks, but the response will vary significantly if residents also struggle with high housing costs, limited English proficiency, or shorter life expectancies. These combined factors shape a community’s ability to prepare for, endure, and recover from climate-related challenges.
Using EPA's Environmental Justice Screening Tool
The EPA's EJScreen is a key resource for this type of analysis. It combines 13 environmental indicators - such as diesel particulate matter, traffic proximity, and ozone levels - with demographic data to create EJ Indexes and Supplemental Indexes [15][16]. The EJ Index calculates an average based on the percentage of low-income residents and people of color in a given area [15]. Meanwhile, the Supplemental Demographic Index digs deeper, incorporating five factors: low income, disability, limited English proficiency, lower educational attainment, and reduced life expectancy [15].
For housing-related policies, these Supplemental Indexes are especially useful. They highlight areas where environmental burdens overlap with socioeconomic vulnerabilities. For example, the Greenhouse Gas Reduction Fund (GGRF) defines disadvantaged communities as those in the 90th percentile or higher on EJScreen’s Supplemental Indexes [15]. This helps direct resources to areas where they can make the most impact.
EJScreen also includes lead paint exposure as a housing-specific indicator [15]. This is critical for identifying neighborhoods where children may face heightened health risks from older housing stock. When combined with income data, this information can guide housing rehabilitation efforts. While EJScreen’s percentile rankings allow for quick comparisons across regions, it’s important to supplement this data with local knowledge, as the tool’s data may be several years old [16].
To complement EJScreen’s demographic focus, FEMA offers a tool that quantifies the financial and human costs of climate events.
Incorporating FEMA's National Risk Index
The FEMA National Risk Index (NRI) provides a detailed look at potential losses from climate-related disasters. It calculates expected annual losses for buildings, populations, and agriculture across 14 natural hazards, including coastal flooding, heat waves, and hurricanes [13][14]. This data helps organizations identify not just where risks are high, but also the potential financial and human toll.
The NRI includes metrics like building and population loss rates [13]. For example, population loss rates consider one injury as equivalent to one-tenth of a fatality when calculating annual risk [13]. These metrics allow for direct comparisons of climate vulnerabilities across different hazards and regions, enabling more informed resource allocation.
When paired with socioeconomic data, the NRI becomes an even more effective tool for equitable policy-making. The Climate and Economic Justice Screening Tool (CEJST) integrates FEMA’s data with income thresholds to pinpoint disadvantaged communities. A tract is typically classified as disadvantaged if it ranks in the 90th percentile or higher for climate or environmental burdens and in the 65th percentile or higher for low income [13][14]. This dual-criteria approach ensures resources are directed to areas with both high physical risks and limited capacity to adapt.
Tool | Primary Methodology | Key Housing/Climate Indicators |
|---|---|---|
EPA EJScreen | Indexing (Environmental × Demographic) | Lead paint, diesel PM, traffic proximity, ozone [15] |
CEJST | Threshold-based (90th percentile burden + 65th percentile income) | Historic redlining, housing cost, green space, indoor plumbing [14] |
FEMA NRI | Expected Annual Loss (EAL) | Building loss rate, population loss rate, agriculture loss rate [14] |
CEJST also incorporates data on historic underinvestment, using 1935–1940 redlining maps, as well as indicators like high housing cost burdens (households earning under 80% of the Area Median Family Income and spending more than 30% on housing) and lack of indoor plumbing [13][14]. These metrics connect environmental justice to actionable housing initiatives, paving the way for investments that not only improve climate resilience but also address longstanding inequities. By integrating these tools, policymakers can create targeted strategies to enhance both housing equity and climate preparedness.
Improving Building Efficiency with Data
Addressing the buildings themselves is just as important as identifying vulnerable communities. Energy use directly impacts both emissions and tenant expenses, making building-level data a key resource for designing effective retrofits. By monitoring energy consumption, water usage, and emissions, organizations can identify inefficiencies and focus on upgrades that not only protect tenants but also align with climate objectives. This data serves as a bridge between recognizing community needs and implementing targeted improvements.
Energy performance benchmarking is now a standard in the commercial and multifamily housing sectors, with more state and local governments adopting ordinances and building performance standards [17]. This shift has made data more accessible than ever, but interpreting and using it effectively requires the right tools and partnerships.
Benchmarking Emissions and Energy Use with ENERGY STAR
The ENERGY STAR Portfolio Manager is one of the most widely used platforms for tracking building-level energy and water usage. Property owners can input monthly utility data to calculate key metrics like Energy Use Intensity (EUI) and receive an ENERGY STAR Score - a 1–100 rating often used by cities to set performance benchmarks and prioritize buildings for upgrades [21]. The Portfolio Manager Data Explorer contains energy data for over 150,000 U.S. properties, including commercial, multifamily, and single-family buildings, providing a valuable resource for comparing performance across similar structures [20].
For example, in September 2023, the City of San Francisco collaborated with local utility providers to deliver aggregated energy data directly to multifamily building owners via Portfolio Manager. This initiative boosted energy benchmarking participation by 20% and achieved a 15% reduction in energy consumption within the first year [18].
To streamline the benchmarking process, building owners should complete the ENERGY STAR data collection worksheet before entering their data. For those managing large property portfolios, automating data submission through utility partnerships or third-party services can greatly reduce administrative workloads and enable real-time performance monitoring [22]. Improving building efficiency not only supports climate-resilient housing initiatives but also helps lower tenant costs.
Collaborating with Utility Providers
Efficient data collection from utility companies is essential for successful energy management. Currently, more than 75 utilities across the U.S. offer aggregate whole-building data, which simplifies benchmarking in Portfolio Manager by removing the need for manual data entry [17]. This is especially crucial for multifamily properties where tenants pay utilities directly, making whole-building data inaccessible to property owners [18].
Utility data can be integrated into Portfolio Manager via API or spreadsheets. The API option is preferred for its speed and accuracy, as it automates data updates and provides actionable insights for creating more effective efficiency programs [17][19]. Building owners can use interactive ENERGY STAR maps to check if their local utilities support data services [22][23]. If not, standardized Data Request Reference Guides can help initiate the process [23].
"When thoughtfully deployed, utility data access solutions can address a clear customer need while also positioning the utility as a trusted partner to help building owners pursue their energy and sustainability goals." – ENERGY STAR [17]
Aggregate whole-building data ensures tenant privacy by preventing the identification of individual consumption patterns [23]. Tools like BETTER use monthly energy data to generate targeted, cost-effective efficiency recommendations [21].
Using Predictive Models for Climate-Resilient Housing
Predictive modeling is revolutionizing how housing policies adapt to the challenges of climate resilience. Beyond benchmarking, these models help guide the development of new housing by integrating diverse data sources - hazard probabilities, building exposure, and vulnerability assessments - to predict climate risks decades ahead. The aim is straightforward: ensure affordable housing is not built in areas that may become uninhabitable or uninsurable as climate conditions evolve. This method refines earlier data-driven evaluations and enhances decision-making for site selection.
These models rely on a mix of hazard data (like burn probability maps and meteorological inputs), high-resolution building exposure data, and vulnerability information such as building materials and fire mitigation features. When paired with Global Climate Models and emissions scenarios, they provide increasingly reliable projections of mid-century risks. For example, such forecasts can highlight wildfire-prone regions or areas susceptible to extreme weather events [12].
However, the accuracy and transparency of these models remain a challenge. A 2023 study comparing 13 risk model vendors revealed significant inconsistencies in results for the same locations, complicating trust and decision-making. Open-source initiatives like Open Climate Risk are addressing this by promoting transparency. Their platform, for instance, evaluates wildfire risk for approximately 156 million buildings across the contiguous U.S., using wind-driven spread modeling. This approach effectively predicts how embers bypass traditional fire barriers during high-wind conditions [12].
Siting New Housing in Climate-Safe Locations
Selecting locations for new housing requires more than avoiding obvious hazard zones. Tools like heat mapping, which illustrate urban temperature variations, are particularly useful. These maps help planners identify cooler areas within cities, reducing exposure to the urban heat island effect. Community-led temperature data collection projects further highlight high-heat zones where targeted cooling solutions may be necessary [2].
In wildfire-prone areas, wind-driven models play a crucial role in refining site selection. These models consider local wind patterns during "fire weather" days, offering insights into how fires spread from wildlands into urban areas. Validating these models against historical data, such as the Interagency Wildland Fire Perimeter History, ensures their reliability before making long-term housing investments.
The intersection of climate risk and affordable housing development is becoming increasingly apparent. In the U.S., there is a shortage of 7.1 million affordable rental homes for extremely low-income renters - a crisis worsened by rising construction costs and climate risks [24]. Predictive models can help identify locations that are likely to remain viable over time, minimizing the risk of stranded assets or forced displacement.
Aligning Housing with Decarbonization Goals
Where housing is built doesn’t just affect climate resilience - it also shapes transportation patterns and carbon emissions. By analyzing vehicle miles traveled (VMT), planners can pinpoint sites that reduce transportation-related emissions. For example, in Lima, Peru, a transport decarbonization initiative using predictive models projects a reduction of 0.64 tons of CO₂ equivalent by 2030 and 1.03 tons by 2050. These models also predict a significant shift in transportation habits, with bicycle use expected to grow from 0.9% in 2019 to 11.6% by 2050 [2].
"Too many households are forced to live far from their workplace, simply to find a home they can afford. But long commutes come with high stress, crushing transportation costs, and extra childcare expenses." – National Alliance to End Homelessness [24]
By situating housing near public transit and employment hubs, planners can reduce emissions and improve accessibility, especially during climate emergencies. Data from programs like IFC's EDGE, which certified 27% of new buildings in Colombia as green in 2022, demonstrates how green building standards and incentives can track and enhance energy and water efficiency during the design phase [2]. Foundations in the U.S. can leverage similar incentives to support energy-efficient solutions such as better insulation and advanced HVAC systems.
Predictive models should also factor in transportation accessibility during climate disruptions. This involves considering variables like route redundancy, travel-time increases, and reachability. Such layers ensure that housing remains accessible even when primary routes are blocked or damaged, a critical factor during natural disasters [25].
Measuring Impact and Implementing Policies
Analyzing Carbon Footprints and Social Impact
To gauge the effectiveness of policies, it's essential to track both environmental and social outcomes. One clear indicator comes from insurance premiums. Between 2020 and 2023, the average homeowners insurance premium increased by 33%, reflecting a 13% rise after adjusting for inflation. By separating insurance costs from mortgage escrow payments, foundations can monitor how climate risks are being priced in specific markets and assess whether interventions are easing this financial burden [26][28].
Property valuation analysis reveals that environmental risks, like rising sea levels, can artificially inflate property values. For instance, residential properties vulnerable to flooding are estimated to be overvalued by more than $200 billion [27]. Monitoring this discrepancy helps determine if policies are effectively redirecting development from high-risk areas or merely delaying inevitable losses.
Social impact metrics are equally revealing. Linking disaster relief data with consumer credit records shows that receiving federal disaster loans reduces the likelihood of bankruptcy by 61% within three years of a disaster [26]. In 2023 alone, 2.4 million Americans were displaced by disasters, with 16% still unable to return home. Tracking displacement and recovery rates offers vital insights into the success of policies aimed at aiding recovery [27].
"Price signals from insurance premiums are the most direct information most households have on their risk, and these signals should induce responses in the form of resilience investments or exit." – Benjamin J. Keys, Professor, University of Pennsylvania [26]
In addition to historical data, catastrophe modeling provides a forward-looking lens to evaluate whether policies are reducing vulnerability under evolving conditions. For example, adopting construction standards like FORTIFIED - which can lower the frequency of losses by 55% to 74% during severe weather - demonstrates the tangible benefits of robust building codes [27]. By tracking both process and outcome metrics, policymakers can gain a comprehensive understanding of their impact [29]. These tools and methods create a foundation for actionable strategies, as seen in Council Fire’s tailored consulting solutions.
Partnering with Council Fire for Sustainability Consulting
Council Fire specializes in turning data into actionable strategies, helping organizations measure and act on their environmental impact. Their work includes establishing greenhouse gas (GHG) inventories across Scopes 1, 2, and 3 and setting science-based targets aligned with 1.5°C climate pathways. For instance, a state Department of Transportation partnered with Council Fire to create a phased fleet electrification strategy, aiming to cut fleet emissions by 65% by 2035 [30].
Beyond impact measurement, Council Fire focuses on building robust data systems to guide strategic resilience investments. This involves enhancing data infrastructure through standardized semantics, metadata, and interoperable systems to ensure reliable climate performance metrics. Their approach also includes vulnerability assessments that examine exposure to climate hazards, the sensitivity of infrastructure and populations, and the adaptive capacity to respond [29]. By prioritizing stakeholder needs, Council Fire ensures that resilience investments are paired with protections like affordable housing to minimize unintended displacement.
Comparison of Data Tools for Climate and Housing Policy
Comparison of Climate and Housing Data Tools for Foundations
This section highlights the distinct strengths of various data tools to aid strategic decision-making for foundations. Choosing the right tool depends on clearly defined objectives.
CMRA (Climate Mapping for Resilience and Adaptation) stands out for its ability to project future climate conditions. It offers climate projections across three future periods (2015–2099) under two Representative Concentration Pathway (RCP) scenarios: RCP 4.5 and RCP 8.5 [7][32]. This focus on long-term trends makes it particularly useful for evaluating the safety of potential housing development sites against risks such as extreme heat, drought, wildfires, flooding, and coastal inundation over decades [7].
Meanwhile, tools like EPA EJScreen excel in providing detailed demographic data. EJScreen delivers granular geographic insights at the Census Block Group level, typically representing populations of 500 to 3,000 people [32][15]. It is a key resource for identifying communities that face both environmental challenges and socioeconomic disadvantages. For federal funding applications, EJScreen’s Supplemental Indexes are invaluable. For example, the Greenhouse Gas Reduction Fund (GGRF) identifies disadvantaged communities as those ranking at or above the 90th percentile on these indexes [15].
FEMA's National Risk Index (NRI) focuses on economic vulnerability, using Expected Annual Loss (EAL) calculations that integrate hazard exposure with social and resilience factors [31]. This makes it a critical tool for pinpointing areas where disasters are likely to cause the greatest financial damage and identifying communities with limited capacity to recover [31].
On the other hand, Energy Star operates at the building level, benchmarking energy use and emissions to support decarbonization efforts. By evaluating building performance, Energy Star provides detailed data that complements broader geographic and socioeconomic insights offered by CMRA, EPA EJScreen, and FEMA’s NRI. Together, these tools enable foundations to allocate resources effectively and drive impactful climate-resilient housing policies.
Conclusion
Foundations face an urgent need to tackle the intertwined challenges of climate change and housing with tools grounded in data and evidence. The strategies highlighted here - ranging from mapping tools and environmental justice screening to predictive modeling and building efficiency benchmarking - offer a solid framework for informed decision-making. However, success lies in combining these tools with local expertise and customized approaches to achieve meaningful outcomes.
Recent grant programs illustrate these principles in action. For instance, the 2024 Robert Wood Johnson Foundation's "Local Data for Equitable Communities" initiative supported thirty organizations nationwide in transforming data into tangible results. In Tucson, Arizona, the Sonora Environmental Research Institute assessed climate vulnerabilities in housing to better allocate sustainability resources in response to rising desert temperatures. Similarly, in New Mexico, the Ramah Navajo School Board conducted housing quality evaluations to advocate for investments in tribal housing initiatives[1].
As climate data continues to advance, strategies for policy must also evolve. Foundations can play a critical role by funding community-driven data collection efforts, creating public dashboards to monitor key metrics like tenant instability and corporate property ownership, and ensuring regular, comprehensive risk assessments[1]. With over $1.1 trillion in assets under management but only 5% currently allocated to impact investments[3], philanthropic organizations have an immense opportunity to expand these efforts and amplify their environmental and social contributions.
For those seeking to transform data into actionable sustainability outcomes, Council Fire offers a pathway. From analyzing carbon footprints to fostering stakeholder collaboration, Council Fire helps organizations align their sustainability goals with system-level results, delivering long-term benefits across environmental, social, and economic dimensions. These efforts echo the strategic approaches outlined above, bridging insights with impactful action.
FAQs
Which data tool should we start with for our region?
To get started in your region, consider using the Community Assessment Reporting Tool (CART). This tool provides a wealth of detailed information, including data on HUD investments, property details, and demographic statistics across different geographic areas. By leveraging CART, you can pinpoint local vulnerabilities and make informed decisions about climate and housing policies.
How do we combine climate risk and equity data correctly?
Integrating climate risk and equity data involves merging various datasets to create a thorough understanding of vulnerabilities. Tools such as climate risk assessments can pinpoint areas most at risk, while local data on housing, displacement, and socioeconomic conditions provide critical context. By synthesizing these datasets, it's possible to identify communities that simultaneously face significant climate threats and social inequities. This approach ensures that solutions are both targeted and fair, addressing climate adaptation alongside social resilience.
What impact metrics should we track over time?
Tracking specific metrics is essential for understanding and improving housing stability and resilience in the face of climate challenges. Key areas to monitor include:
Housing affordability: This can be measured by the percentage of households facing high cost burdens.
Displacement and eviction rates: These figures reveal how often individuals and families are forced to leave their homes.
Housing stock condition and safety: Evaluating the quality and safety of housing structures helps identify areas in need of improvement.
Climate resilience indicators: Metrics such as the frequency and severity of natural disasters provide insight into how well housing systems withstand environmental risks.
Insurance claims and premiums: Tracking these, especially those tied to climate risks, highlights the financial impacts on homeowners and communities.
By consistently monitoring these metrics over time, policymakers can gauge the effectiveness of initiatives aimed at enhancing housing stability and building resilience against climate-related challenges.
Related Blog Posts
How to Embed Equity in Local Resilience Planning for Municipalities & Government Agencies
How to Use Data to Inform Climate and Housing Policy for Municipalities & Government Agencies
How to Use Data to Inform Climate and Housing Policy for Corporations
How to Use Data to Inform Climate and Housing Policy for NGOs & Nonprofits
Latest Articles
©2026
Narrative Change and Power Building: The Missing Half of Advocacy
Narrative change is the process of disrupting dominant narratives that normalize inequity and advancing new narratives from historically marginalized communities.
Funding Resilience Without Federal Grants
BRIC is unreliable and FEMA is shrinking. Here's how cities fund climate resilience with dedicated revenue, blended finance, and a coordinating authority.
The ESG Blind Spot: How AI Is Finding Risks in Companies Nobody Else Is Watching
Norway's sovereign wealth fund uses AI to screen 7,200 portfolio companies for forced labor and corruption within 24 hours. The real story is the emerging-market coverage gap that traditional ESG data vendors miss — and what it means for any company with a global supply chain.
FAQ
What does it really mean to “redefine profit”?
What makes Council Fire different?
Who does Council Fire work with?
What does working with Council Fire actually look like?
How does Council Fire help organizations turn big goals into action?
How does Council Fire define and measure success?
How does technology fit into Council Fire’s work?