
Sep 5, 2026
Cloud vs On-Premise: ICT Carbon Comparison
Sustainability Strategy
In This Article
Assess cloud vs on‑premise ICT carbon using utilization, PUE, power mix and hardware lifecycle to determine the lower‑carbon option.
Cloud vs On-Premise: ICT Carbon Comparison
Cloud is not always lower-carbon, and on-premise is not always worse. I’d judge it by four things first: utilization, power source, facility efficiency, and hardware lifespan.
In plain terms, cloud often comes out lower when on-premise servers sit mostly idle, since many servers still use 60–90% of peak power even at low load and many private data centers run at only 15–25% utilization. Cloud can cut that waste by pooling demand and pushing utilization much higher. But on-premise can stay close - or sometimes win - if I have steady workloads, a low-PUE facility, a cleaner local grid or direct power buying, and I keep hardware in service longer.
Here’s the short version I’d use before making any call:
Check day-to-day electricity first. In many data centers, power use makes up the biggest share of emissions.
Look at utilization. Low-use on-premise servers often waste power.
Look at PUE. A facility at 1.8 PUE uses far more total electricity than one near 1.1 for the same IT load.
Count hardware manufacturing. A server can add hundreds to more than 1,000 kg CO₂e before it even starts work.
Check grid location. A workload in a coal-heavy U.S. region can look very different from the same workload in the Pacific Northwest.
Do not trust black-box estimates. Boundaries, Scope 2 method, hardware life, and allocation rules can change the answer.
How to measure your cloud carbon footprint - Thoughtworks Technology Podcast
Quick Comparison
Factor | Cloud tends to look lower when... | On-premise tends to look lower when... |
|---|---|---|
Workload pattern | Demand is spiky, seasonal, or uneven | Demand is steady and easy to size |
Utilization | Current server use is low | Server use stays high over time |
Facility power use | Provider runs very efficient sites | My facility has low PUE and tight controls |
Power mix | Provider has cleaner power supply or better siting | I use a cleaner grid, on-site power, or direct contracts |
Hardware carbon | Shared gear stays busy for years | I extend life, repair parts, and avoid early refresh |
Reporting | Provider gives clear methods and usable data | I meter directly and track hardware and electricity myself |
If I compare like for like - same workload, same time period, same reporting boundaries - the answer usually becomes clear: cloud often wins on low-use, high-spike workloads; on-premise can compete on stable loads with efficient facilities and long hardware life.
Day-to-day carbon: energy use, utilization, and cooling
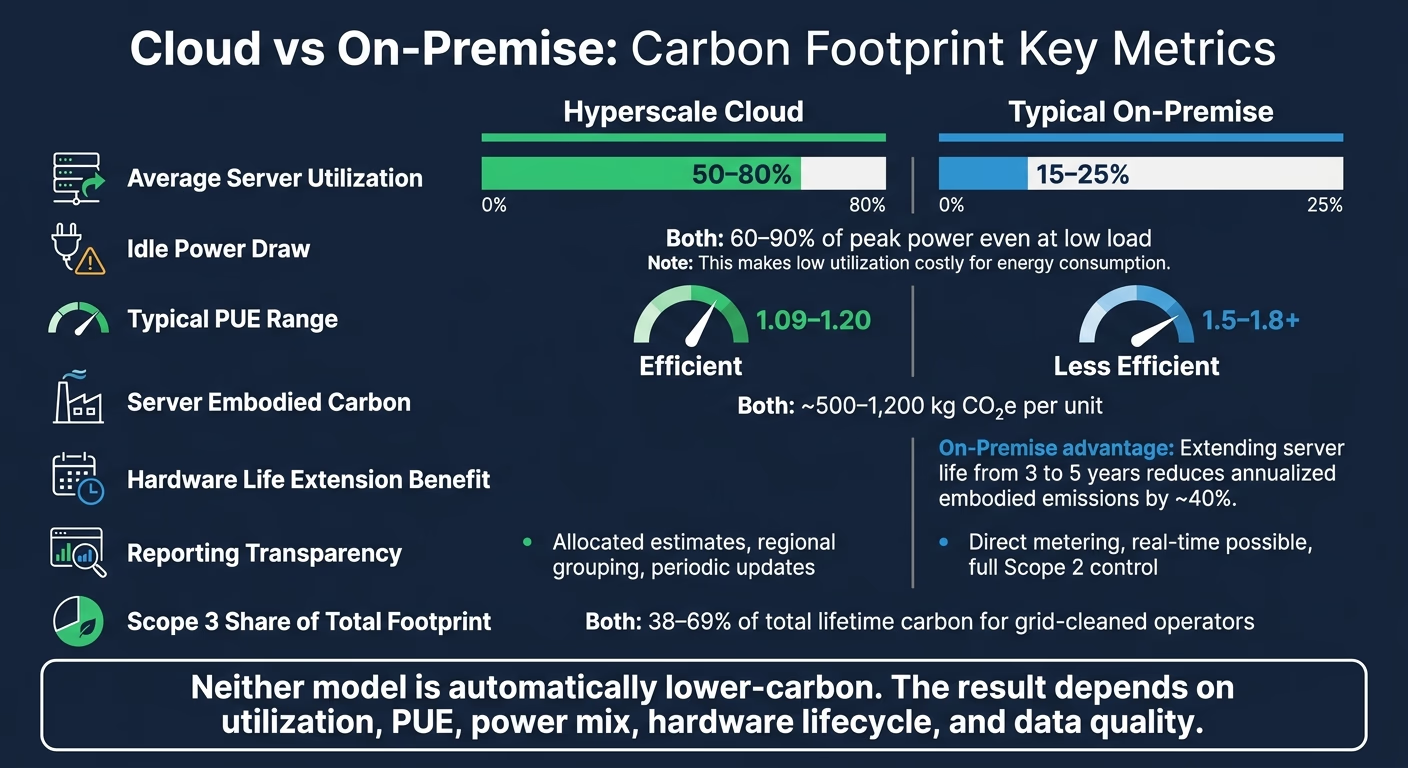
Cloud vs On-Premise ICT Carbon Footprint: Key Metrics Compared
Utilization rates and idle energy waste
The biggest day-to-day gap comes down to utilization. In many U.S. enterprise data centers, servers run at only about 15–25% utilization on average because teams size for peak demand, not steady demand. That includes spikes like month-end processing, seasonal traffic, and disaster recovery needs. [3][7][1]
That sounds manageable until you look at idle power. Even when a server is doing little work, it still pulls a large share of its peak electricity use, often 60–90% of peak at low load. [2] In plain terms, a lot of power gets burned just keeping underused machines ready.
Cloud providers cut much of that waste through scale. By pooling workloads across many tenants and time zones, they can push utilization to about 65%, compared with roughly 15% on-premise, while using fewer servers for the same application. [7] The reason is pretty simple: one customer's busy period can line up with another customer's slow period, so capacity gets used instead of sitting there waiting.
Cooling, PUE, and facility overhead
PUE measures how much extra electricity a facility uses beyond the power going straight to IT equipment. A PUE of 1.5 means facility systems add 50% on top of IT energy use. [4][8][13] In many U.S. enterprise data centers, PUE often lands in the 1.5–1.8 range. Leading hyperscale operators, by contrast, report fleet-wide PUE near 1.09–1.20. [15][17][18]
That gap matters. At PUE 1.8 versus 1.1, the same IT workload needs much more total facility electricity. Cooling, power distribution, and other building systems all add to the bill. Still, lower facility overhead doesn't make the whole carbon story disappear. Embodied emissions from making and replacing hardware are still part of the picture.
The table below shows the usual day-to-day differences in the U.S.:
Factor | Typical On-Premise | Hyperscale Cloud |
|---|---|---|
Average server utilization | ||
Typical PUE range | ||
Regional electricity carbon intensity | Cleaner-grid siting and large-scale renewable PPAs [3][7][6] |
An efficient on-premise facility can shrink the operating gap if it pairs PUE near 1.3–1.4 [4][2][3] with modern cooling, strong virtualization, and access to a low-carbon regional grid. In that kind of setup, on-premise can get closer on day-to-day emissions. After that, the full lifecycle result depends more on hardware turnover and procurement choices.
Embodied carbon and hardware lifecycle
Operational carbon is only half the story. The other half starts long before a workload ever runs: manufacturing. Every server, storage array, and network switch comes with emissions baked in from production. Typical server embodied carbon is roughly 500–1,200 kg CO₂e per unit.[3] What matters next is simple: how long that hardware stays in service, and how much useful work it does during that time.
If a machine runs hard for years, its manufacturing emissions are spread across more compute. If it sits underused or gets replaced too soon, each unit of compute carries a heavier carbon cost.
How cloud can cut embodied emissions
Cloud tends to do well on embodied carbon when shared infrastructure stays busy. An 800 kg CO₂e server delivers a lot more useful output when many workloads use it than when it spends most of its life idling in a private data center. That’s the basic math.
Cloud providers can also keep hardware in use across more roles before final retirement. Retired systems may move into backup, test, or lower-tier services instead of going straight out of service.[20][21] That kind of reuse helps stretch the value of the original manufacturing footprint.
Major providers now publish fleet-level methods for embodied carbon accounting, which is a step in the right direction. Still, customer access to hardware-level data is limited.[23][24][25] So while the top-line claims may look strong, checking them at a granular level is often hard.
When on-premise performs well on lifecycle carbon
For on-premise systems, refresh policy often decides the outcome. Extending server life from three to five years can reduce annualized embodied emissions by roughly 40%, as long as the older machines do not become so energy-hungry that operating emissions wipe out the gain.[3] In plain terms, replacing gear later can cut carbon - but only if that gear still runs efficiently enough.
That makes refresh timing a direct carbon lever for infrastructure teams. A fixed replacement cycle may look tidy on a spreadsheet, but it can push out hardware that still has plenty of useful life left.
Targeted upgrades can help even more. Swapping only the storage arrays or compute nodes that are actual efficiency bottlenecks - instead of refreshing full racks on a depreciation schedule - avoids the manufacturing emissions tied to equipment that still performs well enough.[3][21][22] The same logic applies to buying hardware built for repair and partial replacement. Procurement policies that favor modular systems, repairable designs, and vendors that support refurbishment can extend hardware life further.[3][21][22]
The core tradeoff comes down to control. Cloud puts lifecycle management in the provider’s hands. On-premise gives buyers direct control over refresh timing, reuse, and repair.
In practice, the lower-carbon path is usually the one with better utilization, longer hardware life, and clearer lifecycle data. The sticking point is visibility: who can actually see the hardware data needed to check these lifecycle claims?
Control, transparency, and carbon reporting gaps
After energy use and hardware lifespan, the next issue is simple: can you trust the carbon numbers you're looking at?
Direct control versus shared-service opacity
Transparency matters because cloud and on-premise report carbon data in very different ways. With on-premise infrastructure, organizations have direct control over the main emissions drivers. Teams can pick the facility location, work out utility contracts, sign power purchase agreements, install on-site solar, and measure energy use at the rack or room level. That level of detail makes it possible to track location-based Scope 2 emissions against the actual U.S. grid mix at each site. Reporting lag is also in the company’s hands.
Cloud changes that setup. Customers still control workload design - instance sizing, job scheduling, and serverless architecture - but the provider controls facility operations, cooling, and grid mix. What customers usually get back are allocated emissions estimates, often grouped by region or service. The emissions are still there; the reporting path is just less direct.[26][27][28][29] And that matters. Weak visibility can blur the answer. The numbers - not the hosting model alone - settle the debate.
That’s why reporting quality matters just as much as infrastructure choice.
Dimension | On-Premise | Cloud |
|---|---|---|
Supplier data visibility | High - direct utility contracts, hardware specs, and meter data | Lower - depends on provider disclosures and dashboards |
Hourly/location-based carbon data | Possible through direct metering and local grid tracking | Uneven - often regional or periodic rather than site-specific |
Scope 3 attribution | Organization controls hardware lifecycle and disposal assumptions | Opaque - depends on provider allocation methods for shared hardware |
Reporting latency | Real-time possible with internal monitoring systems | Often periodic, with annual or quarterly updates |
Both models run into the same hard problem with Scope 3. On-premise teams have to account for embodied carbon in servers, networking gear, and facility construction. Cloud customers rely on provider disclosures about hardware refresh cycles and shared-use allocation, and those figures are rarely detailed enough to check on their own. Scope 3 can make up 38–69% of total lifetime carbon footprint for operators that have already cleaned up their grid electricity supply.[30] Even so, only 18% of companies in MSCI's investable market index reported Scope 3 emissions at all as of 2020.[19]
What decision-makers should ask for in carbon reports
A sound ICT carbon comparison - whether cloud or on-premise - needs the same inputs on both sides. If not, you’re lining up numbers built on different assumptions and calling it a fair match.
Reports should clearly state:
Scope 1, 2, and 3 boundaries
Location-based and market-based Scope 2
PUE method
Utilization rates
Hardware lifetimes and refresh cycles
Embodied carbon assumptions
Allocation rules
Time granularity matters too. Annual averages can flatten major swings in U.S. grid carbon intensity by hour and region. If the report doesn’t show where the boundary lines sit, two organizations can assess the same workload and produce very different carbon totals - both technically correct under their own method, yet impossible to compare side by side.
Those reporting gaps often shape which model looks lower-carbon.
When cloud is lower-carbon, when on-premise is lower-carbon, and how to decide
The right way to compare cloud and on-premise is lifecycle accounting. That means looking at operational electricity and embodied emissions, with utilization and hardware life doing most of the heavy lifting.
Once you account for utilization, cooling, and reporting gaps, the next step is simple in theory but messy in practice: look at which workloads and power sources lean each way.
Scenarios where cloud typically lowers footprint
Cloud tends to cut emissions most when it replaces on-prem capacity that sits around doing very little. The big reason is consolidation. When workloads are pooled across many tenants and time zones, compute that would otherwise stay idle gets used more often.
That matters a lot for organizations with uneven demand. Think seasonal e-commerce, batch analytics, or dev/test environments. In those cases, cloud elasticity lets energy use follow actual demand instead of forcing the business to keep enough equipment ready for peak load all year.
That said, this edge gets smaller when demand is steady and the on-prem setup is already run well.
Scenarios where on-premise can match or beat cloud
On-premise can compete when demand is stable and predictable, the facility is run well, and the electricity supply is already low-carbon. A purpose-built or well-maintained data center with a PUE in the 1.2–1.4 range and access to on-site renewables or a clean regional grid can get close to hyperscale efficiency.[31]
But that only holds if capacity and refresh cycles are managed with care. On-prem can stay competitive when capacity is right-sized, utilization remains high, and hardware is replaced only when the efficiency gains are large enough to justify the new embodied carbon. Without that kind of control, it’s easy to drift into overprovisioning and waste.
In plain terms, the choice usually comes down to workload shape, power mix, and how tightly the hardware estate is managed.
Conclusion: the lowest-carbon model depends on workload, power, and data quality
Neither cloud nor on-premise is automatically lower-carbon. The result shifts based on the operating conditions, not the label. The table below shows the factors that usually tilt the answer one way or the other.
Variable | Favors Cloud | Favors On-Premise | Key Decision Risk |
|---|---|---|---|
Workload variability | Highly variable or spiky demand | Stable, predictable baseload | Cloud elasticity can encourage workload expansion |
Average utilization | Low current utilization | Consistently high utilization | Overprovisioned cloud instances offset consolidation gains |
Power mix | Carbon-intensive local grid; provider procures renewable power at scale | On-site renewables or a clean regional grid | Opaque renewable claims without clear methodology |
Facility efficiency (PUE) | On-premise facilities with high PUE | Purpose-built facility with low PUE | Deferred efficiency investment erodes the on-premise advantage |
Hardware lifecycle | Aging equipment with poor energy efficiency | Long, well-managed lifecycles with disciplined refresh | Weak lifecycle management increases embodied emissions |
Reporting quality | Provider offers detailed, methodology-disclosed carbon data | Internal metering with direct Scope 2 and Scope 3 tracking | Black-box cloud calculators or incomplete internal Scope 3 coverage |
The lower-carbon option depends on workload shape, power mix, hardware life, and data quality. Compare like for like, then test that answer against your own utilization, cooling efficiency, and refresh cycle.
FAQs
How do I compare cloud and on-premise fairly?
Compare them with site-specific data under the GHG Protocol, not broad assumptions. Treat cloud as a material Scope 3 Category 1 source, and use provider data where possible instead of spend-based estimates.
For on-premise, measure actual energy use and cooling load. In both cases, include the full hardware lifecycle, regional grid carbon intensity, and a clear, documented method.
When can on-premise have a lower carbon footprint?
On-premise infrastructure can produce a lower carbon footprint when a company runs in a region with a much cleaner power grid than the cloud regions it can access.
That edge can grow when the organization has direct control over server efficiency, cooling systems, and the use of renewable power. In that case, local decisions matter. A well-run data center on a cleaner grid may emit less than cloud workloads placed in regions that rely more heavily on carbon-intensive electricity.
Cloud cost and performance tuning tools help, of course, but they don't always erase the impact of where the workload actually runs. If the available cloud region uses dirtier power, those gains may only go so far.
What data do I need to estimate ICT carbon accurately?
To estimate ICT carbon with care, move past spend-based math and lean on activity-based data plus supplier-specific inputs. That shift gives you a much clearer picture of what’s driving emissions instead of relying on broad dollar-based averages.
Screen all 15 GHG Protocol Scope 3 categories, then focus first on the sources that make up more than 5% of your footprint. That helps teams spend time where it matters most.
For cloud services, ask providers like AWS or Azure for customer-specific footprint data. For hardware and facilities, track procurement volumes and primary utility data, including kWh. Use recognized emission factor databases, and document your methods, assumptions, and data quality.
A simple way to think about it:
Cloud: Get customer-level emissions data from providers when available.
Hardware and facilities: Track what you buy and what you use, especially electricity consumption in kWh.
Calculation approach: Use recognized emission factor databases and keep a clear record of how numbers were derived.
That paper trail matters. If someone asks how a figure was calculated six months later, you don’t want to be piecing it together from old spreadsheets and half-remembered notes.
Related Blog Posts
Latest Articles
©2026

Narrative Change and Power Building: The Missing Half of Advocacy
Narrative change is the process of disrupting dominant narratives that normalize inequity and advancing new narratives from historically marginalized communities.

Funding Resilience Without Federal Grants
BRIC is unreliable and FEMA is shrinking. Here's how cities fund climate resilience with dedicated revenue, blended finance, and a coordinating authority.

The ESG Blind Spot: How AI Is Finding Risks in Companies Nobody Else Is Watching
Norway's sovereign wealth fund uses AI to screen 7,200 portfolio companies for forced labor and corruption within 24 hours. The real story is the emerging-market coverage gap that traditional ESG data vendors miss — and what it means for any company with a global supply chain.
Narrative Change and Power Building: The Missing Half of Advocacy
Narrative change is the process of disrupting dominant narratives that normalize inequity and advancing new narratives from historically marginalized communities.
Funding Resilience Without Federal Grants
BRIC is unreliable and FEMA is shrinking. Here's how cities fund climate resilience with dedicated revenue, blended finance, and a coordinating authority.
The ESG Blind Spot: How AI Is Finding Risks in Companies Nobody Else Is Watching
Norway's sovereign wealth fund uses AI to screen 7,200 portfolio companies for forced labor and corruption within 24 hours. The real story is the emerging-market coverage gap that traditional ESG data vendors miss — and what it means for any company with a global supply chain.
FAQ
01
What does it really mean to “redefine profit”?
02
What makes Council Fire different?
03
Who does Council Fire work with?
04
What does working with Council Fire actually look like?
05
How does Council Fire help organizations turn big goals into action?
06
How does Council Fire define and measure success?
07
How does technology fit into Council Fire’s work?
Sep 5, 2026
Cloud vs On-Premise: ICT Carbon Comparison
Sustainability Strategy
In This Article
Assess cloud vs on‑premise ICT carbon using utilization, PUE, power mix and hardware lifecycle to determine the lower‑carbon option.
Cloud vs On-Premise: ICT Carbon Comparison
Cloud is not always lower-carbon, and on-premise is not always worse. I’d judge it by four things first: utilization, power source, facility efficiency, and hardware lifespan.
In plain terms, cloud often comes out lower when on-premise servers sit mostly idle, since many servers still use 60–90% of peak power even at low load and many private data centers run at only 15–25% utilization. Cloud can cut that waste by pooling demand and pushing utilization much higher. But on-premise can stay close - or sometimes win - if I have steady workloads, a low-PUE facility, a cleaner local grid or direct power buying, and I keep hardware in service longer.
Here’s the short version I’d use before making any call:
Check day-to-day electricity first. In many data centers, power use makes up the biggest share of emissions.
Look at utilization. Low-use on-premise servers often waste power.
Look at PUE. A facility at 1.8 PUE uses far more total electricity than one near 1.1 for the same IT load.
Count hardware manufacturing. A server can add hundreds to more than 1,000 kg CO₂e before it even starts work.
Check grid location. A workload in a coal-heavy U.S. region can look very different from the same workload in the Pacific Northwest.
Do not trust black-box estimates. Boundaries, Scope 2 method, hardware life, and allocation rules can change the answer.
How to measure your cloud carbon footprint - Thoughtworks Technology Podcast
Quick Comparison
Factor | Cloud tends to look lower when... | On-premise tends to look lower when... |
|---|---|---|
Workload pattern | Demand is spiky, seasonal, or uneven | Demand is steady and easy to size |
Utilization | Current server use is low | Server use stays high over time |
Facility power use | Provider runs very efficient sites | My facility has low PUE and tight controls |
Power mix | Provider has cleaner power supply or better siting | I use a cleaner grid, on-site power, or direct contracts |
Hardware carbon | Shared gear stays busy for years | I extend life, repair parts, and avoid early refresh |
Reporting | Provider gives clear methods and usable data | I meter directly and track hardware and electricity myself |
If I compare like for like - same workload, same time period, same reporting boundaries - the answer usually becomes clear: cloud often wins on low-use, high-spike workloads; on-premise can compete on stable loads with efficient facilities and long hardware life.
Day-to-day carbon: energy use, utilization, and cooling
Cloud vs On-Premise ICT Carbon Footprint: Key Metrics Compared
Utilization rates and idle energy waste
The biggest day-to-day gap comes down to utilization. In many U.S. enterprise data centers, servers run at only about 15–25% utilization on average because teams size for peak demand, not steady demand. That includes spikes like month-end processing, seasonal traffic, and disaster recovery needs. [3][7][1]
That sounds manageable until you look at idle power. Even when a server is doing little work, it still pulls a large share of its peak electricity use, often 60–90% of peak at low load. [2] In plain terms, a lot of power gets burned just keeping underused machines ready.
Cloud providers cut much of that waste through scale. By pooling workloads across many tenants and time zones, they can push utilization to about 65%, compared with roughly 15% on-premise, while using fewer servers for the same application. [7] The reason is pretty simple: one customer's busy period can line up with another customer's slow period, so capacity gets used instead of sitting there waiting.
Cooling, PUE, and facility overhead
PUE measures how much extra electricity a facility uses beyond the power going straight to IT equipment. A PUE of 1.5 means facility systems add 50% on top of IT energy use. [4][8][13] In many U.S. enterprise data centers, PUE often lands in the 1.5–1.8 range. Leading hyperscale operators, by contrast, report fleet-wide PUE near 1.09–1.20. [15][17][18]
That gap matters. At PUE 1.8 versus 1.1, the same IT workload needs much more total facility electricity. Cooling, power distribution, and other building systems all add to the bill. Still, lower facility overhead doesn't make the whole carbon story disappear. Embodied emissions from making and replacing hardware are still part of the picture.
The table below shows the usual day-to-day differences in the U.S.:
Factor | Typical On-Premise | Hyperscale Cloud |
|---|---|---|
Average server utilization | ||
Typical PUE range | ||
Regional electricity carbon intensity | Cleaner-grid siting and large-scale renewable PPAs [3][7][6] |
An efficient on-premise facility can shrink the operating gap if it pairs PUE near 1.3–1.4 [4][2][3] with modern cooling, strong virtualization, and access to a low-carbon regional grid. In that kind of setup, on-premise can get closer on day-to-day emissions. After that, the full lifecycle result depends more on hardware turnover and procurement choices.
Embodied carbon and hardware lifecycle
Operational carbon is only half the story. The other half starts long before a workload ever runs: manufacturing. Every server, storage array, and network switch comes with emissions baked in from production. Typical server embodied carbon is roughly 500–1,200 kg CO₂e per unit.[3] What matters next is simple: how long that hardware stays in service, and how much useful work it does during that time.
If a machine runs hard for years, its manufacturing emissions are spread across more compute. If it sits underused or gets replaced too soon, each unit of compute carries a heavier carbon cost.
How cloud can cut embodied emissions
Cloud tends to do well on embodied carbon when shared infrastructure stays busy. An 800 kg CO₂e server delivers a lot more useful output when many workloads use it than when it spends most of its life idling in a private data center. That’s the basic math.
Cloud providers can also keep hardware in use across more roles before final retirement. Retired systems may move into backup, test, or lower-tier services instead of going straight out of service.[20][21] That kind of reuse helps stretch the value of the original manufacturing footprint.
Major providers now publish fleet-level methods for embodied carbon accounting, which is a step in the right direction. Still, customer access to hardware-level data is limited.[23][24][25] So while the top-line claims may look strong, checking them at a granular level is often hard.
When on-premise performs well on lifecycle carbon
For on-premise systems, refresh policy often decides the outcome. Extending server life from three to five years can reduce annualized embodied emissions by roughly 40%, as long as the older machines do not become so energy-hungry that operating emissions wipe out the gain.[3] In plain terms, replacing gear later can cut carbon - but only if that gear still runs efficiently enough.
That makes refresh timing a direct carbon lever for infrastructure teams. A fixed replacement cycle may look tidy on a spreadsheet, but it can push out hardware that still has plenty of useful life left.
Targeted upgrades can help even more. Swapping only the storage arrays or compute nodes that are actual efficiency bottlenecks - instead of refreshing full racks on a depreciation schedule - avoids the manufacturing emissions tied to equipment that still performs well enough.[3][21][22] The same logic applies to buying hardware built for repair and partial replacement. Procurement policies that favor modular systems, repairable designs, and vendors that support refurbishment can extend hardware life further.[3][21][22]
The core tradeoff comes down to control. Cloud puts lifecycle management in the provider’s hands. On-premise gives buyers direct control over refresh timing, reuse, and repair.
In practice, the lower-carbon path is usually the one with better utilization, longer hardware life, and clearer lifecycle data. The sticking point is visibility: who can actually see the hardware data needed to check these lifecycle claims?
Control, transparency, and carbon reporting gaps
After energy use and hardware lifespan, the next issue is simple: can you trust the carbon numbers you're looking at?
Direct control versus shared-service opacity
Transparency matters because cloud and on-premise report carbon data in very different ways. With on-premise infrastructure, organizations have direct control over the main emissions drivers. Teams can pick the facility location, work out utility contracts, sign power purchase agreements, install on-site solar, and measure energy use at the rack or room level. That level of detail makes it possible to track location-based Scope 2 emissions against the actual U.S. grid mix at each site. Reporting lag is also in the company’s hands.
Cloud changes that setup. Customers still control workload design - instance sizing, job scheduling, and serverless architecture - but the provider controls facility operations, cooling, and grid mix. What customers usually get back are allocated emissions estimates, often grouped by region or service. The emissions are still there; the reporting path is just less direct.[26][27][28][29] And that matters. Weak visibility can blur the answer. The numbers - not the hosting model alone - settle the debate.
That’s why reporting quality matters just as much as infrastructure choice.
Dimension | On-Premise | Cloud |
|---|---|---|
Supplier data visibility | High - direct utility contracts, hardware specs, and meter data | Lower - depends on provider disclosures and dashboards |
Hourly/location-based carbon data | Possible through direct metering and local grid tracking | Uneven - often regional or periodic rather than site-specific |
Scope 3 attribution | Organization controls hardware lifecycle and disposal assumptions | Opaque - depends on provider allocation methods for shared hardware |
Reporting latency | Real-time possible with internal monitoring systems | Often periodic, with annual or quarterly updates |
Both models run into the same hard problem with Scope 3. On-premise teams have to account for embodied carbon in servers, networking gear, and facility construction. Cloud customers rely on provider disclosures about hardware refresh cycles and shared-use allocation, and those figures are rarely detailed enough to check on their own. Scope 3 can make up 38–69% of total lifetime carbon footprint for operators that have already cleaned up their grid electricity supply.[30] Even so, only 18% of companies in MSCI's investable market index reported Scope 3 emissions at all as of 2020.[19]
What decision-makers should ask for in carbon reports
A sound ICT carbon comparison - whether cloud or on-premise - needs the same inputs on both sides. If not, you’re lining up numbers built on different assumptions and calling it a fair match.
Reports should clearly state:
Scope 1, 2, and 3 boundaries
Location-based and market-based Scope 2
PUE method
Utilization rates
Hardware lifetimes and refresh cycles
Embodied carbon assumptions
Allocation rules
Time granularity matters too. Annual averages can flatten major swings in U.S. grid carbon intensity by hour and region. If the report doesn’t show where the boundary lines sit, two organizations can assess the same workload and produce very different carbon totals - both technically correct under their own method, yet impossible to compare side by side.
Those reporting gaps often shape which model looks lower-carbon.
When cloud is lower-carbon, when on-premise is lower-carbon, and how to decide
The right way to compare cloud and on-premise is lifecycle accounting. That means looking at operational electricity and embodied emissions, with utilization and hardware life doing most of the heavy lifting.
Once you account for utilization, cooling, and reporting gaps, the next step is simple in theory but messy in practice: look at which workloads and power sources lean each way.
Scenarios where cloud typically lowers footprint
Cloud tends to cut emissions most when it replaces on-prem capacity that sits around doing very little. The big reason is consolidation. When workloads are pooled across many tenants and time zones, compute that would otherwise stay idle gets used more often.
That matters a lot for organizations with uneven demand. Think seasonal e-commerce, batch analytics, or dev/test environments. In those cases, cloud elasticity lets energy use follow actual demand instead of forcing the business to keep enough equipment ready for peak load all year.
That said, this edge gets smaller when demand is steady and the on-prem setup is already run well.
Scenarios where on-premise can match or beat cloud
On-premise can compete when demand is stable and predictable, the facility is run well, and the electricity supply is already low-carbon. A purpose-built or well-maintained data center with a PUE in the 1.2–1.4 range and access to on-site renewables or a clean regional grid can get close to hyperscale efficiency.[31]
But that only holds if capacity and refresh cycles are managed with care. On-prem can stay competitive when capacity is right-sized, utilization remains high, and hardware is replaced only when the efficiency gains are large enough to justify the new embodied carbon. Without that kind of control, it’s easy to drift into overprovisioning and waste.
In plain terms, the choice usually comes down to workload shape, power mix, and how tightly the hardware estate is managed.
Conclusion: the lowest-carbon model depends on workload, power, and data quality
Neither cloud nor on-premise is automatically lower-carbon. The result shifts based on the operating conditions, not the label. The table below shows the factors that usually tilt the answer one way or the other.
Variable | Favors Cloud | Favors On-Premise | Key Decision Risk |
|---|---|---|---|
Workload variability | Highly variable or spiky demand | Stable, predictable baseload | Cloud elasticity can encourage workload expansion |
Average utilization | Low current utilization | Consistently high utilization | Overprovisioned cloud instances offset consolidation gains |
Power mix | Carbon-intensive local grid; provider procures renewable power at scale | On-site renewables or a clean regional grid | Opaque renewable claims without clear methodology |
Facility efficiency (PUE) | On-premise facilities with high PUE | Purpose-built facility with low PUE | Deferred efficiency investment erodes the on-premise advantage |
Hardware lifecycle | Aging equipment with poor energy efficiency | Long, well-managed lifecycles with disciplined refresh | Weak lifecycle management increases embodied emissions |
Reporting quality | Provider offers detailed, methodology-disclosed carbon data | Internal metering with direct Scope 2 and Scope 3 tracking | Black-box cloud calculators or incomplete internal Scope 3 coverage |
The lower-carbon option depends on workload shape, power mix, hardware life, and data quality. Compare like for like, then test that answer against your own utilization, cooling efficiency, and refresh cycle.
FAQs
How do I compare cloud and on-premise fairly?
Compare them with site-specific data under the GHG Protocol, not broad assumptions. Treat cloud as a material Scope 3 Category 1 source, and use provider data where possible instead of spend-based estimates.
For on-premise, measure actual energy use and cooling load. In both cases, include the full hardware lifecycle, regional grid carbon intensity, and a clear, documented method.
When can on-premise have a lower carbon footprint?
On-premise infrastructure can produce a lower carbon footprint when a company runs in a region with a much cleaner power grid than the cloud regions it can access.
That edge can grow when the organization has direct control over server efficiency, cooling systems, and the use of renewable power. In that case, local decisions matter. A well-run data center on a cleaner grid may emit less than cloud workloads placed in regions that rely more heavily on carbon-intensive electricity.
Cloud cost and performance tuning tools help, of course, but they don't always erase the impact of where the workload actually runs. If the available cloud region uses dirtier power, those gains may only go so far.
What data do I need to estimate ICT carbon accurately?
To estimate ICT carbon with care, move past spend-based math and lean on activity-based data plus supplier-specific inputs. That shift gives you a much clearer picture of what’s driving emissions instead of relying on broad dollar-based averages.
Screen all 15 GHG Protocol Scope 3 categories, then focus first on the sources that make up more than 5% of your footprint. That helps teams spend time where it matters most.
For cloud services, ask providers like AWS or Azure for customer-specific footprint data. For hardware and facilities, track procurement volumes and primary utility data, including kWh. Use recognized emission factor databases, and document your methods, assumptions, and data quality.
A simple way to think about it:
Cloud: Get customer-level emissions data from providers when available.
Hardware and facilities: Track what you buy and what you use, especially electricity consumption in kWh.
Calculation approach: Use recognized emission factor databases and keep a clear record of how numbers were derived.
That paper trail matters. If someone asks how a figure was calculated six months later, you don’t want to be piecing it together from old spreadsheets and half-remembered notes.
Related Blog Posts
Latest Articles
©2026
Narrative Change and Power Building: The Missing Half of Advocacy
Narrative change is the process of disrupting dominant narratives that normalize inequity and advancing new narratives from historically marginalized communities.
Funding Resilience Without Federal Grants
BRIC is unreliable and FEMA is shrinking. Here's how cities fund climate resilience with dedicated revenue, blended finance, and a coordinating authority.
The ESG Blind Spot: How AI Is Finding Risks in Companies Nobody Else Is Watching
Norway's sovereign wealth fund uses AI to screen 7,200 portfolio companies for forced labor and corruption within 24 hours. The real story is the emerging-market coverage gap that traditional ESG data vendors miss — and what it means for any company with a global supply chain.
FAQ
What does it really mean to “redefine profit”?
What makes Council Fire different?
Who does Council Fire work with?
What does working with Council Fire actually look like?
How does Council Fire help organizations turn big goals into action?
How does Council Fire define and measure success?
How does technology fit into Council Fire’s work?