Apr 19, 2026
How to Use Data to Inform Climate and Housing Policy for Universities & Research Institutions
Sustainability Strategy
In This Article
How universities can use climate, energy, and housing data to cut emissions, improve resilience, and guide equitable policy.
How to Use Data to Inform Climate and Housing Policy for Universities & Research Institutions
Universities face mounting challenges in addressing climate change and housing sustainability. Data-driven decision-making offers a clear path forward, enabling institutions to reduce emissions, optimize housing policies, and save costs. Here's how:
Pinpoint Emission Sources: A university identified its central heating plant as responsible for 42% of emissions, leading to a ground-source heat pump project that cut emissions by 35% and saved $2.8M annually.
Leverage Predictive Models: Scenario modeling helps universities accelerate carbon neutrality goals and prioritize impactful projects while aligning with financial incentives.
Integrate Housing and Climate Data: Combining occupancy, energy use, and climate risks improves housing resilience and operational efficiency.
Engage Stakeholders: Inclusive feedback ensures policies align with community needs, addressing equity concerns and fostering trust.
Track Performance: Metrics like emissions reductions, energy use intensity, and equity outcomes ensure measurable progress.
Data analytics transforms uncertainty into actionable strategies, delivering environmental improvements and financial benefits while addressing housing challenges.
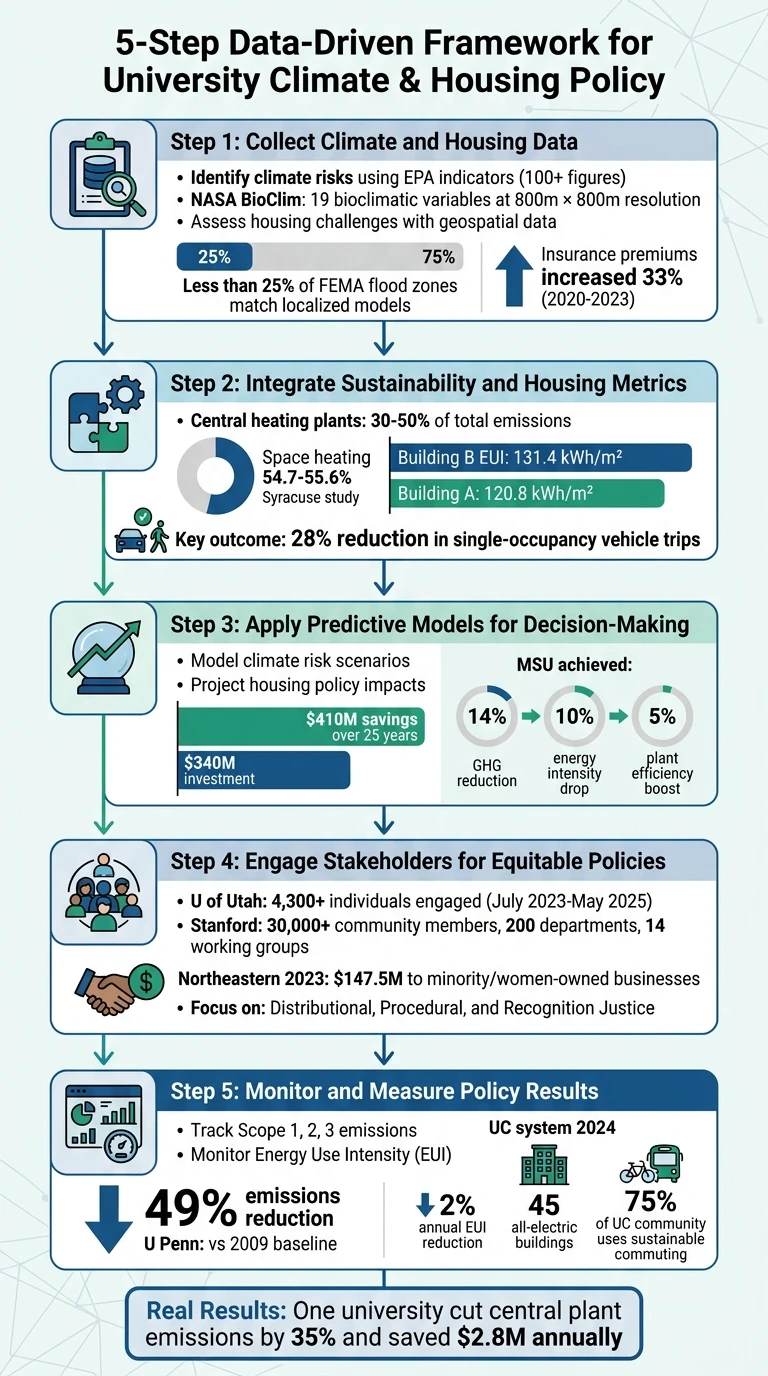
5-Step Framework for Data-Driven Climate and Housing Policy in Universities
Data as the Basis for Policy, Innovation and Education
Step 1: Collect Climate and Housing Data
Effective policy development starts with gathering detailed, multi-source information about campus climate risks and housing vulnerabilities. Tools like the EPA's climate change indicators, which track changes through over 100 figures such as graphs and maps, provide a strong foundation for institutions to begin their assessments [6].
Identify Climate Risks
Reliable climate data is essential for creating resilient campus plans. Universities should focus on collecting information about temperature trends, precipitation patterns, and extreme weather events, using datasets that range from global to local scales [6]. For example, NASA's BioClim dataset offers 19 bioclimatic variables with a fine-scale resolution of approximately 800 m × 800 m, delivering valuable ecological and climate insights [4]. Similarly, high-resolution projections like NEX-DCP30 can help institutions evaluate local topography and climate gradients specific to their campuses [4].
In August 2023, Fannie Mae's climate impact adviser, Mary Lennon, and her analytics team used GIS technology to assess risks across a portfolio of over 17 million single-family loans. By combining national natural hazard datasets with precise property-level intelligence, they identified risks for homes located outside FEMA's designated 100-year flood zones [5]. Lennon highlighted the importance of granular data:
"Knowing exactly where a property is and understanding the surrounding environment is absolutely required for understanding climate risk, especially when you think of something like floods" [5].
Though FEMA maps are a helpful resource, they can sometimes be outdated. A comparative study revealed that less than 25% of areas identified as at risk by FEMA matched localized flood models provided by First Street, a national flood risk data provider [1]. To address these gaps, universities should incorporate predictive climate intelligence and updated meteorological models into their assessments. Resources like the Data.gov Archive, maintained by the Harvard Law School Library Innovation Lab, offer access to mirrored federal data for long-term planning [6].
With a clear understanding of climate risks, institutions can then shift their focus to evaluating campus housing vulnerabilities.
Assess Housing Challenges
Just as climate data is critical, housing data provides essential insights for enhancing campus resilience. Universities should gather geospatial housing data that links property locations to environmental factors like flood zones, while also considering socioeconomic indicators [5]. Information on building standards, insurance policies, and property values can further clarify the resilience of campus housing stock [5].
From 2020 to 2023, nominal insurance premiums increased by 33% (a 13% rise in real terms) [7]. Monitoring these financial trends alongside occupancy rates, student housing demand, and infrastructure weaknesses helps create a comprehensive picture of campus challenges. Tim Judge, Senior Vice President and Chief Climate Officer at Fannie Mae, emphasizes the human element:
"I don't talk about the property - I talk about the people who are living in the property" [5].
Incorporating Social Vulnerability Indexes (SVI) and Environmental Justice (EJ) metrics into data collection is equally important. These tools help identify how climate risks disproportionately affect certain student or faculty populations. Judge elaborates:
"In some vulnerable communities that have had historically less investment in infrastructure and the like, the impacts of climate are far greater" [5].
Taking this equity-centered approach ensures that housing policies address the diverse needs of the campus community. By collecting this extensive data, universities are better positioned to integrate sustainability metrics and predictive models in the next stages of planning.
Step 2: Integrate Sustainability and Housing Metrics
Combining sustainability indicators with housing metrics transforms raw data into practical insights for policy development. This approach uncovers the connections between energy use, emissions, and occupancy trends, enabling universities to craft strategies that balance environmental goals with student housing needs.
Use Energy and Emission Data
Breaking down emissions by specific buildings and systems helps pinpoint the most impactful areas. For instance, central heating plants can contribute 30% to 50% of a university's total emissions [2], making them a prime target for efficiency improvements. By analyzing the operations of these plants in detail, institutions can identify opportunities for significant reductions.
Syracuse University conducted a year-long study of selected apartment buildings to establish energy baselines. Using data from 490 files across 14 apartments, researchers tracked energy consumption, indoor environmental quality, and occupancy through motion and window sensors. The findings revealed that space heating accounted for 54.7% to 55.6% of total energy use. Additionally, Building B had a higher Energy Use Intensity (EUI) of 131.4 kWh/m², compared to Building A's 120.8 kWh/m² [8]. This detailed insight allowed the university to prioritize retrofits for the most energy-intensive buildings.
Tools like ENERGY STAR Portfolio Manager can help rank campus buildings and identify underperformers for retrofits [2]. For example, in February 2026, a large public research university with 35,000 students advanced its carbon neutrality goal from 2040 to 2035. By integrating building-level energy benchmarking with financial modeling, the institution launched 30 deep retrofits, achieving an average 40% energy reduction per building. A centerpiece of this effort was replacing its central plant with an 800-well ground-source heat pump system serving 22 buildings. This transition cut central plant emissions by 35% and delivered $2.8 million in annual operating cost savings [2].
Strategically sequencing efficiency measures can generate immediate savings to fund larger initiatives. Council Fire highlights:
"Starting with efficiency measures that generate immediate savings creates a revenue stream that funds larger capital projects" [2].
Simple measures like LED lighting upgrades and envelope improvements deliver quick returns, which can then finance more expensive projects such as central plant electrification. This type of energy analysis also supports a deeper understanding of occupancy and commuter patterns.
Analyze Commuter and Occupancy Patterns
Examining how students and faculty commute to campus - and where they live - can align housing policies with sustainability objectives. By combining housing occupancy data with commuting trends, universities can implement targeted programs like subsidized transit passes, e-bike lending, or remote work options to cut Scope 3 emissions [2]. One research university achieved a 28% reduction in single-occupancy vehicle trips through a mix of subsidized transit and e-bike lending programs [2].
Real-time occupancy data collected from motion detectors, CO2 sensors, and door/window contact sensors provides insights into how residential spaces are used [8]. This data allows for more efficient HVAC system operations, adjusting heating and cooling based on actual occupancy rather than fixed schedules. Michigan State University used an Integrated Energy Planning Model between 2012 and 2015 to commit to a 30% reduction in greenhouse gas emissions. By cross-referencing high-energy facilities with building systems, the university targeted over 100 buildings for retrocommissioning and introduced a web-based Energy Dashboard featuring real-time smart meter data for all 545 campus buildings [9].
Monitoring indoor environmental quality - such as temperature, humidity, CO2 levels, and particulate matter - alongside energy data ensures that efficiency upgrades maintain student health and comfort [8]. For instance, Syracuse University's study found that indoor humidity levels often dropped below the comfort range during winter, even though temperatures were well-regulated. This highlighted the importance of balancing energy efficiency with livability [8]. Combining these metrics paves the way for predictive modeling and more precise policy decisions.
Step 3: Apply Predictive Models for Decision-Making
Predictive models, built on integrated sustainability and housing data, are powerful tools for forecasting long-term impacts and shaping strategic policies. These models allow universities to evaluate various scenarios side-by-side, assessing how different approaches influence emissions, costs, and infrastructure over time. By bridging data with actionable insights, they help institutions move from analysis to informed decision-making.
Project Climate Risk Scenarios
Predictive tools provide universities with a clear view of potential pathways toward carbon neutrality. For instance, one large public research university used scenario modeling to explore four distinct strategies. The analysis revealed that advancing its carbon neutrality goal from 2040 to 2035 was not only achievable but also more cost-effective, thanks to federal incentives. This approach identified a phased strategy that would cut central plant emissions by 35% while reducing annual operating costs by $2.8 million [2].
These models also highlight critical moments when campus energy demand risks exceeding supply capacity [9]. Between 2012 and 2015, Michigan State University collaborated with Confluenc to develop the Integrated Energy Planning Model (IEPM). This tool analyzed data from 545 buildings using real-time smart meters for electricity and steam. The insights enabled MSU to prioritize retrocommissioning for over 100 facilities, achieving a 14% reduction in greenhouse gas emissions, a 10% drop in building energy intensity (kBtus/sf), and a 5% boost in power plant efficiency [9].
Financial forecasting adds another layer of precision, helping institutions measure the impact of investments on tuition, debt capacity, and net present value. One research university modeled a $340 million campus energy infrastructure upgrade, projecting $410 million in savings and avoided maintenance costs over 25 years. Federal incentives turned previously unfeasible projects into financially sound opportunities [2]. This same predictive approach can refine housing policies, ensuring every decision is backed by robust data.
Model Housing Policy Scenarios
Housing policy models empower universities to test strategies before committing resources. For example, models can compare the benefits of expanding on-campus housing versus forming off-campus partnerships or analyze how different occupancy patterns affect energy demand. Michigan State University utilized its IEPM to create a "build-your-own-energy-supply" web tool. This interactive platform allowed students and faculty to visualize how various policy decisions would impact key metrics over time, fostering transparency and community support. The tool directly informed MSU's Energy Transition Plan, which aims for a 65% emissions reduction by 2030 [9].
"The IEPM validates the direction the university is heading to achieve the desired outcomes, while at the same time allowing for new technologies, or business opportunities to be evaluated within the context of the key metrics for the campus energy supply, reliability, capacity, economics and the environment."
Michigan State University [9]
Effective housing models incorporate detailed emissions and energy data, broken down by building, system, and fuel type, alongside demographic and socio-economic factors [2][10]. This level of detail helps universities pinpoint high-energy-use facilities and prioritize retrofits. For instance, one university's modeling showed that targeting the 30 least efficient buildings for deep retrofits, coupled with a transition to heat pumps, could reduce emissions by 85% without relying on offsets [2]. By sequencing investments wisely - starting with quick, cost-saving efficiency measures - universities can generate revenue to fund larger projects, such as full housing electrification [2].
Step 4: Engage Stakeholders for Equitable Policies
Once universities establish strong data analytics for climate and housing, the next step is to actively involve the community to ensure policies are fair and inclusive. Policies rooted in data must also reflect the needs and experiences of the people they impact. This requires moving away from a top-down decision-making approach and embracing inclusive policy design. By involving students, faculty, staff, and local communities in shaping climate and housing strategies, universities can build trust, uncover overlooked issues, and create solutions that address actual challenges.
Equity should be the foundation of this process, guided by three key principles:
Distributional justice: Ensures that benefits, costs, and risks are shared fairly, avoiding undue burdens on low-income groups.
Procedural justice: Promotes inclusive planning, giving vulnerable populations meaningful opportunities to participate in decisions that affect them.
Recognition justice: Acknowledges the perspectives of marginalized groups while addressing systemic inequities, such as the lingering effects of historical redlining on housing access [11].
Collect Feedback from Students and Faculty
Engaging the campus community requires reaching people through various channels. For example, between July 2023 and May 2025, the University of Utah connected with over 4,300 individuals through listening sessions, pop-up events, classroom presentations, and roundtable discussions. This approach ensured that groups often left out of traditional surveys had a voice in the development of the university's Climate Action Plan [11].
Stanford University’s 2026 Climate Action Plan provides another example of how formal structures can amplify stakeholder input. The university created 14 working groups focused on topics like food systems and land use and established a Climate Action Advisory Committee, which included students nominated by their peers. This system funneled feedback from over 30,000 community members across 200 departments directly into decision-making processes [12].
Transparency also plays a significant role in building trust. Interactive tools, such as open dashboards, make modeling data accessible, helping students and faculty understand the reasoning behind decisions and track progress. Clark University in Worcester, Massachusetts, partnered with the Together for Kids Coalition from 2023 to 2024 to address child care barriers. Graduate students gathered data and conducted interviews with 10 families, then presented the findings through visual "data walks." This allowed participants to refine the conclusions and ensure the results reflected their lived experiences [13].
Such efforts set the stage for integrating measurable equity outcomes into policy frameworks.
Include Equity Metrics
Socioeconomic and demographic data must inform policy development. Metrics such as race, income, household size, and transportation access can pinpoint which groups are most vulnerable to climate and housing challenges [14]. Northeastern University’s Climate Justice Action Plan, developed with environmental justice leaders in Roxbury, tracks specific equity outcomes. In 2023, the university reported $147.5 million spent with underrepresented, minority-, and women-owned businesses and $32.3 million allocated in institutional student aid for Boston residents [15].
Metrics also reveal whether universities are contributing to local economic growth or extracting resources from surrounding communities. Northeastern achieved an 83% sustainable commute rate among faculty and staff in 2023, easing transportation issues for those unable to live near campus [15]. Similarly, Duke University's Homebuyer Club provided over 3,000 hours of homebuyer education to low-wage employees between 2013 and 2021, helping 67 credit-challenged workers purchase homes [16].
However, equity efforts can falter without clear decision-making processes. A survey of the University of Utah’s 17-member planning team showed high scores for recognition justice but wide variation in procedural justice ratings - from 2 to 9 on a 10-point scale. This inconsistency highlights how unclear processes can undermine equity goals. Establishing transparent frameworks that translate community input into concrete actions is essential to avoid stakeholder fatigue and maintain credibility [11].
Step 5: Monitor and Measure Policy Results
Effective monitoring ensures that policies lead to measurable outcomes. By consistently tracking results, institutions can identify successes, address shortcomings, and refine their strategies. This step builds on earlier efforts in data collection and predictive modeling, ensuring that decisions are backed by actionable insights.
Define Key Performance Indicators (KPIs)
To evaluate policy success, institutions must focus on specific metrics across climate, housing, and transportation. For climate, tracking greenhouse gas emissions is essential. This includes:
Scope 1: Direct emissions from campus operations.
Scope 2: Indirect emissions from purchased electricity and steam.
Scope 3: Emissions from commuting, business travel, and waste [18].
Another critical measure is Energy Use Intensity (EUI), which divides total energy consumption by square footage to account for campus growth [18].
In housing, metrics like space utilization and energy consumption reveal whether existing buildings are being used efficiently, potentially avoiding unnecessary new construction. Occupancy rates paired with energy data can uncover opportunities to reduce carbon footprints [19]. For transportation, KPIs should include:
Single-occupancy vehicle commute rates.
Availability of electric vehicle charging stations.
Sustainable fleet acquisitions [18].
For example, in 2024–25, 75% of University of California students and employees used sustainable commuting methods, such as walking, biking, public transit, or telecommuting [18].
Social equity metrics are equally important. Universities should measure progress toward Diversity, Equity, Inclusion, and Justice (DEIJ) goals. This includes tracking environmental justice efforts, access to healthy food, and regional procurement spending. The University of Pennsylvania, for instance, reported $702 million in regional procurement spending in fiscal year 2025, highlighting the impact of purchasing power on local economies [17][18].
Compare Pre- and Post-Policy Data
A baseline year is crucial for assessing progress. For example, the University of Pennsylvania uses fiscal year 2009 as its benchmark. By 2025, the university achieved a 49% reduction in net emissions on its main campus compared to FY09. Additionally, in FY25 alone, Penn recorded a 4.5% year-over-year decrease, amounting to 9,215 metric tons of carbon dioxide equivalent [17].
"Last year, Penn established a five-year roadmap to achieve carbon neutrality by 2042 and foster a strong culture of sustainability. One year into the plan, we've expanded reporting across more University properties, enhancing transparency, strengthening commitment, and increasing impact."
Anne Papageorge, Senior Vice President of Facilities & Real Estate Services, University of Pennsylvania [17]
Detailed data collection at the building level can highlight areas for improvement. The University of California system exemplifies this approach. In 2024, the UC system achieved a nearly 2% annual reduction in Energy Use Intensity, even as campus activity increased [18]. The system also grew its portfolio of all-electric buildings to 45 facilities, covering over 4.5 million square feet. Furthermore, 51% of new fleet vehicles acquired in 2024–25 were electric or hybrid [18]. These achievements demonstrate that growth and decarbonization can coexist when institutions track and act on the right metrics.
Case Study: Data-Driven Policies in Practice
Examples from higher education highlight how data-driven approaches make sustainability goals a reality. These cases show that detailed analytics can turn ambitious plans into measurable outcomes.
University Housing Resilience Projects
The University of Illinois Urbana-Champaign showcased innovation with its 124,000‑ft² instructional facility completed in 2021. This building achieved both LEED Zero Energy and LEED BD+C NC Platinum certifications. Leveraging energy modeling from DataBased+, the project team designed a geothermal exchange system featuring 40 wells drilled 450 feet deep. A $375,000 grant from the Student Sustainability Committee helped fund the initiative, which cut the building's energy use by 65% compared to conventional systems [20]. The facility now doubles as a teaching tool, as Doug Reddington, Associate Director of Real Estate Services at UIUC, explained:
"Professors can actually look at the building in a class and point to different components of the building in their teaching methodology" [20].
Meanwhile, UC Davis focused on upgrading existing infrastructure through its SWARM (Small Workplace Automation and Remote Monitoring) project. Between 2015 and August 2024, the Energy Engineering team, led by Supervisor Nico Fauchier-Magnan, installed internet-connected thermostats and meters across 70 buildings. This centralized system optimized energy use, even as the campus added 500,000 ft² of space. The results were striking: annual energy use dropped by 500,000 MMBTUs, saving $11 million in energy costs [21]. Fauchier-Magnan noted:
"We've been cost-positive on an annual basis for a few years - saving $3 million last year and more than $2 million the year before" [21].
These efforts demonstrate how targeted, data-driven projects can integrate seamlessly into larger campus strategies.
Sustainability Metrics in Campus Planning
Building on these successes, universities are leveraging advanced planning models to amplify the impact of data. Michigan State University (MSU) exemplifies this with its Integrated Energy Planning Model (IEPM), developed in collaboration with Confluenc after adopting its Energy Transition Plan in April 2012. This tool enabled MSU to simulate energy scenarios and prioritize retrocommissioning for over 100 campus facilities. By identifying high-energy-use buildings, the university achieved a 5% efficiency boost in its power plant [9].
Another large public research university, serving 35,000 students, used granular emissions data and financial modeling to accelerate its carbon neutrality goal from 2040 to 2035. Federal incentives revealed that acting sooner was more cost-effective. The plan included a mix of strategies, such as a 15 MW solar array and a 50 MW off-site wind power purchase agreement priced at $32/MWh - lower than the university’s blended grid rate [2].
These case studies make it clear: data analytics are not just tools for short-term improvements but are essential for shaping long-term sustainability strategies in higher education.
Partner with Council Fire for Data-Driven Policy Implementation

Turning data into meaningful action requires more than just analysis - it demands expertise, strategy, and a clear focus on impactful outcomes. With over 15 years of experience, Council Fire has helped universities and other institutions transform their sustainability goals into tangible results. Their approach zeroes in on high-impact areas, such as central heating plants, which are responsible for 30–50% of total university emissions [2]. Instead of diluting efforts across smaller projects, they prioritize actions that deliver measurable reductions.
By leveraging advanced data analytics, Council Fire demonstrates how targeted strategies can translate ambition into achievement. For instance, in February 2026, they partnered with a research university serving 35,000 students to accelerate its carbon neutrality goal from 2040 to 2035. This collaboration utilized detailed emissions inventories, scenario modeling, and strategic sequencing to focus on cost-effective efficiency measures, achieving both financial and environmental benefits [2].
Beyond technical expertise, Council Fire excels in securing funding to support these initiatives. In one notable example, they helped a mid-Atlantic coastal city obtain $14.7 million in federal and state grants within just 18 months. This success highlights their ability to align technical planning with funding opportunities, fostering confidence and encouraging institutional adoption [23].
Council Fire also transforms complex data into actionable policies by crafting compelling narratives that resonate with stakeholders. Dr. William Dennison, Vice President at the University of Maryland Center for Environmental Science, praised their collaborative approach:
"Council Fire has long been a key collaborator and partner... Their comprehensive economic, environmental, and social impact expertise combined with their collaboration and storytelling capabilities helps ensure our science and research can emerge from the labs and have real world impact" [22].
This ability to turn technical insights into persuasive storytelling builds trust and motivates action, bridging the gap between data and policy.
Recognized with multiple Best for the World B Corporation honors, Council Fire has established itself as a leader in driving measurable progress. Whether it’s implementing building retrofits, modeling decarbonization strategies, or creating circular economy frameworks, their expertise helps transform data into impactful climate and housing policies that deliver lasting results.
Conclusion
Turning data into actionable strategies for climate and housing policy requires more than just crunching numbers - it’s about creating a clear path forward. The five-step framework discussed here offers universities and research institutions a practical guide: begin with precise data collection to pinpoint major emission sources, weave sustainability metrics into campus systems, use predictive models to explore potential scenarios, engage stakeholders to ensure fairness, and maintain ongoing monitoring to adapt to evolving conditions.
This structured approach can deliver tangible outcomes. For instance, in February 2026, a major public research university conducted a comprehensive emissions inventory and discovered that a significant portion of its emissions stemmed from its central heating plant [2]. By modeling various scenarios with detailed cost schedules and emissions projections, the university set an accelerated carbon neutrality target and identified considerable cost savings [2].
However, success demands more than just technical expertise. Consolidating fragmented data systems into a unified, reliable source provides the real-time insight necessary for informed decision-making. Transparent stakeholder engagement and strategic prioritization - such as starting with efficiency measures that yield immediate savings to fund larger initiatives - are crucial for maintaining momentum [2][3].
FAQs
What campus data should we collect first?
To understand greenhouse gas emissions effectively, begin by gathering data on their primary sources, especially those tied to energy usage and associated activities. Focus on areas such as electricity consumption, heating and cooling systems, fleet vehicles, refrigerants, commuting patterns, and air travel. It's also essential to collect information on the age and capacity of energy infrastructure, including boilers and electrical systems. These insights are critical for analyzing the campus's carbon footprint and shaping policies that can lead to meaningful reductions in emissions.
How do we merge housing and climate datasets?
To integrate housing and climate datasets effectively, start by aligning them through shared geographic markers such as ZIP codes or census tracts. This approach allows you to merge housing details - like location and energy consumption - with climate-related data, including emissions levels and temperature trends. By applying predictive modeling alongside sustainability-focused metrics, you can uncover connections between housing policies and their environmental impacts. Standardizing the data is essential to ensure consistency, and involving stakeholders in the process helps produce actionable insights that can guide integrated policy development.
Which KPIs prove results and equity?
Key performance indicators (KPIs) that highlight results and fairness emphasize climate justice and equity-focused planning. Examples include monitoring reductions in emissions, incorporating acknowledgments of Indigenous lands, fostering stakeholder involvement, and guaranteeing that underserved communities have equal access to benefits. These metrics are essential for assessing both environmental progress and equitable outcomes.
Related Blog Posts
How to Build a Climate Resilience Plan for Universities & Research Institutions
How to Integrate Climate Risk into Infrastructure Planning for Universities & Research Institutions
How to Use Data to Inform Climate and Housing Policy for Municipalities & Government Agencies
How to Use Data to Inform Climate and Housing Policy for Corporations
Latest Articles
©2026

Narrative Change and Power Building: The Missing Half of Advocacy
Narrative change is the process of disrupting dominant narratives that normalize inequity and advancing new narratives from historically marginalized communities.

Funding Resilience Without Federal Grants
BRIC is unreliable and FEMA is shrinking. Here's how cities fund climate resilience with dedicated revenue, blended finance, and a coordinating authority.

The ESG Blind Spot: How AI Is Finding Risks in Companies Nobody Else Is Watching
Norway's sovereign wealth fund uses AI to screen 7,200 portfolio companies for forced labor and corruption within 24 hours. The real story is the emerging-market coverage gap that traditional ESG data vendors miss — and what it means for any company with a global supply chain.
Narrative Change and Power Building: The Missing Half of Advocacy
Narrative change is the process of disrupting dominant narratives that normalize inequity and advancing new narratives from historically marginalized communities.
Funding Resilience Without Federal Grants
BRIC is unreliable and FEMA is shrinking. Here's how cities fund climate resilience with dedicated revenue, blended finance, and a coordinating authority.
The ESG Blind Spot: How AI Is Finding Risks in Companies Nobody Else Is Watching
Norway's sovereign wealth fund uses AI to screen 7,200 portfolio companies for forced labor and corruption within 24 hours. The real story is the emerging-market coverage gap that traditional ESG data vendors miss — and what it means for any company with a global supply chain.
FAQ
01
What does it really mean to “redefine profit”?
02
What makes Council Fire different?
03
Who does Council Fire work with?
04
What does working with Council Fire actually look like?
05
How does Council Fire help organizations turn big goals into action?
06
How does Council Fire define and measure success?
07
How does technology fit into Council Fire’s work?
Apr 19, 2026
How to Use Data to Inform Climate and Housing Policy for Universities & Research Institutions
Sustainability Strategy
In This Article
How universities can use climate, energy, and housing data to cut emissions, improve resilience, and guide equitable policy.
How to Use Data to Inform Climate and Housing Policy for Universities & Research Institutions
Universities face mounting challenges in addressing climate change and housing sustainability. Data-driven decision-making offers a clear path forward, enabling institutions to reduce emissions, optimize housing policies, and save costs. Here's how:
Pinpoint Emission Sources: A university identified its central heating plant as responsible for 42% of emissions, leading to a ground-source heat pump project that cut emissions by 35% and saved $2.8M annually.
Leverage Predictive Models: Scenario modeling helps universities accelerate carbon neutrality goals and prioritize impactful projects while aligning with financial incentives.
Integrate Housing and Climate Data: Combining occupancy, energy use, and climate risks improves housing resilience and operational efficiency.
Engage Stakeholders: Inclusive feedback ensures policies align with community needs, addressing equity concerns and fostering trust.
Track Performance: Metrics like emissions reductions, energy use intensity, and equity outcomes ensure measurable progress.
Data analytics transforms uncertainty into actionable strategies, delivering environmental improvements and financial benefits while addressing housing challenges.
5-Step Framework for Data-Driven Climate and Housing Policy in Universities
Data as the Basis for Policy, Innovation and Education
Step 1: Collect Climate and Housing Data
Effective policy development starts with gathering detailed, multi-source information about campus climate risks and housing vulnerabilities. Tools like the EPA's climate change indicators, which track changes through over 100 figures such as graphs and maps, provide a strong foundation for institutions to begin their assessments [6].
Identify Climate Risks
Reliable climate data is essential for creating resilient campus plans. Universities should focus on collecting information about temperature trends, precipitation patterns, and extreme weather events, using datasets that range from global to local scales [6]. For example, NASA's BioClim dataset offers 19 bioclimatic variables with a fine-scale resolution of approximately 800 m × 800 m, delivering valuable ecological and climate insights [4]. Similarly, high-resolution projections like NEX-DCP30 can help institutions evaluate local topography and climate gradients specific to their campuses [4].
In August 2023, Fannie Mae's climate impact adviser, Mary Lennon, and her analytics team used GIS technology to assess risks across a portfolio of over 17 million single-family loans. By combining national natural hazard datasets with precise property-level intelligence, they identified risks for homes located outside FEMA's designated 100-year flood zones [5]. Lennon highlighted the importance of granular data:
"Knowing exactly where a property is and understanding the surrounding environment is absolutely required for understanding climate risk, especially when you think of something like floods" [5].
Though FEMA maps are a helpful resource, they can sometimes be outdated. A comparative study revealed that less than 25% of areas identified as at risk by FEMA matched localized flood models provided by First Street, a national flood risk data provider [1]. To address these gaps, universities should incorporate predictive climate intelligence and updated meteorological models into their assessments. Resources like the Data.gov Archive, maintained by the Harvard Law School Library Innovation Lab, offer access to mirrored federal data for long-term planning [6].
With a clear understanding of climate risks, institutions can then shift their focus to evaluating campus housing vulnerabilities.
Assess Housing Challenges
Just as climate data is critical, housing data provides essential insights for enhancing campus resilience. Universities should gather geospatial housing data that links property locations to environmental factors like flood zones, while also considering socioeconomic indicators [5]. Information on building standards, insurance policies, and property values can further clarify the resilience of campus housing stock [5].
From 2020 to 2023, nominal insurance premiums increased by 33% (a 13% rise in real terms) [7]. Monitoring these financial trends alongside occupancy rates, student housing demand, and infrastructure weaknesses helps create a comprehensive picture of campus challenges. Tim Judge, Senior Vice President and Chief Climate Officer at Fannie Mae, emphasizes the human element:
"I don't talk about the property - I talk about the people who are living in the property" [5].
Incorporating Social Vulnerability Indexes (SVI) and Environmental Justice (EJ) metrics into data collection is equally important. These tools help identify how climate risks disproportionately affect certain student or faculty populations. Judge elaborates:
"In some vulnerable communities that have had historically less investment in infrastructure and the like, the impacts of climate are far greater" [5].
Taking this equity-centered approach ensures that housing policies address the diverse needs of the campus community. By collecting this extensive data, universities are better positioned to integrate sustainability metrics and predictive models in the next stages of planning.
Step 2: Integrate Sustainability and Housing Metrics
Combining sustainability indicators with housing metrics transforms raw data into practical insights for policy development. This approach uncovers the connections between energy use, emissions, and occupancy trends, enabling universities to craft strategies that balance environmental goals with student housing needs.
Use Energy and Emission Data
Breaking down emissions by specific buildings and systems helps pinpoint the most impactful areas. For instance, central heating plants can contribute 30% to 50% of a university's total emissions [2], making them a prime target for efficiency improvements. By analyzing the operations of these plants in detail, institutions can identify opportunities for significant reductions.
Syracuse University conducted a year-long study of selected apartment buildings to establish energy baselines. Using data from 490 files across 14 apartments, researchers tracked energy consumption, indoor environmental quality, and occupancy through motion and window sensors. The findings revealed that space heating accounted for 54.7% to 55.6% of total energy use. Additionally, Building B had a higher Energy Use Intensity (EUI) of 131.4 kWh/m², compared to Building A's 120.8 kWh/m² [8]. This detailed insight allowed the university to prioritize retrofits for the most energy-intensive buildings.
Tools like ENERGY STAR Portfolio Manager can help rank campus buildings and identify underperformers for retrofits [2]. For example, in February 2026, a large public research university with 35,000 students advanced its carbon neutrality goal from 2040 to 2035. By integrating building-level energy benchmarking with financial modeling, the institution launched 30 deep retrofits, achieving an average 40% energy reduction per building. A centerpiece of this effort was replacing its central plant with an 800-well ground-source heat pump system serving 22 buildings. This transition cut central plant emissions by 35% and delivered $2.8 million in annual operating cost savings [2].
Strategically sequencing efficiency measures can generate immediate savings to fund larger initiatives. Council Fire highlights:
"Starting with efficiency measures that generate immediate savings creates a revenue stream that funds larger capital projects" [2].
Simple measures like LED lighting upgrades and envelope improvements deliver quick returns, which can then finance more expensive projects such as central plant electrification. This type of energy analysis also supports a deeper understanding of occupancy and commuter patterns.
Analyze Commuter and Occupancy Patterns
Examining how students and faculty commute to campus - and where they live - can align housing policies with sustainability objectives. By combining housing occupancy data with commuting trends, universities can implement targeted programs like subsidized transit passes, e-bike lending, or remote work options to cut Scope 3 emissions [2]. One research university achieved a 28% reduction in single-occupancy vehicle trips through a mix of subsidized transit and e-bike lending programs [2].
Real-time occupancy data collected from motion detectors, CO2 sensors, and door/window contact sensors provides insights into how residential spaces are used [8]. This data allows for more efficient HVAC system operations, adjusting heating and cooling based on actual occupancy rather than fixed schedules. Michigan State University used an Integrated Energy Planning Model between 2012 and 2015 to commit to a 30% reduction in greenhouse gas emissions. By cross-referencing high-energy facilities with building systems, the university targeted over 100 buildings for retrocommissioning and introduced a web-based Energy Dashboard featuring real-time smart meter data for all 545 campus buildings [9].
Monitoring indoor environmental quality - such as temperature, humidity, CO2 levels, and particulate matter - alongside energy data ensures that efficiency upgrades maintain student health and comfort [8]. For instance, Syracuse University's study found that indoor humidity levels often dropped below the comfort range during winter, even though temperatures were well-regulated. This highlighted the importance of balancing energy efficiency with livability [8]. Combining these metrics paves the way for predictive modeling and more precise policy decisions.
Step 3: Apply Predictive Models for Decision-Making
Predictive models, built on integrated sustainability and housing data, are powerful tools for forecasting long-term impacts and shaping strategic policies. These models allow universities to evaluate various scenarios side-by-side, assessing how different approaches influence emissions, costs, and infrastructure over time. By bridging data with actionable insights, they help institutions move from analysis to informed decision-making.
Project Climate Risk Scenarios
Predictive tools provide universities with a clear view of potential pathways toward carbon neutrality. For instance, one large public research university used scenario modeling to explore four distinct strategies. The analysis revealed that advancing its carbon neutrality goal from 2040 to 2035 was not only achievable but also more cost-effective, thanks to federal incentives. This approach identified a phased strategy that would cut central plant emissions by 35% while reducing annual operating costs by $2.8 million [2].
These models also highlight critical moments when campus energy demand risks exceeding supply capacity [9]. Between 2012 and 2015, Michigan State University collaborated with Confluenc to develop the Integrated Energy Planning Model (IEPM). This tool analyzed data from 545 buildings using real-time smart meters for electricity and steam. The insights enabled MSU to prioritize retrocommissioning for over 100 facilities, achieving a 14% reduction in greenhouse gas emissions, a 10% drop in building energy intensity (kBtus/sf), and a 5% boost in power plant efficiency [9].
Financial forecasting adds another layer of precision, helping institutions measure the impact of investments on tuition, debt capacity, and net present value. One research university modeled a $340 million campus energy infrastructure upgrade, projecting $410 million in savings and avoided maintenance costs over 25 years. Federal incentives turned previously unfeasible projects into financially sound opportunities [2]. This same predictive approach can refine housing policies, ensuring every decision is backed by robust data.
Model Housing Policy Scenarios
Housing policy models empower universities to test strategies before committing resources. For example, models can compare the benefits of expanding on-campus housing versus forming off-campus partnerships or analyze how different occupancy patterns affect energy demand. Michigan State University utilized its IEPM to create a "build-your-own-energy-supply" web tool. This interactive platform allowed students and faculty to visualize how various policy decisions would impact key metrics over time, fostering transparency and community support. The tool directly informed MSU's Energy Transition Plan, which aims for a 65% emissions reduction by 2030 [9].
"The IEPM validates the direction the university is heading to achieve the desired outcomes, while at the same time allowing for new technologies, or business opportunities to be evaluated within the context of the key metrics for the campus energy supply, reliability, capacity, economics and the environment."
Michigan State University [9]
Effective housing models incorporate detailed emissions and energy data, broken down by building, system, and fuel type, alongside demographic and socio-economic factors [2][10]. This level of detail helps universities pinpoint high-energy-use facilities and prioritize retrofits. For instance, one university's modeling showed that targeting the 30 least efficient buildings for deep retrofits, coupled with a transition to heat pumps, could reduce emissions by 85% without relying on offsets [2]. By sequencing investments wisely - starting with quick, cost-saving efficiency measures - universities can generate revenue to fund larger projects, such as full housing electrification [2].
Step 4: Engage Stakeholders for Equitable Policies
Once universities establish strong data analytics for climate and housing, the next step is to actively involve the community to ensure policies are fair and inclusive. Policies rooted in data must also reflect the needs and experiences of the people they impact. This requires moving away from a top-down decision-making approach and embracing inclusive policy design. By involving students, faculty, staff, and local communities in shaping climate and housing strategies, universities can build trust, uncover overlooked issues, and create solutions that address actual challenges.
Equity should be the foundation of this process, guided by three key principles:
Distributional justice: Ensures that benefits, costs, and risks are shared fairly, avoiding undue burdens on low-income groups.
Procedural justice: Promotes inclusive planning, giving vulnerable populations meaningful opportunities to participate in decisions that affect them.
Recognition justice: Acknowledges the perspectives of marginalized groups while addressing systemic inequities, such as the lingering effects of historical redlining on housing access [11].
Collect Feedback from Students and Faculty
Engaging the campus community requires reaching people through various channels. For example, between July 2023 and May 2025, the University of Utah connected with over 4,300 individuals through listening sessions, pop-up events, classroom presentations, and roundtable discussions. This approach ensured that groups often left out of traditional surveys had a voice in the development of the university's Climate Action Plan [11].
Stanford University’s 2026 Climate Action Plan provides another example of how formal structures can amplify stakeholder input. The university created 14 working groups focused on topics like food systems and land use and established a Climate Action Advisory Committee, which included students nominated by their peers. This system funneled feedback from over 30,000 community members across 200 departments directly into decision-making processes [12].
Transparency also plays a significant role in building trust. Interactive tools, such as open dashboards, make modeling data accessible, helping students and faculty understand the reasoning behind decisions and track progress. Clark University in Worcester, Massachusetts, partnered with the Together for Kids Coalition from 2023 to 2024 to address child care barriers. Graduate students gathered data and conducted interviews with 10 families, then presented the findings through visual "data walks." This allowed participants to refine the conclusions and ensure the results reflected their lived experiences [13].
Such efforts set the stage for integrating measurable equity outcomes into policy frameworks.
Include Equity Metrics
Socioeconomic and demographic data must inform policy development. Metrics such as race, income, household size, and transportation access can pinpoint which groups are most vulnerable to climate and housing challenges [14]. Northeastern University’s Climate Justice Action Plan, developed with environmental justice leaders in Roxbury, tracks specific equity outcomes. In 2023, the university reported $147.5 million spent with underrepresented, minority-, and women-owned businesses and $32.3 million allocated in institutional student aid for Boston residents [15].
Metrics also reveal whether universities are contributing to local economic growth or extracting resources from surrounding communities. Northeastern achieved an 83% sustainable commute rate among faculty and staff in 2023, easing transportation issues for those unable to live near campus [15]. Similarly, Duke University's Homebuyer Club provided over 3,000 hours of homebuyer education to low-wage employees between 2013 and 2021, helping 67 credit-challenged workers purchase homes [16].
However, equity efforts can falter without clear decision-making processes. A survey of the University of Utah’s 17-member planning team showed high scores for recognition justice but wide variation in procedural justice ratings - from 2 to 9 on a 10-point scale. This inconsistency highlights how unclear processes can undermine equity goals. Establishing transparent frameworks that translate community input into concrete actions is essential to avoid stakeholder fatigue and maintain credibility [11].
Step 5: Monitor and Measure Policy Results
Effective monitoring ensures that policies lead to measurable outcomes. By consistently tracking results, institutions can identify successes, address shortcomings, and refine their strategies. This step builds on earlier efforts in data collection and predictive modeling, ensuring that decisions are backed by actionable insights.
Define Key Performance Indicators (KPIs)
To evaluate policy success, institutions must focus on specific metrics across climate, housing, and transportation. For climate, tracking greenhouse gas emissions is essential. This includes:
Scope 1: Direct emissions from campus operations.
Scope 2: Indirect emissions from purchased electricity and steam.
Scope 3: Emissions from commuting, business travel, and waste [18].
Another critical measure is Energy Use Intensity (EUI), which divides total energy consumption by square footage to account for campus growth [18].
In housing, metrics like space utilization and energy consumption reveal whether existing buildings are being used efficiently, potentially avoiding unnecessary new construction. Occupancy rates paired with energy data can uncover opportunities to reduce carbon footprints [19]. For transportation, KPIs should include:
Single-occupancy vehicle commute rates.
Availability of electric vehicle charging stations.
Sustainable fleet acquisitions [18].
For example, in 2024–25, 75% of University of California students and employees used sustainable commuting methods, such as walking, biking, public transit, or telecommuting [18].
Social equity metrics are equally important. Universities should measure progress toward Diversity, Equity, Inclusion, and Justice (DEIJ) goals. This includes tracking environmental justice efforts, access to healthy food, and regional procurement spending. The University of Pennsylvania, for instance, reported $702 million in regional procurement spending in fiscal year 2025, highlighting the impact of purchasing power on local economies [17][18].
Compare Pre- and Post-Policy Data
A baseline year is crucial for assessing progress. For example, the University of Pennsylvania uses fiscal year 2009 as its benchmark. By 2025, the university achieved a 49% reduction in net emissions on its main campus compared to FY09. Additionally, in FY25 alone, Penn recorded a 4.5% year-over-year decrease, amounting to 9,215 metric tons of carbon dioxide equivalent [17].
"Last year, Penn established a five-year roadmap to achieve carbon neutrality by 2042 and foster a strong culture of sustainability. One year into the plan, we've expanded reporting across more University properties, enhancing transparency, strengthening commitment, and increasing impact."
Anne Papageorge, Senior Vice President of Facilities & Real Estate Services, University of Pennsylvania [17]
Detailed data collection at the building level can highlight areas for improvement. The University of California system exemplifies this approach. In 2024, the UC system achieved a nearly 2% annual reduction in Energy Use Intensity, even as campus activity increased [18]. The system also grew its portfolio of all-electric buildings to 45 facilities, covering over 4.5 million square feet. Furthermore, 51% of new fleet vehicles acquired in 2024–25 were electric or hybrid [18]. These achievements demonstrate that growth and decarbonization can coexist when institutions track and act on the right metrics.
Case Study: Data-Driven Policies in Practice
Examples from higher education highlight how data-driven approaches make sustainability goals a reality. These cases show that detailed analytics can turn ambitious plans into measurable outcomes.
University Housing Resilience Projects
The University of Illinois Urbana-Champaign showcased innovation with its 124,000‑ft² instructional facility completed in 2021. This building achieved both LEED Zero Energy and LEED BD+C NC Platinum certifications. Leveraging energy modeling from DataBased+, the project team designed a geothermal exchange system featuring 40 wells drilled 450 feet deep. A $375,000 grant from the Student Sustainability Committee helped fund the initiative, which cut the building's energy use by 65% compared to conventional systems [20]. The facility now doubles as a teaching tool, as Doug Reddington, Associate Director of Real Estate Services at UIUC, explained:
"Professors can actually look at the building in a class and point to different components of the building in their teaching methodology" [20].
Meanwhile, UC Davis focused on upgrading existing infrastructure through its SWARM (Small Workplace Automation and Remote Monitoring) project. Between 2015 and August 2024, the Energy Engineering team, led by Supervisor Nico Fauchier-Magnan, installed internet-connected thermostats and meters across 70 buildings. This centralized system optimized energy use, even as the campus added 500,000 ft² of space. The results were striking: annual energy use dropped by 500,000 MMBTUs, saving $11 million in energy costs [21]. Fauchier-Magnan noted:
"We've been cost-positive on an annual basis for a few years - saving $3 million last year and more than $2 million the year before" [21].
These efforts demonstrate how targeted, data-driven projects can integrate seamlessly into larger campus strategies.
Sustainability Metrics in Campus Planning
Building on these successes, universities are leveraging advanced planning models to amplify the impact of data. Michigan State University (MSU) exemplifies this with its Integrated Energy Planning Model (IEPM), developed in collaboration with Confluenc after adopting its Energy Transition Plan in April 2012. This tool enabled MSU to simulate energy scenarios and prioritize retrocommissioning for over 100 campus facilities. By identifying high-energy-use buildings, the university achieved a 5% efficiency boost in its power plant [9].
Another large public research university, serving 35,000 students, used granular emissions data and financial modeling to accelerate its carbon neutrality goal from 2040 to 2035. Federal incentives revealed that acting sooner was more cost-effective. The plan included a mix of strategies, such as a 15 MW solar array and a 50 MW off-site wind power purchase agreement priced at $32/MWh - lower than the university’s blended grid rate [2].
These case studies make it clear: data analytics are not just tools for short-term improvements but are essential for shaping long-term sustainability strategies in higher education.
Partner with Council Fire for Data-Driven Policy Implementation
Turning data into meaningful action requires more than just analysis - it demands expertise, strategy, and a clear focus on impactful outcomes. With over 15 years of experience, Council Fire has helped universities and other institutions transform their sustainability goals into tangible results. Their approach zeroes in on high-impact areas, such as central heating plants, which are responsible for 30–50% of total university emissions [2]. Instead of diluting efforts across smaller projects, they prioritize actions that deliver measurable reductions.
By leveraging advanced data analytics, Council Fire demonstrates how targeted strategies can translate ambition into achievement. For instance, in February 2026, they partnered with a research university serving 35,000 students to accelerate its carbon neutrality goal from 2040 to 2035. This collaboration utilized detailed emissions inventories, scenario modeling, and strategic sequencing to focus on cost-effective efficiency measures, achieving both financial and environmental benefits [2].
Beyond technical expertise, Council Fire excels in securing funding to support these initiatives. In one notable example, they helped a mid-Atlantic coastal city obtain $14.7 million in federal and state grants within just 18 months. This success highlights their ability to align technical planning with funding opportunities, fostering confidence and encouraging institutional adoption [23].
Council Fire also transforms complex data into actionable policies by crafting compelling narratives that resonate with stakeholders. Dr. William Dennison, Vice President at the University of Maryland Center for Environmental Science, praised their collaborative approach:
"Council Fire has long been a key collaborator and partner... Their comprehensive economic, environmental, and social impact expertise combined with their collaboration and storytelling capabilities helps ensure our science and research can emerge from the labs and have real world impact" [22].
This ability to turn technical insights into persuasive storytelling builds trust and motivates action, bridging the gap between data and policy.
Recognized with multiple Best for the World B Corporation honors, Council Fire has established itself as a leader in driving measurable progress. Whether it’s implementing building retrofits, modeling decarbonization strategies, or creating circular economy frameworks, their expertise helps transform data into impactful climate and housing policies that deliver lasting results.
Conclusion
Turning data into actionable strategies for climate and housing policy requires more than just crunching numbers - it’s about creating a clear path forward. The five-step framework discussed here offers universities and research institutions a practical guide: begin with precise data collection to pinpoint major emission sources, weave sustainability metrics into campus systems, use predictive models to explore potential scenarios, engage stakeholders to ensure fairness, and maintain ongoing monitoring to adapt to evolving conditions.
This structured approach can deliver tangible outcomes. For instance, in February 2026, a major public research university conducted a comprehensive emissions inventory and discovered that a significant portion of its emissions stemmed from its central heating plant [2]. By modeling various scenarios with detailed cost schedules and emissions projections, the university set an accelerated carbon neutrality target and identified considerable cost savings [2].
However, success demands more than just technical expertise. Consolidating fragmented data systems into a unified, reliable source provides the real-time insight necessary for informed decision-making. Transparent stakeholder engagement and strategic prioritization - such as starting with efficiency measures that yield immediate savings to fund larger initiatives - are crucial for maintaining momentum [2][3].
FAQs
What campus data should we collect first?
To understand greenhouse gas emissions effectively, begin by gathering data on their primary sources, especially those tied to energy usage and associated activities. Focus on areas such as electricity consumption, heating and cooling systems, fleet vehicles, refrigerants, commuting patterns, and air travel. It's also essential to collect information on the age and capacity of energy infrastructure, including boilers and electrical systems. These insights are critical for analyzing the campus's carbon footprint and shaping policies that can lead to meaningful reductions in emissions.
How do we merge housing and climate datasets?
To integrate housing and climate datasets effectively, start by aligning them through shared geographic markers such as ZIP codes or census tracts. This approach allows you to merge housing details - like location and energy consumption - with climate-related data, including emissions levels and temperature trends. By applying predictive modeling alongside sustainability-focused metrics, you can uncover connections between housing policies and their environmental impacts. Standardizing the data is essential to ensure consistency, and involving stakeholders in the process helps produce actionable insights that can guide integrated policy development.
Which KPIs prove results and equity?
Key performance indicators (KPIs) that highlight results and fairness emphasize climate justice and equity-focused planning. Examples include monitoring reductions in emissions, incorporating acknowledgments of Indigenous lands, fostering stakeholder involvement, and guaranteeing that underserved communities have equal access to benefits. These metrics are essential for assessing both environmental progress and equitable outcomes.
Related Blog Posts
How to Build a Climate Resilience Plan for Universities & Research Institutions
How to Integrate Climate Risk into Infrastructure Planning for Universities & Research Institutions
How to Use Data to Inform Climate and Housing Policy for Municipalities & Government Agencies
How to Use Data to Inform Climate and Housing Policy for Corporations
Latest Articles
©2026
Narrative Change and Power Building: The Missing Half of Advocacy
Narrative change is the process of disrupting dominant narratives that normalize inequity and advancing new narratives from historically marginalized communities.
Funding Resilience Without Federal Grants
BRIC is unreliable and FEMA is shrinking. Here's how cities fund climate resilience with dedicated revenue, blended finance, and a coordinating authority.
The ESG Blind Spot: How AI Is Finding Risks in Companies Nobody Else Is Watching
Norway's sovereign wealth fund uses AI to screen 7,200 portfolio companies for forced labor and corruption within 24 hours. The real story is the emerging-market coverage gap that traditional ESG data vendors miss — and what it means for any company with a global supply chain.
FAQ
01
What does it really mean to “redefine profit”?
02
What makes Council Fire different?
03
Who does Council Fire work with?
04
What does working with Council Fire actually look like?
05
How does Council Fire help organizations turn big goals into action?
06
How does Council Fire define and measure success?
07
How does technology fit into Council Fire’s work?
Apr 19, 2026
How to Use Data to Inform Climate and Housing Policy for Universities & Research Institutions
Sustainability Strategy
In This Article
How universities can use climate, energy, and housing data to cut emissions, improve resilience, and guide equitable policy.
How to Use Data to Inform Climate and Housing Policy for Universities & Research Institutions
Universities face mounting challenges in addressing climate change and housing sustainability. Data-driven decision-making offers a clear path forward, enabling institutions to reduce emissions, optimize housing policies, and save costs. Here's how:
Pinpoint Emission Sources: A university identified its central heating plant as responsible for 42% of emissions, leading to a ground-source heat pump project that cut emissions by 35% and saved $2.8M annually.
Leverage Predictive Models: Scenario modeling helps universities accelerate carbon neutrality goals and prioritize impactful projects while aligning with financial incentives.
Integrate Housing and Climate Data: Combining occupancy, energy use, and climate risks improves housing resilience and operational efficiency.
Engage Stakeholders: Inclusive feedback ensures policies align with community needs, addressing equity concerns and fostering trust.
Track Performance: Metrics like emissions reductions, energy use intensity, and equity outcomes ensure measurable progress.
Data analytics transforms uncertainty into actionable strategies, delivering environmental improvements and financial benefits while addressing housing challenges.
5-Step Framework for Data-Driven Climate and Housing Policy in Universities
Data as the Basis for Policy, Innovation and Education
Step 1: Collect Climate and Housing Data
Effective policy development starts with gathering detailed, multi-source information about campus climate risks and housing vulnerabilities. Tools like the EPA's climate change indicators, which track changes through over 100 figures such as graphs and maps, provide a strong foundation for institutions to begin their assessments [6].
Identify Climate Risks
Reliable climate data is essential for creating resilient campus plans. Universities should focus on collecting information about temperature trends, precipitation patterns, and extreme weather events, using datasets that range from global to local scales [6]. For example, NASA's BioClim dataset offers 19 bioclimatic variables with a fine-scale resolution of approximately 800 m × 800 m, delivering valuable ecological and climate insights [4]. Similarly, high-resolution projections like NEX-DCP30 can help institutions evaluate local topography and climate gradients specific to their campuses [4].
In August 2023, Fannie Mae's climate impact adviser, Mary Lennon, and her analytics team used GIS technology to assess risks across a portfolio of over 17 million single-family loans. By combining national natural hazard datasets with precise property-level intelligence, they identified risks for homes located outside FEMA's designated 100-year flood zones [5]. Lennon highlighted the importance of granular data:
"Knowing exactly where a property is and understanding the surrounding environment is absolutely required for understanding climate risk, especially when you think of something like floods" [5].
Though FEMA maps are a helpful resource, they can sometimes be outdated. A comparative study revealed that less than 25% of areas identified as at risk by FEMA matched localized flood models provided by First Street, a national flood risk data provider [1]. To address these gaps, universities should incorporate predictive climate intelligence and updated meteorological models into their assessments. Resources like the Data.gov Archive, maintained by the Harvard Law School Library Innovation Lab, offer access to mirrored federal data for long-term planning [6].
With a clear understanding of climate risks, institutions can then shift their focus to evaluating campus housing vulnerabilities.
Assess Housing Challenges
Just as climate data is critical, housing data provides essential insights for enhancing campus resilience. Universities should gather geospatial housing data that links property locations to environmental factors like flood zones, while also considering socioeconomic indicators [5]. Information on building standards, insurance policies, and property values can further clarify the resilience of campus housing stock [5].
From 2020 to 2023, nominal insurance premiums increased by 33% (a 13% rise in real terms) [7]. Monitoring these financial trends alongside occupancy rates, student housing demand, and infrastructure weaknesses helps create a comprehensive picture of campus challenges. Tim Judge, Senior Vice President and Chief Climate Officer at Fannie Mae, emphasizes the human element:
"I don't talk about the property - I talk about the people who are living in the property" [5].
Incorporating Social Vulnerability Indexes (SVI) and Environmental Justice (EJ) metrics into data collection is equally important. These tools help identify how climate risks disproportionately affect certain student or faculty populations. Judge elaborates:
"In some vulnerable communities that have had historically less investment in infrastructure and the like, the impacts of climate are far greater" [5].
Taking this equity-centered approach ensures that housing policies address the diverse needs of the campus community. By collecting this extensive data, universities are better positioned to integrate sustainability metrics and predictive models in the next stages of planning.
Step 2: Integrate Sustainability and Housing Metrics
Combining sustainability indicators with housing metrics transforms raw data into practical insights for policy development. This approach uncovers the connections between energy use, emissions, and occupancy trends, enabling universities to craft strategies that balance environmental goals with student housing needs.
Use Energy and Emission Data
Breaking down emissions by specific buildings and systems helps pinpoint the most impactful areas. For instance, central heating plants can contribute 30% to 50% of a university's total emissions [2], making them a prime target for efficiency improvements. By analyzing the operations of these plants in detail, institutions can identify opportunities for significant reductions.
Syracuse University conducted a year-long study of selected apartment buildings to establish energy baselines. Using data from 490 files across 14 apartments, researchers tracked energy consumption, indoor environmental quality, and occupancy through motion and window sensors. The findings revealed that space heating accounted for 54.7% to 55.6% of total energy use. Additionally, Building B had a higher Energy Use Intensity (EUI) of 131.4 kWh/m², compared to Building A's 120.8 kWh/m² [8]. This detailed insight allowed the university to prioritize retrofits for the most energy-intensive buildings.
Tools like ENERGY STAR Portfolio Manager can help rank campus buildings and identify underperformers for retrofits [2]. For example, in February 2026, a large public research university with 35,000 students advanced its carbon neutrality goal from 2040 to 2035. By integrating building-level energy benchmarking with financial modeling, the institution launched 30 deep retrofits, achieving an average 40% energy reduction per building. A centerpiece of this effort was replacing its central plant with an 800-well ground-source heat pump system serving 22 buildings. This transition cut central plant emissions by 35% and delivered $2.8 million in annual operating cost savings [2].
Strategically sequencing efficiency measures can generate immediate savings to fund larger initiatives. Council Fire highlights:
"Starting with efficiency measures that generate immediate savings creates a revenue stream that funds larger capital projects" [2].
Simple measures like LED lighting upgrades and envelope improvements deliver quick returns, which can then finance more expensive projects such as central plant electrification. This type of energy analysis also supports a deeper understanding of occupancy and commuter patterns.
Analyze Commuter and Occupancy Patterns
Examining how students and faculty commute to campus - and where they live - can align housing policies with sustainability objectives. By combining housing occupancy data with commuting trends, universities can implement targeted programs like subsidized transit passes, e-bike lending, or remote work options to cut Scope 3 emissions [2]. One research university achieved a 28% reduction in single-occupancy vehicle trips through a mix of subsidized transit and e-bike lending programs [2].
Real-time occupancy data collected from motion detectors, CO2 sensors, and door/window contact sensors provides insights into how residential spaces are used [8]. This data allows for more efficient HVAC system operations, adjusting heating and cooling based on actual occupancy rather than fixed schedules. Michigan State University used an Integrated Energy Planning Model between 2012 and 2015 to commit to a 30% reduction in greenhouse gas emissions. By cross-referencing high-energy facilities with building systems, the university targeted over 100 buildings for retrocommissioning and introduced a web-based Energy Dashboard featuring real-time smart meter data for all 545 campus buildings [9].
Monitoring indoor environmental quality - such as temperature, humidity, CO2 levels, and particulate matter - alongside energy data ensures that efficiency upgrades maintain student health and comfort [8]. For instance, Syracuse University's study found that indoor humidity levels often dropped below the comfort range during winter, even though temperatures were well-regulated. This highlighted the importance of balancing energy efficiency with livability [8]. Combining these metrics paves the way for predictive modeling and more precise policy decisions.
Step 3: Apply Predictive Models for Decision-Making
Predictive models, built on integrated sustainability and housing data, are powerful tools for forecasting long-term impacts and shaping strategic policies. These models allow universities to evaluate various scenarios side-by-side, assessing how different approaches influence emissions, costs, and infrastructure over time. By bridging data with actionable insights, they help institutions move from analysis to informed decision-making.
Project Climate Risk Scenarios
Predictive tools provide universities with a clear view of potential pathways toward carbon neutrality. For instance, one large public research university used scenario modeling to explore four distinct strategies. The analysis revealed that advancing its carbon neutrality goal from 2040 to 2035 was not only achievable but also more cost-effective, thanks to federal incentives. This approach identified a phased strategy that would cut central plant emissions by 35% while reducing annual operating costs by $2.8 million [2].
These models also highlight critical moments when campus energy demand risks exceeding supply capacity [9]. Between 2012 and 2015, Michigan State University collaborated with Confluenc to develop the Integrated Energy Planning Model (IEPM). This tool analyzed data from 545 buildings using real-time smart meters for electricity and steam. The insights enabled MSU to prioritize retrocommissioning for over 100 facilities, achieving a 14% reduction in greenhouse gas emissions, a 10% drop in building energy intensity (kBtus/sf), and a 5% boost in power plant efficiency [9].
Financial forecasting adds another layer of precision, helping institutions measure the impact of investments on tuition, debt capacity, and net present value. One research university modeled a $340 million campus energy infrastructure upgrade, projecting $410 million in savings and avoided maintenance costs over 25 years. Federal incentives turned previously unfeasible projects into financially sound opportunities [2]. This same predictive approach can refine housing policies, ensuring every decision is backed by robust data.
Model Housing Policy Scenarios
Housing policy models empower universities to test strategies before committing resources. For example, models can compare the benefits of expanding on-campus housing versus forming off-campus partnerships or analyze how different occupancy patterns affect energy demand. Michigan State University utilized its IEPM to create a "build-your-own-energy-supply" web tool. This interactive platform allowed students and faculty to visualize how various policy decisions would impact key metrics over time, fostering transparency and community support. The tool directly informed MSU's Energy Transition Plan, which aims for a 65% emissions reduction by 2030 [9].
"The IEPM validates the direction the university is heading to achieve the desired outcomes, while at the same time allowing for new technologies, or business opportunities to be evaluated within the context of the key metrics for the campus energy supply, reliability, capacity, economics and the environment."
Michigan State University [9]
Effective housing models incorporate detailed emissions and energy data, broken down by building, system, and fuel type, alongside demographic and socio-economic factors [2][10]. This level of detail helps universities pinpoint high-energy-use facilities and prioritize retrofits. For instance, one university's modeling showed that targeting the 30 least efficient buildings for deep retrofits, coupled with a transition to heat pumps, could reduce emissions by 85% without relying on offsets [2]. By sequencing investments wisely - starting with quick, cost-saving efficiency measures - universities can generate revenue to fund larger projects, such as full housing electrification [2].
Step 4: Engage Stakeholders for Equitable Policies
Once universities establish strong data analytics for climate and housing, the next step is to actively involve the community to ensure policies are fair and inclusive. Policies rooted in data must also reflect the needs and experiences of the people they impact. This requires moving away from a top-down decision-making approach and embracing inclusive policy design. By involving students, faculty, staff, and local communities in shaping climate and housing strategies, universities can build trust, uncover overlooked issues, and create solutions that address actual challenges.
Equity should be the foundation of this process, guided by three key principles:
Distributional justice: Ensures that benefits, costs, and risks are shared fairly, avoiding undue burdens on low-income groups.
Procedural justice: Promotes inclusive planning, giving vulnerable populations meaningful opportunities to participate in decisions that affect them.
Recognition justice: Acknowledges the perspectives of marginalized groups while addressing systemic inequities, such as the lingering effects of historical redlining on housing access [11].
Collect Feedback from Students and Faculty
Engaging the campus community requires reaching people through various channels. For example, between July 2023 and May 2025, the University of Utah connected with over 4,300 individuals through listening sessions, pop-up events, classroom presentations, and roundtable discussions. This approach ensured that groups often left out of traditional surveys had a voice in the development of the university's Climate Action Plan [11].
Stanford University’s 2026 Climate Action Plan provides another example of how formal structures can amplify stakeholder input. The university created 14 working groups focused on topics like food systems and land use and established a Climate Action Advisory Committee, which included students nominated by their peers. This system funneled feedback from over 30,000 community members across 200 departments directly into decision-making processes [12].
Transparency also plays a significant role in building trust. Interactive tools, such as open dashboards, make modeling data accessible, helping students and faculty understand the reasoning behind decisions and track progress. Clark University in Worcester, Massachusetts, partnered with the Together for Kids Coalition from 2023 to 2024 to address child care barriers. Graduate students gathered data and conducted interviews with 10 families, then presented the findings through visual "data walks." This allowed participants to refine the conclusions and ensure the results reflected their lived experiences [13].
Such efforts set the stage for integrating measurable equity outcomes into policy frameworks.
Include Equity Metrics
Socioeconomic and demographic data must inform policy development. Metrics such as race, income, household size, and transportation access can pinpoint which groups are most vulnerable to climate and housing challenges [14]. Northeastern University’s Climate Justice Action Plan, developed with environmental justice leaders in Roxbury, tracks specific equity outcomes. In 2023, the university reported $147.5 million spent with underrepresented, minority-, and women-owned businesses and $32.3 million allocated in institutional student aid for Boston residents [15].
Metrics also reveal whether universities are contributing to local economic growth or extracting resources from surrounding communities. Northeastern achieved an 83% sustainable commute rate among faculty and staff in 2023, easing transportation issues for those unable to live near campus [15]. Similarly, Duke University's Homebuyer Club provided over 3,000 hours of homebuyer education to low-wage employees between 2013 and 2021, helping 67 credit-challenged workers purchase homes [16].
However, equity efforts can falter without clear decision-making processes. A survey of the University of Utah’s 17-member planning team showed high scores for recognition justice but wide variation in procedural justice ratings - from 2 to 9 on a 10-point scale. This inconsistency highlights how unclear processes can undermine equity goals. Establishing transparent frameworks that translate community input into concrete actions is essential to avoid stakeholder fatigue and maintain credibility [11].
Step 5: Monitor and Measure Policy Results
Effective monitoring ensures that policies lead to measurable outcomes. By consistently tracking results, institutions can identify successes, address shortcomings, and refine their strategies. This step builds on earlier efforts in data collection and predictive modeling, ensuring that decisions are backed by actionable insights.
Define Key Performance Indicators (KPIs)
To evaluate policy success, institutions must focus on specific metrics across climate, housing, and transportation. For climate, tracking greenhouse gas emissions is essential. This includes:
Scope 1: Direct emissions from campus operations.
Scope 2: Indirect emissions from purchased electricity and steam.
Scope 3: Emissions from commuting, business travel, and waste [18].
Another critical measure is Energy Use Intensity (EUI), which divides total energy consumption by square footage to account for campus growth [18].
In housing, metrics like space utilization and energy consumption reveal whether existing buildings are being used efficiently, potentially avoiding unnecessary new construction. Occupancy rates paired with energy data can uncover opportunities to reduce carbon footprints [19]. For transportation, KPIs should include:
Single-occupancy vehicle commute rates.
Availability of electric vehicle charging stations.
Sustainable fleet acquisitions [18].
For example, in 2024–25, 75% of University of California students and employees used sustainable commuting methods, such as walking, biking, public transit, or telecommuting [18].
Social equity metrics are equally important. Universities should measure progress toward Diversity, Equity, Inclusion, and Justice (DEIJ) goals. This includes tracking environmental justice efforts, access to healthy food, and regional procurement spending. The University of Pennsylvania, for instance, reported $702 million in regional procurement spending in fiscal year 2025, highlighting the impact of purchasing power on local economies [17][18].
Compare Pre- and Post-Policy Data
A baseline year is crucial for assessing progress. For example, the University of Pennsylvania uses fiscal year 2009 as its benchmark. By 2025, the university achieved a 49% reduction in net emissions on its main campus compared to FY09. Additionally, in FY25 alone, Penn recorded a 4.5% year-over-year decrease, amounting to 9,215 metric tons of carbon dioxide equivalent [17].
"Last year, Penn established a five-year roadmap to achieve carbon neutrality by 2042 and foster a strong culture of sustainability. One year into the plan, we've expanded reporting across more University properties, enhancing transparency, strengthening commitment, and increasing impact."
Anne Papageorge, Senior Vice President of Facilities & Real Estate Services, University of Pennsylvania [17]
Detailed data collection at the building level can highlight areas for improvement. The University of California system exemplifies this approach. In 2024, the UC system achieved a nearly 2% annual reduction in Energy Use Intensity, even as campus activity increased [18]. The system also grew its portfolio of all-electric buildings to 45 facilities, covering over 4.5 million square feet. Furthermore, 51% of new fleet vehicles acquired in 2024–25 were electric or hybrid [18]. These achievements demonstrate that growth and decarbonization can coexist when institutions track and act on the right metrics.
Case Study: Data-Driven Policies in Practice
Examples from higher education highlight how data-driven approaches make sustainability goals a reality. These cases show that detailed analytics can turn ambitious plans into measurable outcomes.
University Housing Resilience Projects
The University of Illinois Urbana-Champaign showcased innovation with its 124,000‑ft² instructional facility completed in 2021. This building achieved both LEED Zero Energy and LEED BD+C NC Platinum certifications. Leveraging energy modeling from DataBased+, the project team designed a geothermal exchange system featuring 40 wells drilled 450 feet deep. A $375,000 grant from the Student Sustainability Committee helped fund the initiative, which cut the building's energy use by 65% compared to conventional systems [20]. The facility now doubles as a teaching tool, as Doug Reddington, Associate Director of Real Estate Services at UIUC, explained:
"Professors can actually look at the building in a class and point to different components of the building in their teaching methodology" [20].
Meanwhile, UC Davis focused on upgrading existing infrastructure through its SWARM (Small Workplace Automation and Remote Monitoring) project. Between 2015 and August 2024, the Energy Engineering team, led by Supervisor Nico Fauchier-Magnan, installed internet-connected thermostats and meters across 70 buildings. This centralized system optimized energy use, even as the campus added 500,000 ft² of space. The results were striking: annual energy use dropped by 500,000 MMBTUs, saving $11 million in energy costs [21]. Fauchier-Magnan noted:
"We've been cost-positive on an annual basis for a few years - saving $3 million last year and more than $2 million the year before" [21].
These efforts demonstrate how targeted, data-driven projects can integrate seamlessly into larger campus strategies.
Sustainability Metrics in Campus Planning
Building on these successes, universities are leveraging advanced planning models to amplify the impact of data. Michigan State University (MSU) exemplifies this with its Integrated Energy Planning Model (IEPM), developed in collaboration with Confluenc after adopting its Energy Transition Plan in April 2012. This tool enabled MSU to simulate energy scenarios and prioritize retrocommissioning for over 100 campus facilities. By identifying high-energy-use buildings, the university achieved a 5% efficiency boost in its power plant [9].
Another large public research university, serving 35,000 students, used granular emissions data and financial modeling to accelerate its carbon neutrality goal from 2040 to 2035. Federal incentives revealed that acting sooner was more cost-effective. The plan included a mix of strategies, such as a 15 MW solar array and a 50 MW off-site wind power purchase agreement priced at $32/MWh - lower than the university’s blended grid rate [2].
These case studies make it clear: data analytics are not just tools for short-term improvements but are essential for shaping long-term sustainability strategies in higher education.
Partner with Council Fire for Data-Driven Policy Implementation
Turning data into meaningful action requires more than just analysis - it demands expertise, strategy, and a clear focus on impactful outcomes. With over 15 years of experience, Council Fire has helped universities and other institutions transform their sustainability goals into tangible results. Their approach zeroes in on high-impact areas, such as central heating plants, which are responsible for 30–50% of total university emissions [2]. Instead of diluting efforts across smaller projects, they prioritize actions that deliver measurable reductions.
By leveraging advanced data analytics, Council Fire demonstrates how targeted strategies can translate ambition into achievement. For instance, in February 2026, they partnered with a research university serving 35,000 students to accelerate its carbon neutrality goal from 2040 to 2035. This collaboration utilized detailed emissions inventories, scenario modeling, and strategic sequencing to focus on cost-effective efficiency measures, achieving both financial and environmental benefits [2].
Beyond technical expertise, Council Fire excels in securing funding to support these initiatives. In one notable example, they helped a mid-Atlantic coastal city obtain $14.7 million in federal and state grants within just 18 months. This success highlights their ability to align technical planning with funding opportunities, fostering confidence and encouraging institutional adoption [23].
Council Fire also transforms complex data into actionable policies by crafting compelling narratives that resonate with stakeholders. Dr. William Dennison, Vice President at the University of Maryland Center for Environmental Science, praised their collaborative approach:
"Council Fire has long been a key collaborator and partner... Their comprehensive economic, environmental, and social impact expertise combined with their collaboration and storytelling capabilities helps ensure our science and research can emerge from the labs and have real world impact" [22].
This ability to turn technical insights into persuasive storytelling builds trust and motivates action, bridging the gap between data and policy.
Recognized with multiple Best for the World B Corporation honors, Council Fire has established itself as a leader in driving measurable progress. Whether it’s implementing building retrofits, modeling decarbonization strategies, or creating circular economy frameworks, their expertise helps transform data into impactful climate and housing policies that deliver lasting results.
Conclusion
Turning data into actionable strategies for climate and housing policy requires more than just crunching numbers - it’s about creating a clear path forward. The five-step framework discussed here offers universities and research institutions a practical guide: begin with precise data collection to pinpoint major emission sources, weave sustainability metrics into campus systems, use predictive models to explore potential scenarios, engage stakeholders to ensure fairness, and maintain ongoing monitoring to adapt to evolving conditions.
This structured approach can deliver tangible outcomes. For instance, in February 2026, a major public research university conducted a comprehensive emissions inventory and discovered that a significant portion of its emissions stemmed from its central heating plant [2]. By modeling various scenarios with detailed cost schedules and emissions projections, the university set an accelerated carbon neutrality target and identified considerable cost savings [2].
However, success demands more than just technical expertise. Consolidating fragmented data systems into a unified, reliable source provides the real-time insight necessary for informed decision-making. Transparent stakeholder engagement and strategic prioritization - such as starting with efficiency measures that yield immediate savings to fund larger initiatives - are crucial for maintaining momentum [2][3].
FAQs
What campus data should we collect first?
To understand greenhouse gas emissions effectively, begin by gathering data on their primary sources, especially those tied to energy usage and associated activities. Focus on areas such as electricity consumption, heating and cooling systems, fleet vehicles, refrigerants, commuting patterns, and air travel. It's also essential to collect information on the age and capacity of energy infrastructure, including boilers and electrical systems. These insights are critical for analyzing the campus's carbon footprint and shaping policies that can lead to meaningful reductions in emissions.
How do we merge housing and climate datasets?
To integrate housing and climate datasets effectively, start by aligning them through shared geographic markers such as ZIP codes or census tracts. This approach allows you to merge housing details - like location and energy consumption - with climate-related data, including emissions levels and temperature trends. By applying predictive modeling alongside sustainability-focused metrics, you can uncover connections between housing policies and their environmental impacts. Standardizing the data is essential to ensure consistency, and involving stakeholders in the process helps produce actionable insights that can guide integrated policy development.
Which KPIs prove results and equity?
Key performance indicators (KPIs) that highlight results and fairness emphasize climate justice and equity-focused planning. Examples include monitoring reductions in emissions, incorporating acknowledgments of Indigenous lands, fostering stakeholder involvement, and guaranteeing that underserved communities have equal access to benefits. These metrics are essential for assessing both environmental progress and equitable outcomes.
Related Blog Posts
How to Build a Climate Resilience Plan for Universities & Research Institutions
How to Integrate Climate Risk into Infrastructure Planning for Universities & Research Institutions
How to Use Data to Inform Climate and Housing Policy for Municipalities & Government Agencies
How to Use Data to Inform Climate and Housing Policy for Corporations
Latest Articles
©2026
Narrative Change and Power Building: The Missing Half of Advocacy
Narrative change is the process of disrupting dominant narratives that normalize inequity and advancing new narratives from historically marginalized communities.
Funding Resilience Without Federal Grants
BRIC is unreliable and FEMA is shrinking. Here's how cities fund climate resilience with dedicated revenue, blended finance, and a coordinating authority.
The ESG Blind Spot: How AI Is Finding Risks in Companies Nobody Else Is Watching
Norway's sovereign wealth fund uses AI to screen 7,200 portfolio companies for forced labor and corruption within 24 hours. The real story is the emerging-market coverage gap that traditional ESG data vendors miss — and what it means for any company with a global supply chain.
FAQ
What does it really mean to “redefine profit”?
What makes Council Fire different?
Who does Council Fire work with?
What does working with Council Fire actually look like?
How does Council Fire help organizations turn big goals into action?
How does Council Fire define and measure success?
How does technology fit into Council Fire’s work?