
Aug 19, 2026
Cloud Platforms for Spatial Disaster Data
Governance
In This Article
Compare cloud GIS options: ArcGIS Online, Google Earth Engine, AWS, Azure, and open-source for disaster mapping, analysis, and sharing.
Cloud Platforms for Spatial Disaster Data
If you need one short answer: use ArcGIS Online for live incident maps, Google Earth Engine for satellite hazard analysis, AWS for custom data pipelines at scale, Azure for Microsoft-based sharing, and QGIS Cloud/GeoServer when you want open standards and more control.
I see the article making one main point: platform choice depends on three things - the data you manage, the dashboard people need, and how many agencies must share it. It also shows that no single platform does everything well.
The fast takeaway:
ArcGIS Online fits live field updates, shared maps, and public status views.
Google Earth Engine fits burn scars, flood extent, and other imagery-heavy analysis.
AWS fits custom, API-based disaster data systems built for large demand.
Azure fits agencies already using Microsoft identity and cloud tools.
QGIS Cloud / GeoServer fits teams that want open-stack control, but can handle more setup and upkeep.
A few facts stand out:
Virginia Beach cut situation report prep from 4.5 hours to 17 minutes with an ArcGIS-based setup.
During Hurricane Ian, teams logged 108,000+ field observations in about two weeks.
An AWS-based exposure platform handled nearly 6 million report requests.
A Google-backed alert setup in Taiwan reached 16+ million people.

Cloud GIS Platforms for Disaster Response: Side-by-Side Comparison
Quick Comparison
Platform | Best at | Main limit | Best fit |
|---|---|---|---|
ArcGIS Online | Live maps, field data, shared dashboards | Internet dependence, vendor lock-in | Local and state response teams |
Google Earth Engine | Satellite and raster analysis | Not built for live incident tracking | Hazard mapping and research |
AWS | Custom spatial pipelines and scale | Needs development work | National or multi-system data exchange |
Azure Maps | Secure sharing in Microsoft environments | Often needs extra GIS tools | Agencies already on Microsoft cloud |
QGIS Cloud / GeoServer | Open standards and custom setups | More admin and governance work | Teams wanting control over stack and data flow |
Bottom line: if you need day-to-day response coordination, ArcGIS Online leads. If you need heavy analysis, AWS and Google Earth Engine stand out. If you need secure agency sharing inside Microsoft tools, Azure makes sense. If you want open-source control, QGIS Cloud and GeoServer are the better match.
That is the lens I’d use to read the rest of the article.
1. Esri ArcGIS Online

Spatial Data Model
ArcGIS Online creates a shared operating picture by turning CAD, 311, sensor, and camera feeds into common layers for hazards, damage, road closures, and shelter status [7][10][2].
Teams in the field collect data through mobile apps like Survey123, QuickCapture, and Field Maps. Those apps send structured observations - waypoints, team tracks, and status icons - straight into the central map [9]. That matters in the middle of a response, when people need the same picture instead of patchy updates from different teams. During the Hurricane Ian response, search and rescue teams using the Search and Rescue Common Operating Platform (SARCOP) logged more than 108,000 field observations over two weeks [9].
Operational Dashboards
Watch Center dashboards help teams cut through noise. They screen out low-priority alerts and bring high-priority issues to the front, including working fires and panic-button alerts. In Virginia Beach, moving from 14 separate dashboards to one ArcGIS-based system cut situation report compilation time from 4.5 hours to 17 minutes and led to 93% more alerts being issued to city departments [7].
Those internal views become far more useful when agencies can work from the same layers across jurisdiction lines.
Cross-Agency Sharing
ArcGIS Online also supports controlled sharing across agencies without forcing them to give up ownership of their data. Through connected portals and collaboration groups, agencies can share authoritative layers while still keeping control of what they manage [8]. In the Francis Scott Key Bridge response in Baltimore, the U.S. Coast Guard, NOAA, and the U.S. Army Corps of Engineers shared bathymetric surveys and 3D wreckage meshes through connected portals, and the main shipping channel reopened in 76 days [8].
"Instead of exchanging things like memory sticks or email attachments, we can connect. It makes it so much faster and more efficient. Everybody could use the data for their mission and be aware of what was happening." - Lt. Commander Ian Hanna, US Coast Guard [8]
Regional Scalability
That shared setup has to keep working when local systems go down. This reliability is a cornerstone of climate resilience for vulnerable regions. Because ArcGIS Online is cloud-hosted, it remains available when local infrastructure fails due to floods, outages, or damaged networks [11]. Active Directory integration supports single sign-on and role-based access, which cuts down on multiple departmental logins [7]. ArcGIS Hub sites give residents a way to check road closures, shelter locations, and alerts by address [7].
The weak spot is connectivity. In remote areas or places hit hard by damage, poor internet access and battery limits can slow field collection. That's why satellite internet or FirstNet often becomes a key backup option [9].
2. Google Earth Engine
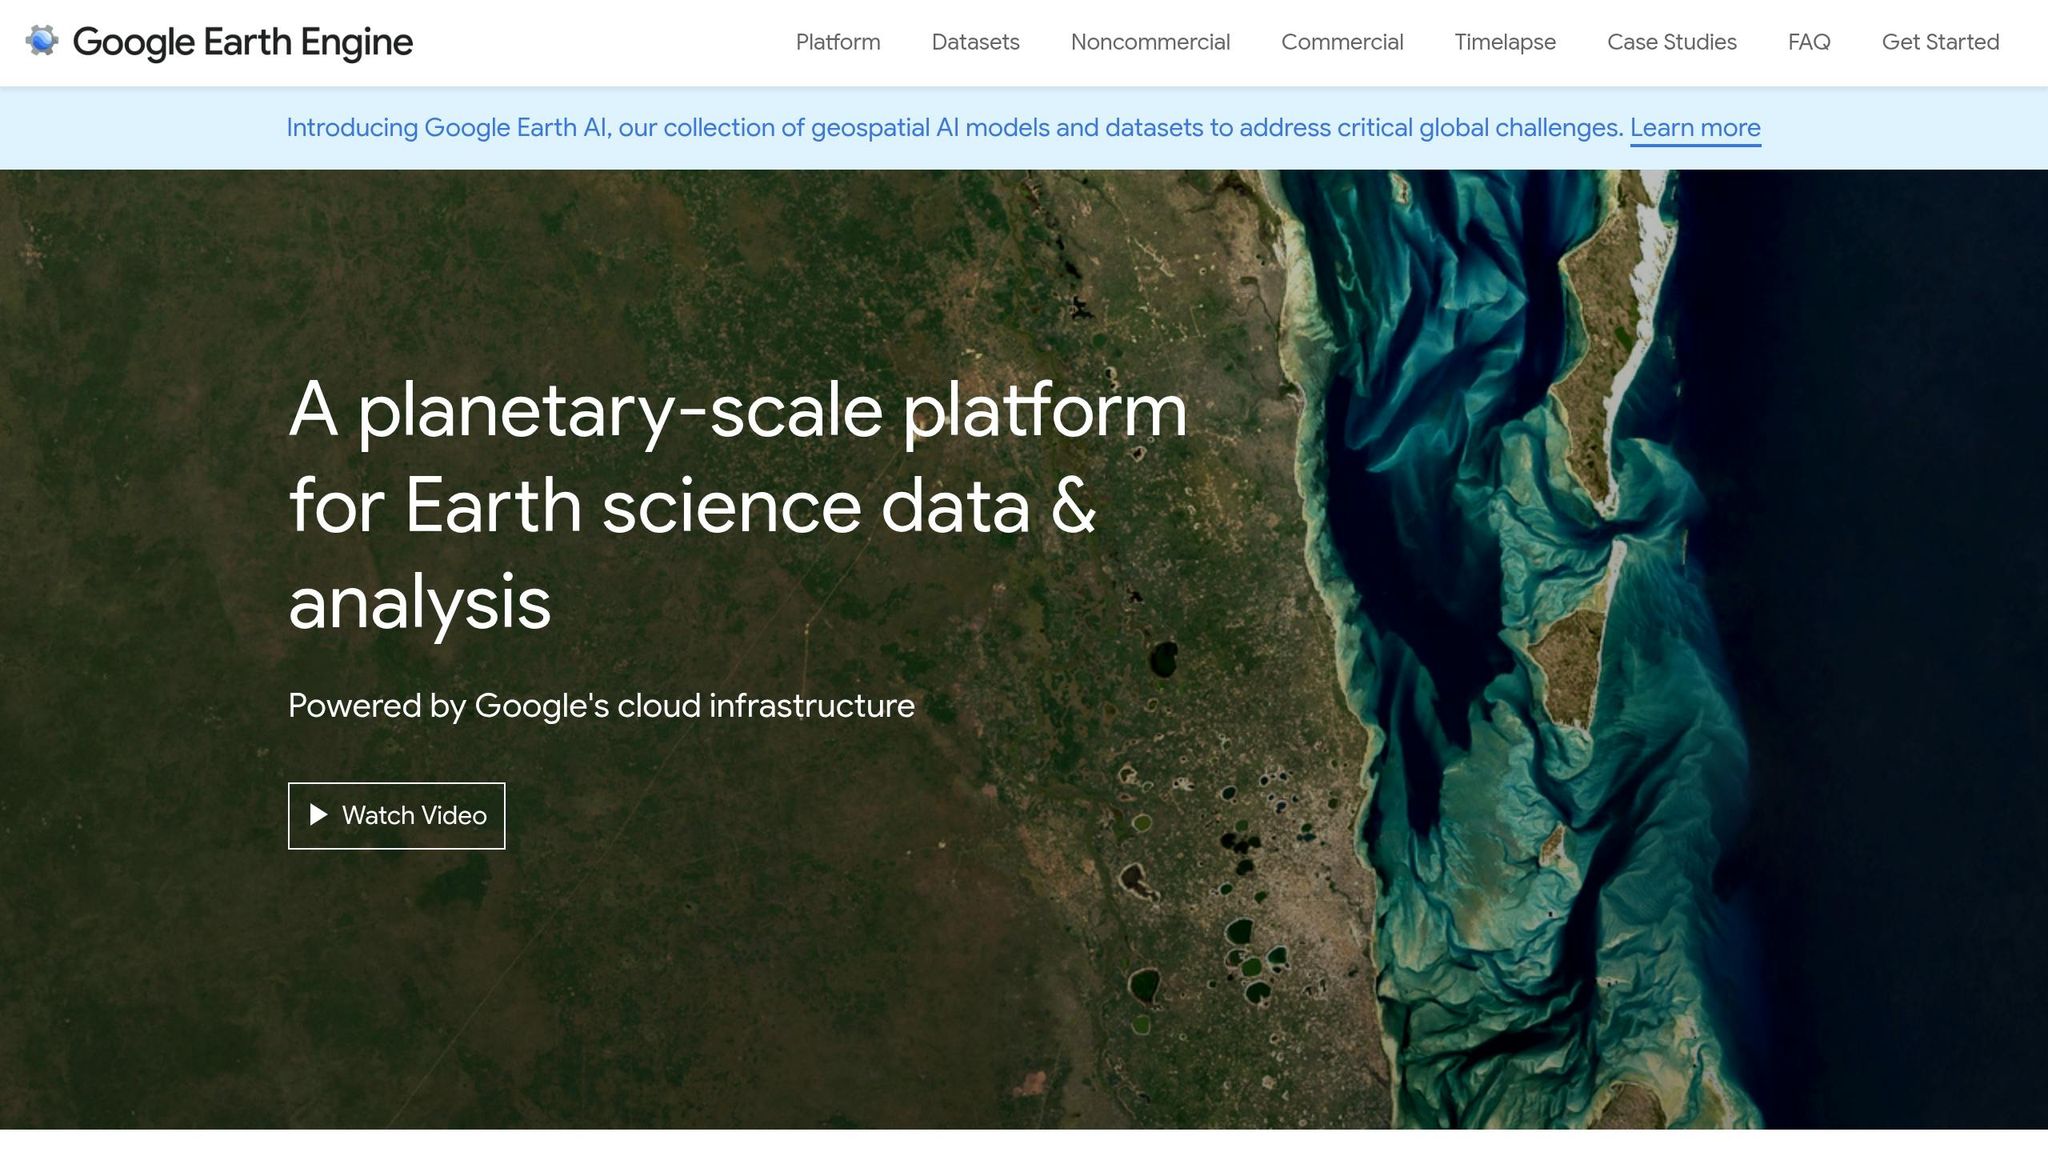
Unlike ArcGIS Online, Google Earth Engine is built to work with imagery analysis, not to manage live incident records.
Spatial Data Model
Google Earth Engine (GEE) is geared toward large-scale Earth observation analysis for hazard mapping. That makes it a good fit for mapping burn scars, flood footprints, and other hazard extents from Sentinel-2 and MODIS imagery. Sentinel-2 delivers multi-spectral images at up to 10-meter resolution, but its 5-day revisit cycle can miss conditions that shift fast during an active event [12].
That matters in practice. If a flood edge moves in hours, or a fire changes shape overnight, imagery alone may lag behind what crews on the ground are seeing.
GEE also does not track road closures, shelter status, or other live operational details. Agencies still need a separate system to handle day-to-day incident coordination.
Operational Dashboards
GEE works best as an analysis layer, not as a live incident dashboard. In most cases, agencies pair it with other tools that pull together satellite imagery, weather feeds, sensors, and field reports.
Think of it this way: GEE helps answer "What does the hazard look like from above?" It does not serve as the command board for "Which road is closed right now?" or "How many shelter beds are left?"
Cross-Agency Sharing and Regional Scalability
Once GEE turns imagery into hazard layers, agencies still need a cloud-based path to share those outputs.
Google’s cloud stack is stronger for regional alert distribution and dissemination than for tactical coordination. In Taiwan, the National Science and Technology Center for Disaster Reduction (NCDR) expanded its disaster management platform to include Google Public Alerts, sending derived hazard layers and alerts to more than 16 million people through cloud-based infrastructure [3]. The system also used three backup sites to support performance during major typhoon events.
"The system will be used to organize real-time information obtained from various units and present real-time information in a spatial map to enhance decision-maker abilities in assessing information related to disaster management." - National Science and Technology Center for Disaster Reduction (NCDR) [3]
Even with that scale, road access, shelter capacity, and other live operations still need a separate command system.
3. Amazon Web Services (AWS) for Disaster Response Data
AWS serves as the cloud backbone for custom spatial disaster systems, not a ready-made incident dashboard. While cloud GIS platforms tend to focus on shared maps and imagery analysis, AWS handles the backend work that moves spatial data from one system to another.
Spatial Data Model
AWS-based disaster systems often depend on custom apps and FME Cloud to ingest, transform, and deliver spatial data. A clear case is Geoscience Australia's Australian Exposure Information Platform (AEIP), which began development in June 2017. AEIP runs on AWS and brings together National Exposure Information System (NEXIS) data on buildings, population, demographics, and infrastructure. Users can define a custom area of interest, and the system emails an exposure report in 5–10 minutes [4].
"The AEIP project was a collaborative effort between spatial professionals, software developers, and emergency management practitioners to develop and deliver an application enabling Australia's emergency managers... access to nationally consistent exposure information." - Geospatial World [4]
Operational Dashboards
On AWS, dashboards are usually built as custom apps and APIs that feed into tools agencies already have in place. Once data is ingested, AWS routes it into those systems rather than asking responders to switch to a new interface. For example, the New South Wales Rural Fire Service connected AEIP data to Cerberus, its fire spread simulator, so responders could use exposure reports inside their situational-awareness workflow [4]. That setup can work well, but it comes with a catch: agencies need the time, budget, and technical work to build those connections up front.
Cross-Agency Sharing and Scale
That same pipeline lets many agencies pull from the same national dataset. This is where AWS stands out most: scale. AEIP has processed nearly 6 million Exposure Report requests from government agencies, academic institutions, and the public [4]. During the 2020–21 Black Summer bushfires and major floods from 2020 to 2022, federal and state agencies used the platform for relief and recovery planning [4].
Because the system is API-driven, different agencies can pull the same nationally consistent data into their own tools. In plain terms, one source can support many workflows at once. That makes the setup useful for coordination across multiple organizations and levels of government. The downside is just as clear: for agencies without strong technical capacity, the custom development work can be a barrier.
4. Microsoft Azure Maps and Azure Geospatial Services
Azure is a strong fit for agencies that need secure geospatial sharing inside a Microsoft-based environment. Azure Maps and related Azure geospatial services deliver secure, API-driven geospatial tools for disaster data sharing and operational mapping.
Spatial Data Model
Azure can bring hazard maps, damage reports, road closures, shelter status, and response assets into one live data model. That matters in a crisis. Field teams and staff in the operations center need to work from the same live layers, not separate versions that drift out of sync.
Operational Dashboards
Azure supports shared operational dashboards that pull incident layers and agency feeds into role-based workspaces. In plain terms, the right people see the right information at the right time, whether they’re tracking closures, shelters, or deployed assets.
Cross-Agency Sharing and Regional Scalability
Azure supports secure sharing through Microsoft identity, RBAC, and audit logs to control cross-agency access during multi-hazard events. Its main strength here is clear: agencies already using Microsoft tools can extend that same identity setup into geospatial sharing, which makes controlled collaboration much easier across departments and partner groups.
5. QGIS Cloud and GeoServer-Based Web GIS
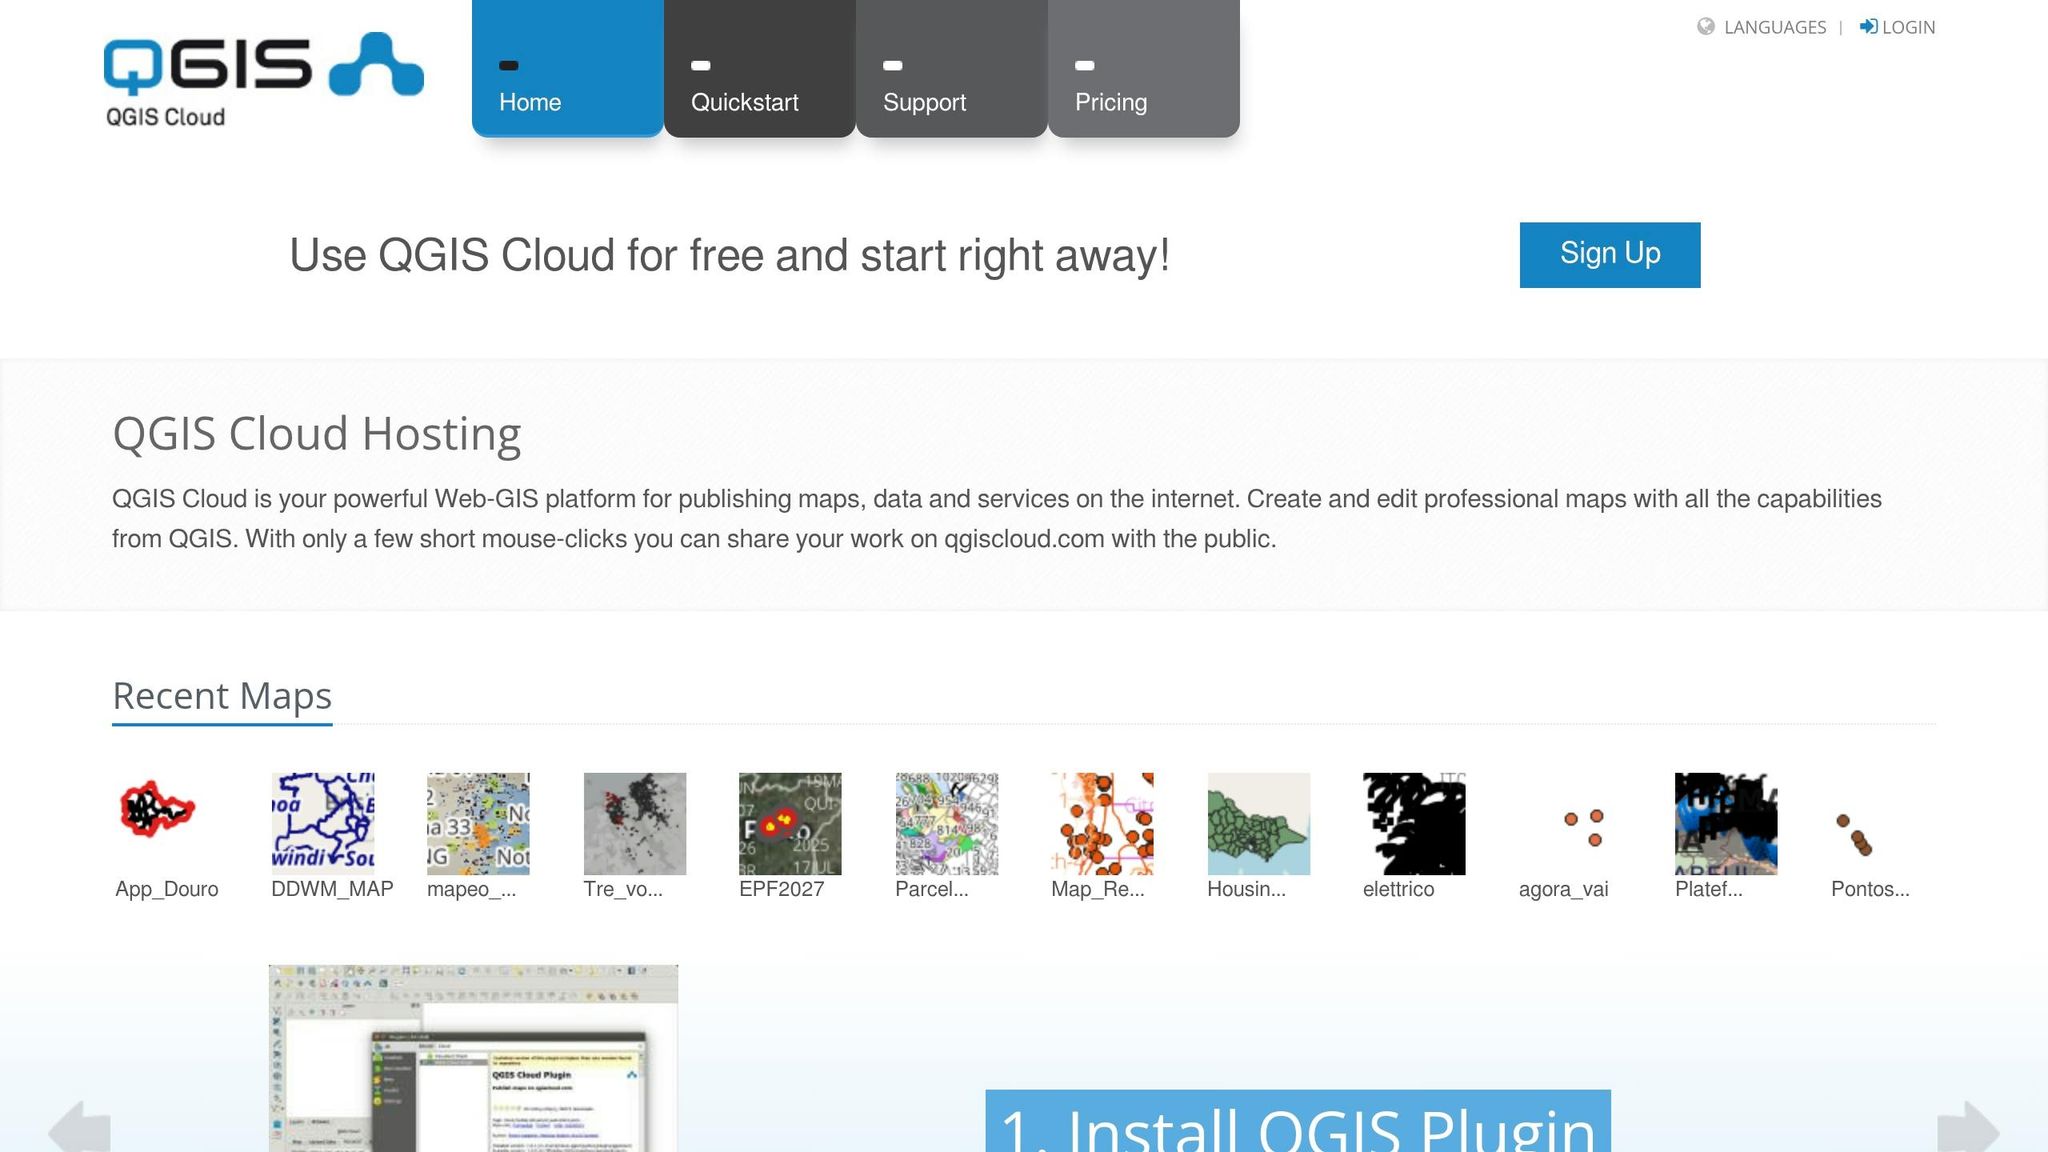
For agencies that want more control and open standards, open-source web GIS offers a different way to work. QGIS Cloud and GeoServer support standards-based sharing, but the agency takes on more of the hosting, setup, and tailoring.
Spatial Data Model
Disaster models can pull from both static and live data. Static layers may include land cover, population density, and soils, while dynamic inputs such as the Fire Weather Index and river levels help forecast hazards up to 72 hours ahead [2]. Damage layers can also sit on top of bedrock and soil maps to flag places where soft ground increases structural risk [10].
Operational Dashboards
Open-source web GIS can handle forecast layers, live feeds, and role-based views, but most emergency-management workflows need custom development to fit day-to-day operations [1][3][4]. That might mean adding decision-support modules with 3D views, regional warning modules, and automated exposure reports that show which people and infrastructure fall inside a user-defined area [3][4].
A good example is Turkey's AYDES platform. It brings desktop, mobile, and web GIS into one system and supports about 6,200 active users across central and provincial agencies [13].
Cross-Agency Sharing and Regional Scalability
This kind of internal flexibility matters even more when data has to move across agency lines. GeoServer supports OGC APIs for records, processes, and coverages, which helps agencies expose layers and reports to partner systems [14]. APIs also let partner agencies pull reports and data straight into their own platforms [4].
"The AEIP allows anyone to generate a report for any area of Australia at any time... combining the extensive work from the NEXIS and Exposure Reports with the comprehensive Natural Hazard Exposure Information Framework." - Mark Dunford, Con Charalambou, and Kane Orr, Geoscience Australia [4]
That tradeoff often shapes deployment decisions.
Deployment Tradeoffs and Key Considerations
Those platform differences create a set of deployment tradeoffs that often drive agency choice.
One of the clearest splits is real-time feature editing versus raster analytics. Real-time feature editing works best for day-to-day operational updates like damage reports, road closures, and shelter status. Raster analytics, by contrast, is better suited to hazard mapping and remote sensing. In practice, large raster workloads often start on desktop tools, then move to the cloud before they ever show up in a web dashboard [13][2].
Once deployment speed is on the table, governance tends to become the next hard limit. Managed cloud services can get to operational status faster, while open-stack builds usually need dedicated spatial developers and more lead time. Australia’s AEIP shows what an open-stack model can do at scale: its AWS-based exposure reporting system has handled nearly 6 million requests since 2018 [4].
Governance is also where many crisis deployments start to break down. Public portals and internal dashboards should stay separate so sensitive data does not leak into public view. Role-based access, schema alignment, and data sensitivity rules need to be set before an incident starts, not in the middle of one. Managed platforms often come with standard schemas and audit logs [6][1]. Open-stack environments give agencies more room to shape the system around local needs, but that same freedom can turn into fragmentation if data stewardship is not set up in advance.
The matrix below condenses the main deployment choices.
Deployment Factor | Key Tradeoff | Platform Strengths | Best Fit |
|---|---|---|---|
Real-Time Feature Editing | Precision vs. speed | ArcGIS Online | Local EOCs, fire departments |
Large-Scale Raster Analytics | Processing power vs. web accessibility | AWS, Azure, Google Earth Engine | National research centers |
Public Portals | Transparency vs. data security | Google Public Alerts, ArcGIS Dashboards | Public information offices |
Managed Cloud Services | Cost vs. deployment speed | ArcGIS Online, Azure Maps | Regional planners, county OES |
Open-Stack / Bespoke | Customization vs. maintenance burden | AEIP (AWS + FME Cloud), GeoServer | National authorities, research institutions |
Federated SDI | Autonomy vs. interoperability | Metadata harvested from distributed databases | Multi-agency regional teams |
The next section weighs those tradeoffs directly.
Pros and Cons by Platform
Each platform fits a different kind of operation. The sharpest differences show up in three places: live updates, analytics, and how tightly teams can control data sharing.
ArcGIS Online works best when agencies need integrated dashboards, field updates, and public-facing maps. It’s a strong fit for teams that want a connected system without building everything from scratch. The main downside is vendor lock-in, and advanced modeling still calls for GIS skill.
AWS stands out for high-volume, API-driven disaster data pipelines. If the job involves moving large amounts of data across systems and regions, AWS is a strong option. The tradeoff is clear: teams need custom development and steady infrastructure management.
Google Earth Engine is built for large-scale raster analysis. It shines in hazard mapping and in work such as burn scar detection or flood extent analysis. Where it falls short is internal agency coordination and live operational tracking.
Azure tends to make sense for agencies already deep in the Microsoft stack, especially for identity and hosting. It can support live incident mapping well, but full GIS depth often relies on third-party software.
QGIS Cloud and GeoServer give agencies the most control over data models and standards. That freedom can be a big plus for teams with specialized needs. Still, it comes with more upkeep and a stronger need for governance.
The table below turns those differences into the operational choices that matter most.
Platform | Pros | Cons | Strongest Use Case |
|---|---|---|---|
Esri ArcGIS Online | Integrated suite for dashboards and field coordination; rapid configuration; strong public-facing maps and dashboards | Proprietary ecosystem; advanced modeling requires GIS expertise | National hazard mapping and live incident coordination |
AWS | Massive scalability; API-driven integration; supports bespoke national exposure platforms | Requires dedicated development and infrastructure management | High-volume exposure reporting and multi-region data exchange |
Google Earth Engine | Large-scale raster analysis; strong for hazard mapping and remote sensing | Limited depth for internal agency workflows or live operational data | Burn scar, flood extent, and hazard footprint analysis |
Microsoft Azure Maps and Azure Geospatial Services | High-availability hosting; support for live incident mapping | Often needs third-party GIS tools for full spatial functionality | Multi-region infrastructure and redundant hosting |
QGIS Cloud / GeoServer | Highly customizable; open-source flexibility | High maintenance burden; structured governance required | Multi-hazard coordination and specialized situational awareness |
Conclusion
Platform choice comes down to three things: the data model, who needs the dashboard, and how far the data needs to travel. Looking across the options, the same three decision points keep showing up.
For real-time situational awareness, ArcGIS Online is the strongest fit. For compute-heavy hazard analysis, AWS is the better fit. For cross-agency sharing, a hybrid setup - ArcGIS Online paired with Azure - brings together fire and rescue units with 911 calls for local, state, and federal coordination [5].
That said, the platform itself is only half the call. Cross-agency use breaks down without shared rules for role-based access, data ownership, and update timing [1][5]. If those rules aren't set early, even a strong system can crack when pressure hits.
The best outcomes come from pairing the platform with the mission and setting shared data rules before an incident starts.
FAQs
How do I choose the right platform for my agency?
Prioritize a cloud-based, GIS-centered platform that cuts down data fragmentation by giving agencies and regions a shared workspace and one common operating picture.
Focus on a system with role-based collaboration, persistent operational workspaces, multi-hazard views, strong data management, and interactive dashboards and reporting. That mix helps stakeholders move fast, explore the same information, and share it with confidence - without everyone working from different versions of the truth.
When does a hybrid disaster data setup make the most sense?
A hybrid disaster data setup works best when agencies need two things at once: a shared, always-on system for coordination and dashboards, and a way for field teams to collect data offline or over weak connections, then sync it later.
In practice, that gives teams one common place for hazard, exposure, and operational data, while still linking to existing regional and national spatial systems through web services, APIs, and federation. The payoff is simple: less fragmentation and more consistent situational awareness across jurisdictions.
What data governance rules should be set before an incident?
Before an incident happens, agencies need clear rules for authorization levels, data quality standards, and metadata requirements. That groundwork matters. Without it, even simple data sharing can turn into a mess.
They should spell out user roles and access permissions so national and municipal stakeholders can securely store, share, and update data within their own scopes. In practice, that means each group knows what it can view, change, and pass along - and nothing is left to guesswork.
Protocols should also cover data cleansing, metadata for source and collection date, and the steps for integrating datasets across regional and federal boundaries. If those rules are set early, agencies can move data with less friction when time is tight.
Related Blog Posts
Latest Articles
©2025

Narrative Change and Power Building: The Missing Half of Advocacy
Narrative change is the process of disrupting dominant narratives that normalize inequity and advancing new narratives from historically marginalized communities.

Funding Resilience Without Federal Grants
BRIC is unreliable and FEMA is shrinking. Here's how cities fund climate resilience with dedicated revenue, blended finance, and a coordinating authority.

The ESG Blind Spot: How AI Is Finding Risks in Companies Nobody Else Is Watching
Norway's sovereign wealth fund uses AI to screen 7,200 portfolio companies for forced labor and corruption within 24 hours. The real story is the emerging-market coverage gap that traditional ESG data vendors miss — and what it means for any company with a global supply chain.
Narrative Change and Power Building: The Missing Half of Advocacy
Narrative change is the process of disrupting dominant narratives that normalize inequity and advancing new narratives from historically marginalized communities.
Funding Resilience Without Federal Grants
BRIC is unreliable and FEMA is shrinking. Here's how cities fund climate resilience with dedicated revenue, blended finance, and a coordinating authority.
The ESG Blind Spot: How AI Is Finding Risks in Companies Nobody Else Is Watching
Norway's sovereign wealth fund uses AI to screen 7,200 portfolio companies for forced labor and corruption within 24 hours. The real story is the emerging-market coverage gap that traditional ESG data vendors miss — and what it means for any company with a global supply chain.
FAQ
01
What does it really mean to “redefine profit”?
02
What makes Council Fire different?
03
Who does Council Fire work with?
04
What does working with Council Fire actually look like?
05
How does Council Fire help organizations turn big goals into action?
06
How does Council Fire define and measure success?
Aug 19, 2026
Cloud Platforms for Spatial Disaster Data
Governance
In This Article
Compare cloud GIS options: ArcGIS Online, Google Earth Engine, AWS, Azure, and open-source for disaster mapping, analysis, and sharing.
Cloud Platforms for Spatial Disaster Data
If you need one short answer: use ArcGIS Online for live incident maps, Google Earth Engine for satellite hazard analysis, AWS for custom data pipelines at scale, Azure for Microsoft-based sharing, and QGIS Cloud/GeoServer when you want open standards and more control.
I see the article making one main point: platform choice depends on three things - the data you manage, the dashboard people need, and how many agencies must share it. It also shows that no single platform does everything well.
The fast takeaway:
ArcGIS Online fits live field updates, shared maps, and public status views.
Google Earth Engine fits burn scars, flood extent, and other imagery-heavy analysis.
AWS fits custom, API-based disaster data systems built for large demand.
Azure fits agencies already using Microsoft identity and cloud tools.
QGIS Cloud / GeoServer fits teams that want open-stack control, but can handle more setup and upkeep.
A few facts stand out:
Virginia Beach cut situation report prep from 4.5 hours to 17 minutes with an ArcGIS-based setup.
During Hurricane Ian, teams logged 108,000+ field observations in about two weeks.
An AWS-based exposure platform handled nearly 6 million report requests.
A Google-backed alert setup in Taiwan reached 16+ million people.
Cloud GIS Platforms for Disaster Response: Side-by-Side Comparison
Quick Comparison
Platform | Best at | Main limit | Best fit |
|---|---|---|---|
ArcGIS Online | Live maps, field data, shared dashboards | Internet dependence, vendor lock-in | Local and state response teams |
Google Earth Engine | Satellite and raster analysis | Not built for live incident tracking | Hazard mapping and research |
AWS | Custom spatial pipelines and scale | Needs development work | National or multi-system data exchange |
Azure Maps | Secure sharing in Microsoft environments | Often needs extra GIS tools | Agencies already on Microsoft cloud |
QGIS Cloud / GeoServer | Open standards and custom setups | More admin and governance work | Teams wanting control over stack and data flow |
Bottom line: if you need day-to-day response coordination, ArcGIS Online leads. If you need heavy analysis, AWS and Google Earth Engine stand out. If you need secure agency sharing inside Microsoft tools, Azure makes sense. If you want open-source control, QGIS Cloud and GeoServer are the better match.
That is the lens I’d use to read the rest of the article.
1. Esri ArcGIS Online
Spatial Data Model
ArcGIS Online creates a shared operating picture by turning CAD, 311, sensor, and camera feeds into common layers for hazards, damage, road closures, and shelter status [7][10][2].
Teams in the field collect data through mobile apps like Survey123, QuickCapture, and Field Maps. Those apps send structured observations - waypoints, team tracks, and status icons - straight into the central map [9]. That matters in the middle of a response, when people need the same picture instead of patchy updates from different teams. During the Hurricane Ian response, search and rescue teams using the Search and Rescue Common Operating Platform (SARCOP) logged more than 108,000 field observations over two weeks [9].
Operational Dashboards
Watch Center dashboards help teams cut through noise. They screen out low-priority alerts and bring high-priority issues to the front, including working fires and panic-button alerts. In Virginia Beach, moving from 14 separate dashboards to one ArcGIS-based system cut situation report compilation time from 4.5 hours to 17 minutes and led to 93% more alerts being issued to city departments [7].
Those internal views become far more useful when agencies can work from the same layers across jurisdiction lines.
Cross-Agency Sharing
ArcGIS Online also supports controlled sharing across agencies without forcing them to give up ownership of their data. Through connected portals and collaboration groups, agencies can share authoritative layers while still keeping control of what they manage [8]. In the Francis Scott Key Bridge response in Baltimore, the U.S. Coast Guard, NOAA, and the U.S. Army Corps of Engineers shared bathymetric surveys and 3D wreckage meshes through connected portals, and the main shipping channel reopened in 76 days [8].
"Instead of exchanging things like memory sticks or email attachments, we can connect. It makes it so much faster and more efficient. Everybody could use the data for their mission and be aware of what was happening." - Lt. Commander Ian Hanna, US Coast Guard [8]
Regional Scalability
That shared setup has to keep working when local systems go down. This reliability is a cornerstone of climate resilience for vulnerable regions. Because ArcGIS Online is cloud-hosted, it remains available when local infrastructure fails due to floods, outages, or damaged networks [11]. Active Directory integration supports single sign-on and role-based access, which cuts down on multiple departmental logins [7]. ArcGIS Hub sites give residents a way to check road closures, shelter locations, and alerts by address [7].
The weak spot is connectivity. In remote areas or places hit hard by damage, poor internet access and battery limits can slow field collection. That's why satellite internet or FirstNet often becomes a key backup option [9].
2. Google Earth Engine
Unlike ArcGIS Online, Google Earth Engine is built to work with imagery analysis, not to manage live incident records.
Spatial Data Model
Google Earth Engine (GEE) is geared toward large-scale Earth observation analysis for hazard mapping. That makes it a good fit for mapping burn scars, flood footprints, and other hazard extents from Sentinel-2 and MODIS imagery. Sentinel-2 delivers multi-spectral images at up to 10-meter resolution, but its 5-day revisit cycle can miss conditions that shift fast during an active event [12].
That matters in practice. If a flood edge moves in hours, or a fire changes shape overnight, imagery alone may lag behind what crews on the ground are seeing.
GEE also does not track road closures, shelter status, or other live operational details. Agencies still need a separate system to handle day-to-day incident coordination.
Operational Dashboards
GEE works best as an analysis layer, not as a live incident dashboard. In most cases, agencies pair it with other tools that pull together satellite imagery, weather feeds, sensors, and field reports.
Think of it this way: GEE helps answer "What does the hazard look like from above?" It does not serve as the command board for "Which road is closed right now?" or "How many shelter beds are left?"
Cross-Agency Sharing and Regional Scalability
Once GEE turns imagery into hazard layers, agencies still need a cloud-based path to share those outputs.
Google’s cloud stack is stronger for regional alert distribution and dissemination than for tactical coordination. In Taiwan, the National Science and Technology Center for Disaster Reduction (NCDR) expanded its disaster management platform to include Google Public Alerts, sending derived hazard layers and alerts to more than 16 million people through cloud-based infrastructure [3]. The system also used three backup sites to support performance during major typhoon events.
"The system will be used to organize real-time information obtained from various units and present real-time information in a spatial map to enhance decision-maker abilities in assessing information related to disaster management." - National Science and Technology Center for Disaster Reduction (NCDR) [3]
Even with that scale, road access, shelter capacity, and other live operations still need a separate command system.
3. Amazon Web Services (AWS) for Disaster Response Data
AWS serves as the cloud backbone for custom spatial disaster systems, not a ready-made incident dashboard. While cloud GIS platforms tend to focus on shared maps and imagery analysis, AWS handles the backend work that moves spatial data from one system to another.
Spatial Data Model
AWS-based disaster systems often depend on custom apps and FME Cloud to ingest, transform, and deliver spatial data. A clear case is Geoscience Australia's Australian Exposure Information Platform (AEIP), which began development in June 2017. AEIP runs on AWS and brings together National Exposure Information System (NEXIS) data on buildings, population, demographics, and infrastructure. Users can define a custom area of interest, and the system emails an exposure report in 5–10 minutes [4].
"The AEIP project was a collaborative effort between spatial professionals, software developers, and emergency management practitioners to develop and deliver an application enabling Australia's emergency managers... access to nationally consistent exposure information." - Geospatial World [4]
Operational Dashboards
On AWS, dashboards are usually built as custom apps and APIs that feed into tools agencies already have in place. Once data is ingested, AWS routes it into those systems rather than asking responders to switch to a new interface. For example, the New South Wales Rural Fire Service connected AEIP data to Cerberus, its fire spread simulator, so responders could use exposure reports inside their situational-awareness workflow [4]. That setup can work well, but it comes with a catch: agencies need the time, budget, and technical work to build those connections up front.
Cross-Agency Sharing and Scale
That same pipeline lets many agencies pull from the same national dataset. This is where AWS stands out most: scale. AEIP has processed nearly 6 million Exposure Report requests from government agencies, academic institutions, and the public [4]. During the 2020–21 Black Summer bushfires and major floods from 2020 to 2022, federal and state agencies used the platform for relief and recovery planning [4].
Because the system is API-driven, different agencies can pull the same nationally consistent data into their own tools. In plain terms, one source can support many workflows at once. That makes the setup useful for coordination across multiple organizations and levels of government. The downside is just as clear: for agencies without strong technical capacity, the custom development work can be a barrier.
4. Microsoft Azure Maps and Azure Geospatial Services
Azure is a strong fit for agencies that need secure geospatial sharing inside a Microsoft-based environment. Azure Maps and related Azure geospatial services deliver secure, API-driven geospatial tools for disaster data sharing and operational mapping.
Spatial Data Model
Azure can bring hazard maps, damage reports, road closures, shelter status, and response assets into one live data model. That matters in a crisis. Field teams and staff in the operations center need to work from the same live layers, not separate versions that drift out of sync.
Operational Dashboards
Azure supports shared operational dashboards that pull incident layers and agency feeds into role-based workspaces. In plain terms, the right people see the right information at the right time, whether they’re tracking closures, shelters, or deployed assets.
Cross-Agency Sharing and Regional Scalability
Azure supports secure sharing through Microsoft identity, RBAC, and audit logs to control cross-agency access during multi-hazard events. Its main strength here is clear: agencies already using Microsoft tools can extend that same identity setup into geospatial sharing, which makes controlled collaboration much easier across departments and partner groups.
5. QGIS Cloud and GeoServer-Based Web GIS
For agencies that want more control and open standards, open-source web GIS offers a different way to work. QGIS Cloud and GeoServer support standards-based sharing, but the agency takes on more of the hosting, setup, and tailoring.
Spatial Data Model
Disaster models can pull from both static and live data. Static layers may include land cover, population density, and soils, while dynamic inputs such as the Fire Weather Index and river levels help forecast hazards up to 72 hours ahead [2]. Damage layers can also sit on top of bedrock and soil maps to flag places where soft ground increases structural risk [10].
Operational Dashboards
Open-source web GIS can handle forecast layers, live feeds, and role-based views, but most emergency-management workflows need custom development to fit day-to-day operations [1][3][4]. That might mean adding decision-support modules with 3D views, regional warning modules, and automated exposure reports that show which people and infrastructure fall inside a user-defined area [3][4].
A good example is Turkey's AYDES platform. It brings desktop, mobile, and web GIS into one system and supports about 6,200 active users across central and provincial agencies [13].
Cross-Agency Sharing and Regional Scalability
This kind of internal flexibility matters even more when data has to move across agency lines. GeoServer supports OGC APIs for records, processes, and coverages, which helps agencies expose layers and reports to partner systems [14]. APIs also let partner agencies pull reports and data straight into their own platforms [4].
"The AEIP allows anyone to generate a report for any area of Australia at any time... combining the extensive work from the NEXIS and Exposure Reports with the comprehensive Natural Hazard Exposure Information Framework." - Mark Dunford, Con Charalambou, and Kane Orr, Geoscience Australia [4]
That tradeoff often shapes deployment decisions.
Deployment Tradeoffs and Key Considerations
Those platform differences create a set of deployment tradeoffs that often drive agency choice.
One of the clearest splits is real-time feature editing versus raster analytics. Real-time feature editing works best for day-to-day operational updates like damage reports, road closures, and shelter status. Raster analytics, by contrast, is better suited to hazard mapping and remote sensing. In practice, large raster workloads often start on desktop tools, then move to the cloud before they ever show up in a web dashboard [13][2].
Once deployment speed is on the table, governance tends to become the next hard limit. Managed cloud services can get to operational status faster, while open-stack builds usually need dedicated spatial developers and more lead time. Australia’s AEIP shows what an open-stack model can do at scale: its AWS-based exposure reporting system has handled nearly 6 million requests since 2018 [4].
Governance is also where many crisis deployments start to break down. Public portals and internal dashboards should stay separate so sensitive data does not leak into public view. Role-based access, schema alignment, and data sensitivity rules need to be set before an incident starts, not in the middle of one. Managed platforms often come with standard schemas and audit logs [6][1]. Open-stack environments give agencies more room to shape the system around local needs, but that same freedom can turn into fragmentation if data stewardship is not set up in advance.
The matrix below condenses the main deployment choices.
Deployment Factor | Key Tradeoff | Platform Strengths | Best Fit |
|---|---|---|---|
Real-Time Feature Editing | Precision vs. speed | ArcGIS Online | Local EOCs, fire departments |
Large-Scale Raster Analytics | Processing power vs. web accessibility | AWS, Azure, Google Earth Engine | National research centers |
Public Portals | Transparency vs. data security | Google Public Alerts, ArcGIS Dashboards | Public information offices |
Managed Cloud Services | Cost vs. deployment speed | ArcGIS Online, Azure Maps | Regional planners, county OES |
Open-Stack / Bespoke | Customization vs. maintenance burden | AEIP (AWS + FME Cloud), GeoServer | National authorities, research institutions |
Federated SDI | Autonomy vs. interoperability | Metadata harvested from distributed databases | Multi-agency regional teams |
The next section weighs those tradeoffs directly.
Pros and Cons by Platform
Each platform fits a different kind of operation. The sharpest differences show up in three places: live updates, analytics, and how tightly teams can control data sharing.
ArcGIS Online works best when agencies need integrated dashboards, field updates, and public-facing maps. It’s a strong fit for teams that want a connected system without building everything from scratch. The main downside is vendor lock-in, and advanced modeling still calls for GIS skill.
AWS stands out for high-volume, API-driven disaster data pipelines. If the job involves moving large amounts of data across systems and regions, AWS is a strong option. The tradeoff is clear: teams need custom development and steady infrastructure management.
Google Earth Engine is built for large-scale raster analysis. It shines in hazard mapping and in work such as burn scar detection or flood extent analysis. Where it falls short is internal agency coordination and live operational tracking.
Azure tends to make sense for agencies already deep in the Microsoft stack, especially for identity and hosting. It can support live incident mapping well, but full GIS depth often relies on third-party software.
QGIS Cloud and GeoServer give agencies the most control over data models and standards. That freedom can be a big plus for teams with specialized needs. Still, it comes with more upkeep and a stronger need for governance.
The table below turns those differences into the operational choices that matter most.
Platform | Pros | Cons | Strongest Use Case |
|---|---|---|---|
Esri ArcGIS Online | Integrated suite for dashboards and field coordination; rapid configuration; strong public-facing maps and dashboards | Proprietary ecosystem; advanced modeling requires GIS expertise | National hazard mapping and live incident coordination |
AWS | Massive scalability; API-driven integration; supports bespoke national exposure platforms | Requires dedicated development and infrastructure management | High-volume exposure reporting and multi-region data exchange |
Google Earth Engine | Large-scale raster analysis; strong for hazard mapping and remote sensing | Limited depth for internal agency workflows or live operational data | Burn scar, flood extent, and hazard footprint analysis |
Microsoft Azure Maps and Azure Geospatial Services | High-availability hosting; support for live incident mapping | Often needs third-party GIS tools for full spatial functionality | Multi-region infrastructure and redundant hosting |
QGIS Cloud / GeoServer | Highly customizable; open-source flexibility | High maintenance burden; structured governance required | Multi-hazard coordination and specialized situational awareness |
Conclusion
Platform choice comes down to three things: the data model, who needs the dashboard, and how far the data needs to travel. Looking across the options, the same three decision points keep showing up.
For real-time situational awareness, ArcGIS Online is the strongest fit. For compute-heavy hazard analysis, AWS is the better fit. For cross-agency sharing, a hybrid setup - ArcGIS Online paired with Azure - brings together fire and rescue units with 911 calls for local, state, and federal coordination [5].
That said, the platform itself is only half the call. Cross-agency use breaks down without shared rules for role-based access, data ownership, and update timing [1][5]. If those rules aren't set early, even a strong system can crack when pressure hits.
The best outcomes come from pairing the platform with the mission and setting shared data rules before an incident starts.
FAQs
How do I choose the right platform for my agency?
Prioritize a cloud-based, GIS-centered platform that cuts down data fragmentation by giving agencies and regions a shared workspace and one common operating picture.
Focus on a system with role-based collaboration, persistent operational workspaces, multi-hazard views, strong data management, and interactive dashboards and reporting. That mix helps stakeholders move fast, explore the same information, and share it with confidence - without everyone working from different versions of the truth.
When does a hybrid disaster data setup make the most sense?
A hybrid disaster data setup works best when agencies need two things at once: a shared, always-on system for coordination and dashboards, and a way for field teams to collect data offline or over weak connections, then sync it later.
In practice, that gives teams one common place for hazard, exposure, and operational data, while still linking to existing regional and national spatial systems through web services, APIs, and federation. The payoff is simple: less fragmentation and more consistent situational awareness across jurisdictions.
What data governance rules should be set before an incident?
Before an incident happens, agencies need clear rules for authorization levels, data quality standards, and metadata requirements. That groundwork matters. Without it, even simple data sharing can turn into a mess.
They should spell out user roles and access permissions so national and municipal stakeholders can securely store, share, and update data within their own scopes. In practice, that means each group knows what it can view, change, and pass along - and nothing is left to guesswork.
Protocols should also cover data cleansing, metadata for source and collection date, and the steps for integrating datasets across regional and federal boundaries. If those rules are set early, agencies can move data with less friction when time is tight.
Related Blog Posts
Latest Articles
©2025
Narrative Change and Power Building: The Missing Half of Advocacy
Narrative change is the process of disrupting dominant narratives that normalize inequity and advancing new narratives from historically marginalized communities.
Funding Resilience Without Federal Grants
BRIC is unreliable and FEMA is shrinking. Here's how cities fund climate resilience with dedicated revenue, blended finance, and a coordinating authority.
The ESG Blind Spot: How AI Is Finding Risks in Companies Nobody Else Is Watching
Norway's sovereign wealth fund uses AI to screen 7,200 portfolio companies for forced labor and corruption within 24 hours. The real story is the emerging-market coverage gap that traditional ESG data vendors miss — and what it means for any company with a global supply chain.
FAQ
01
What does it really mean to “redefine profit”?
02
What makes Council Fire different?
03
Who does Council Fire work with?
04
What does working with Council Fire actually look like?
05
How does Council Fire help organizations turn big goals into action?
06
How does Council Fire define and measure success?
Aug 19, 2026
Cloud Platforms for Spatial Disaster Data
Governance
In This Article
Compare cloud GIS options: ArcGIS Online, Google Earth Engine, AWS, Azure, and open-source for disaster mapping, analysis, and sharing.
Cloud Platforms for Spatial Disaster Data
If you need one short answer: use ArcGIS Online for live incident maps, Google Earth Engine for satellite hazard analysis, AWS for custom data pipelines at scale, Azure for Microsoft-based sharing, and QGIS Cloud/GeoServer when you want open standards and more control.
I see the article making one main point: platform choice depends on three things - the data you manage, the dashboard people need, and how many agencies must share it. It also shows that no single platform does everything well.
The fast takeaway:
ArcGIS Online fits live field updates, shared maps, and public status views.
Google Earth Engine fits burn scars, flood extent, and other imagery-heavy analysis.
AWS fits custom, API-based disaster data systems built for large demand.
Azure fits agencies already using Microsoft identity and cloud tools.
QGIS Cloud / GeoServer fits teams that want open-stack control, but can handle more setup and upkeep.
A few facts stand out:
Virginia Beach cut situation report prep from 4.5 hours to 17 minutes with an ArcGIS-based setup.
During Hurricane Ian, teams logged 108,000+ field observations in about two weeks.
An AWS-based exposure platform handled nearly 6 million report requests.
A Google-backed alert setup in Taiwan reached 16+ million people.
Cloud GIS Platforms for Disaster Response: Side-by-Side Comparison
Quick Comparison
Platform | Best at | Main limit | Best fit |
|---|---|---|---|
ArcGIS Online | Live maps, field data, shared dashboards | Internet dependence, vendor lock-in | Local and state response teams |
Google Earth Engine | Satellite and raster analysis | Not built for live incident tracking | Hazard mapping and research |
AWS | Custom spatial pipelines and scale | Needs development work | National or multi-system data exchange |
Azure Maps | Secure sharing in Microsoft environments | Often needs extra GIS tools | Agencies already on Microsoft cloud |
QGIS Cloud / GeoServer | Open standards and custom setups | More admin and governance work | Teams wanting control over stack and data flow |
Bottom line: if you need day-to-day response coordination, ArcGIS Online leads. If you need heavy analysis, AWS and Google Earth Engine stand out. If you need secure agency sharing inside Microsoft tools, Azure makes sense. If you want open-source control, QGIS Cloud and GeoServer are the better match.
That is the lens I’d use to read the rest of the article.
1. Esri ArcGIS Online
Spatial Data Model
ArcGIS Online creates a shared operating picture by turning CAD, 311, sensor, and camera feeds into common layers for hazards, damage, road closures, and shelter status [7][10][2].
Teams in the field collect data through mobile apps like Survey123, QuickCapture, and Field Maps. Those apps send structured observations - waypoints, team tracks, and status icons - straight into the central map [9]. That matters in the middle of a response, when people need the same picture instead of patchy updates from different teams. During the Hurricane Ian response, search and rescue teams using the Search and Rescue Common Operating Platform (SARCOP) logged more than 108,000 field observations over two weeks [9].
Operational Dashboards
Watch Center dashboards help teams cut through noise. They screen out low-priority alerts and bring high-priority issues to the front, including working fires and panic-button alerts. In Virginia Beach, moving from 14 separate dashboards to one ArcGIS-based system cut situation report compilation time from 4.5 hours to 17 minutes and led to 93% more alerts being issued to city departments [7].
Those internal views become far more useful when agencies can work from the same layers across jurisdiction lines.
Cross-Agency Sharing
ArcGIS Online also supports controlled sharing across agencies without forcing them to give up ownership of their data. Through connected portals and collaboration groups, agencies can share authoritative layers while still keeping control of what they manage [8]. In the Francis Scott Key Bridge response in Baltimore, the U.S. Coast Guard, NOAA, and the U.S. Army Corps of Engineers shared bathymetric surveys and 3D wreckage meshes through connected portals, and the main shipping channel reopened in 76 days [8].
"Instead of exchanging things like memory sticks or email attachments, we can connect. It makes it so much faster and more efficient. Everybody could use the data for their mission and be aware of what was happening." - Lt. Commander Ian Hanna, US Coast Guard [8]
Regional Scalability
That shared setup has to keep working when local systems go down. This reliability is a cornerstone of climate resilience for vulnerable regions. Because ArcGIS Online is cloud-hosted, it remains available when local infrastructure fails due to floods, outages, or damaged networks [11]. Active Directory integration supports single sign-on and role-based access, which cuts down on multiple departmental logins [7]. ArcGIS Hub sites give residents a way to check road closures, shelter locations, and alerts by address [7].
The weak spot is connectivity. In remote areas or places hit hard by damage, poor internet access and battery limits can slow field collection. That's why satellite internet or FirstNet often becomes a key backup option [9].
2. Google Earth Engine
Unlike ArcGIS Online, Google Earth Engine is built to work with imagery analysis, not to manage live incident records.
Spatial Data Model
Google Earth Engine (GEE) is geared toward large-scale Earth observation analysis for hazard mapping. That makes it a good fit for mapping burn scars, flood footprints, and other hazard extents from Sentinel-2 and MODIS imagery. Sentinel-2 delivers multi-spectral images at up to 10-meter resolution, but its 5-day revisit cycle can miss conditions that shift fast during an active event [12].
That matters in practice. If a flood edge moves in hours, or a fire changes shape overnight, imagery alone may lag behind what crews on the ground are seeing.
GEE also does not track road closures, shelter status, or other live operational details. Agencies still need a separate system to handle day-to-day incident coordination.
Operational Dashboards
GEE works best as an analysis layer, not as a live incident dashboard. In most cases, agencies pair it with other tools that pull together satellite imagery, weather feeds, sensors, and field reports.
Think of it this way: GEE helps answer "What does the hazard look like from above?" It does not serve as the command board for "Which road is closed right now?" or "How many shelter beds are left?"
Cross-Agency Sharing and Regional Scalability
Once GEE turns imagery into hazard layers, agencies still need a cloud-based path to share those outputs.
Google’s cloud stack is stronger for regional alert distribution and dissemination than for tactical coordination. In Taiwan, the National Science and Technology Center for Disaster Reduction (NCDR) expanded its disaster management platform to include Google Public Alerts, sending derived hazard layers and alerts to more than 16 million people through cloud-based infrastructure [3]. The system also used three backup sites to support performance during major typhoon events.
"The system will be used to organize real-time information obtained from various units and present real-time information in a spatial map to enhance decision-maker abilities in assessing information related to disaster management." - National Science and Technology Center for Disaster Reduction (NCDR) [3]
Even with that scale, road access, shelter capacity, and other live operations still need a separate command system.
3. Amazon Web Services (AWS) for Disaster Response Data
AWS serves as the cloud backbone for custom spatial disaster systems, not a ready-made incident dashboard. While cloud GIS platforms tend to focus on shared maps and imagery analysis, AWS handles the backend work that moves spatial data from one system to another.
Spatial Data Model
AWS-based disaster systems often depend on custom apps and FME Cloud to ingest, transform, and deliver spatial data. A clear case is Geoscience Australia's Australian Exposure Information Platform (AEIP), which began development in June 2017. AEIP runs on AWS and brings together National Exposure Information System (NEXIS) data on buildings, population, demographics, and infrastructure. Users can define a custom area of interest, and the system emails an exposure report in 5–10 minutes [4].
"The AEIP project was a collaborative effort between spatial professionals, software developers, and emergency management practitioners to develop and deliver an application enabling Australia's emergency managers... access to nationally consistent exposure information." - Geospatial World [4]
Operational Dashboards
On AWS, dashboards are usually built as custom apps and APIs that feed into tools agencies already have in place. Once data is ingested, AWS routes it into those systems rather than asking responders to switch to a new interface. For example, the New South Wales Rural Fire Service connected AEIP data to Cerberus, its fire spread simulator, so responders could use exposure reports inside their situational-awareness workflow [4]. That setup can work well, but it comes with a catch: agencies need the time, budget, and technical work to build those connections up front.
Cross-Agency Sharing and Scale
That same pipeline lets many agencies pull from the same national dataset. This is where AWS stands out most: scale. AEIP has processed nearly 6 million Exposure Report requests from government agencies, academic institutions, and the public [4]. During the 2020–21 Black Summer bushfires and major floods from 2020 to 2022, federal and state agencies used the platform for relief and recovery planning [4].
Because the system is API-driven, different agencies can pull the same nationally consistent data into their own tools. In plain terms, one source can support many workflows at once. That makes the setup useful for coordination across multiple organizations and levels of government. The downside is just as clear: for agencies without strong technical capacity, the custom development work can be a barrier.
4. Microsoft Azure Maps and Azure Geospatial Services
Azure is a strong fit for agencies that need secure geospatial sharing inside a Microsoft-based environment. Azure Maps and related Azure geospatial services deliver secure, API-driven geospatial tools for disaster data sharing and operational mapping.
Spatial Data Model
Azure can bring hazard maps, damage reports, road closures, shelter status, and response assets into one live data model. That matters in a crisis. Field teams and staff in the operations center need to work from the same live layers, not separate versions that drift out of sync.
Operational Dashboards
Azure supports shared operational dashboards that pull incident layers and agency feeds into role-based workspaces. In plain terms, the right people see the right information at the right time, whether they’re tracking closures, shelters, or deployed assets.
Cross-Agency Sharing and Regional Scalability
Azure supports secure sharing through Microsoft identity, RBAC, and audit logs to control cross-agency access during multi-hazard events. Its main strength here is clear: agencies already using Microsoft tools can extend that same identity setup into geospatial sharing, which makes controlled collaboration much easier across departments and partner groups.
5. QGIS Cloud and GeoServer-Based Web GIS
For agencies that want more control and open standards, open-source web GIS offers a different way to work. QGIS Cloud and GeoServer support standards-based sharing, but the agency takes on more of the hosting, setup, and tailoring.
Spatial Data Model
Disaster models can pull from both static and live data. Static layers may include land cover, population density, and soils, while dynamic inputs such as the Fire Weather Index and river levels help forecast hazards up to 72 hours ahead [2]. Damage layers can also sit on top of bedrock and soil maps to flag places where soft ground increases structural risk [10].
Operational Dashboards
Open-source web GIS can handle forecast layers, live feeds, and role-based views, but most emergency-management workflows need custom development to fit day-to-day operations [1][3][4]. That might mean adding decision-support modules with 3D views, regional warning modules, and automated exposure reports that show which people and infrastructure fall inside a user-defined area [3][4].
A good example is Turkey's AYDES platform. It brings desktop, mobile, and web GIS into one system and supports about 6,200 active users across central and provincial agencies [13].
Cross-Agency Sharing and Regional Scalability
This kind of internal flexibility matters even more when data has to move across agency lines. GeoServer supports OGC APIs for records, processes, and coverages, which helps agencies expose layers and reports to partner systems [14]. APIs also let partner agencies pull reports and data straight into their own platforms [4].
"The AEIP allows anyone to generate a report for any area of Australia at any time... combining the extensive work from the NEXIS and Exposure Reports with the comprehensive Natural Hazard Exposure Information Framework." - Mark Dunford, Con Charalambou, and Kane Orr, Geoscience Australia [4]
That tradeoff often shapes deployment decisions.
Deployment Tradeoffs and Key Considerations
Those platform differences create a set of deployment tradeoffs that often drive agency choice.
One of the clearest splits is real-time feature editing versus raster analytics. Real-time feature editing works best for day-to-day operational updates like damage reports, road closures, and shelter status. Raster analytics, by contrast, is better suited to hazard mapping and remote sensing. In practice, large raster workloads often start on desktop tools, then move to the cloud before they ever show up in a web dashboard [13][2].
Once deployment speed is on the table, governance tends to become the next hard limit. Managed cloud services can get to operational status faster, while open-stack builds usually need dedicated spatial developers and more lead time. Australia’s AEIP shows what an open-stack model can do at scale: its AWS-based exposure reporting system has handled nearly 6 million requests since 2018 [4].
Governance is also where many crisis deployments start to break down. Public portals and internal dashboards should stay separate so sensitive data does not leak into public view. Role-based access, schema alignment, and data sensitivity rules need to be set before an incident starts, not in the middle of one. Managed platforms often come with standard schemas and audit logs [6][1]. Open-stack environments give agencies more room to shape the system around local needs, but that same freedom can turn into fragmentation if data stewardship is not set up in advance.
The matrix below condenses the main deployment choices.
Deployment Factor | Key Tradeoff | Platform Strengths | Best Fit |
|---|---|---|---|
Real-Time Feature Editing | Precision vs. speed | ArcGIS Online | Local EOCs, fire departments |
Large-Scale Raster Analytics | Processing power vs. web accessibility | AWS, Azure, Google Earth Engine | National research centers |
Public Portals | Transparency vs. data security | Google Public Alerts, ArcGIS Dashboards | Public information offices |
Managed Cloud Services | Cost vs. deployment speed | ArcGIS Online, Azure Maps | Regional planners, county OES |
Open-Stack / Bespoke | Customization vs. maintenance burden | AEIP (AWS + FME Cloud), GeoServer | National authorities, research institutions |
Federated SDI | Autonomy vs. interoperability | Metadata harvested from distributed databases | Multi-agency regional teams |
The next section weighs those tradeoffs directly.
Pros and Cons by Platform
Each platform fits a different kind of operation. The sharpest differences show up in three places: live updates, analytics, and how tightly teams can control data sharing.
ArcGIS Online works best when agencies need integrated dashboards, field updates, and public-facing maps. It’s a strong fit for teams that want a connected system without building everything from scratch. The main downside is vendor lock-in, and advanced modeling still calls for GIS skill.
AWS stands out for high-volume, API-driven disaster data pipelines. If the job involves moving large amounts of data across systems and regions, AWS is a strong option. The tradeoff is clear: teams need custom development and steady infrastructure management.
Google Earth Engine is built for large-scale raster analysis. It shines in hazard mapping and in work such as burn scar detection or flood extent analysis. Where it falls short is internal agency coordination and live operational tracking.
Azure tends to make sense for agencies already deep in the Microsoft stack, especially for identity and hosting. It can support live incident mapping well, but full GIS depth often relies on third-party software.
QGIS Cloud and GeoServer give agencies the most control over data models and standards. That freedom can be a big plus for teams with specialized needs. Still, it comes with more upkeep and a stronger need for governance.
The table below turns those differences into the operational choices that matter most.
Platform | Pros | Cons | Strongest Use Case |
|---|---|---|---|
Esri ArcGIS Online | Integrated suite for dashboards and field coordination; rapid configuration; strong public-facing maps and dashboards | Proprietary ecosystem; advanced modeling requires GIS expertise | National hazard mapping and live incident coordination |
AWS | Massive scalability; API-driven integration; supports bespoke national exposure platforms | Requires dedicated development and infrastructure management | High-volume exposure reporting and multi-region data exchange |
Google Earth Engine | Large-scale raster analysis; strong for hazard mapping and remote sensing | Limited depth for internal agency workflows or live operational data | Burn scar, flood extent, and hazard footprint analysis |
Microsoft Azure Maps and Azure Geospatial Services | High-availability hosting; support for live incident mapping | Often needs third-party GIS tools for full spatial functionality | Multi-region infrastructure and redundant hosting |
QGIS Cloud / GeoServer | Highly customizable; open-source flexibility | High maintenance burden; structured governance required | Multi-hazard coordination and specialized situational awareness |
Conclusion
Platform choice comes down to three things: the data model, who needs the dashboard, and how far the data needs to travel. Looking across the options, the same three decision points keep showing up.
For real-time situational awareness, ArcGIS Online is the strongest fit. For compute-heavy hazard analysis, AWS is the better fit. For cross-agency sharing, a hybrid setup - ArcGIS Online paired with Azure - brings together fire and rescue units with 911 calls for local, state, and federal coordination [5].
That said, the platform itself is only half the call. Cross-agency use breaks down without shared rules for role-based access, data ownership, and update timing [1][5]. If those rules aren't set early, even a strong system can crack when pressure hits.
The best outcomes come from pairing the platform with the mission and setting shared data rules before an incident starts.
FAQs
How do I choose the right platform for my agency?
Prioritize a cloud-based, GIS-centered platform that cuts down data fragmentation by giving agencies and regions a shared workspace and one common operating picture.
Focus on a system with role-based collaboration, persistent operational workspaces, multi-hazard views, strong data management, and interactive dashboards and reporting. That mix helps stakeholders move fast, explore the same information, and share it with confidence - without everyone working from different versions of the truth.
When does a hybrid disaster data setup make the most sense?
A hybrid disaster data setup works best when agencies need two things at once: a shared, always-on system for coordination and dashboards, and a way for field teams to collect data offline or over weak connections, then sync it later.
In practice, that gives teams one common place for hazard, exposure, and operational data, while still linking to existing regional and national spatial systems through web services, APIs, and federation. The payoff is simple: less fragmentation and more consistent situational awareness across jurisdictions.
What data governance rules should be set before an incident?
Before an incident happens, agencies need clear rules for authorization levels, data quality standards, and metadata requirements. That groundwork matters. Without it, even simple data sharing can turn into a mess.
They should spell out user roles and access permissions so national and municipal stakeholders can securely store, share, and update data within their own scopes. In practice, that means each group knows what it can view, change, and pass along - and nothing is left to guesswork.
Protocols should also cover data cleansing, metadata for source and collection date, and the steps for integrating datasets across regional and federal boundaries. If those rules are set early, agencies can move data with less friction when time is tight.
Related Blog Posts
Latest Articles
©2025
Narrative Change and Power Building: The Missing Half of Advocacy
Narrative change is the process of disrupting dominant narratives that normalize inequity and advancing new narratives from historically marginalized communities.
Funding Resilience Without Federal Grants
BRIC is unreliable and FEMA is shrinking. Here's how cities fund climate resilience with dedicated revenue, blended finance, and a coordinating authority.
The ESG Blind Spot: How AI Is Finding Risks in Companies Nobody Else Is Watching
Norway's sovereign wealth fund uses AI to screen 7,200 portfolio companies for forced labor and corruption within 24 hours. The real story is the emerging-market coverage gap that traditional ESG data vendors miss — and what it means for any company with a global supply chain.
FAQ
What does it really mean to “redefine profit”?
What makes Council Fire different?
Who does Council Fire work with?
What does working with Council Fire actually look like?
How does Council Fire help organizations turn big goals into action?
How does Council Fire define and measure success?