Apr 21, 2026
How to Use Data to Inform Climate and Housing Policy for Maritime & Logistics Companies
Sustainability Strategy
In This Article
Leverage emissions, geospatial, and workforce data to cut port emissions, forecast housing needs, and shape resilient policy.
How to Use Data to Inform Climate and Housing Policy for Maritime & Logistics Companies
Maritime and logistics companies face two major challenges: reducing emissions and addressing workforce housing shortages. Data is the key to tackling both. By analyzing emissions and housing data, companies can optimize operations, predict future needs, and shape policies that improve efficiency and employee well-being.
Key Points:
Global shipping contributes 940 million tons of CO₂ annually, with emissions potentially rising by 130% by 2050.
Workforce housing shortages in port cities increase commute times, emissions, and productivity issues.
Companies like KMTC saved $540,000 annually using digital tools for fuel efficiency.
Predictive analytics can optimize routes, reduce emissions, and improve housing strategies.
Tools like geospatial mapping and climate risk data help forecast housing needs and mitigate risks.
Takeaway:
By leveraging emissions tracking, predictive analytics, and workforce data, maritime companies can align climate goals with housing solutions, benefiting both operations and communities.
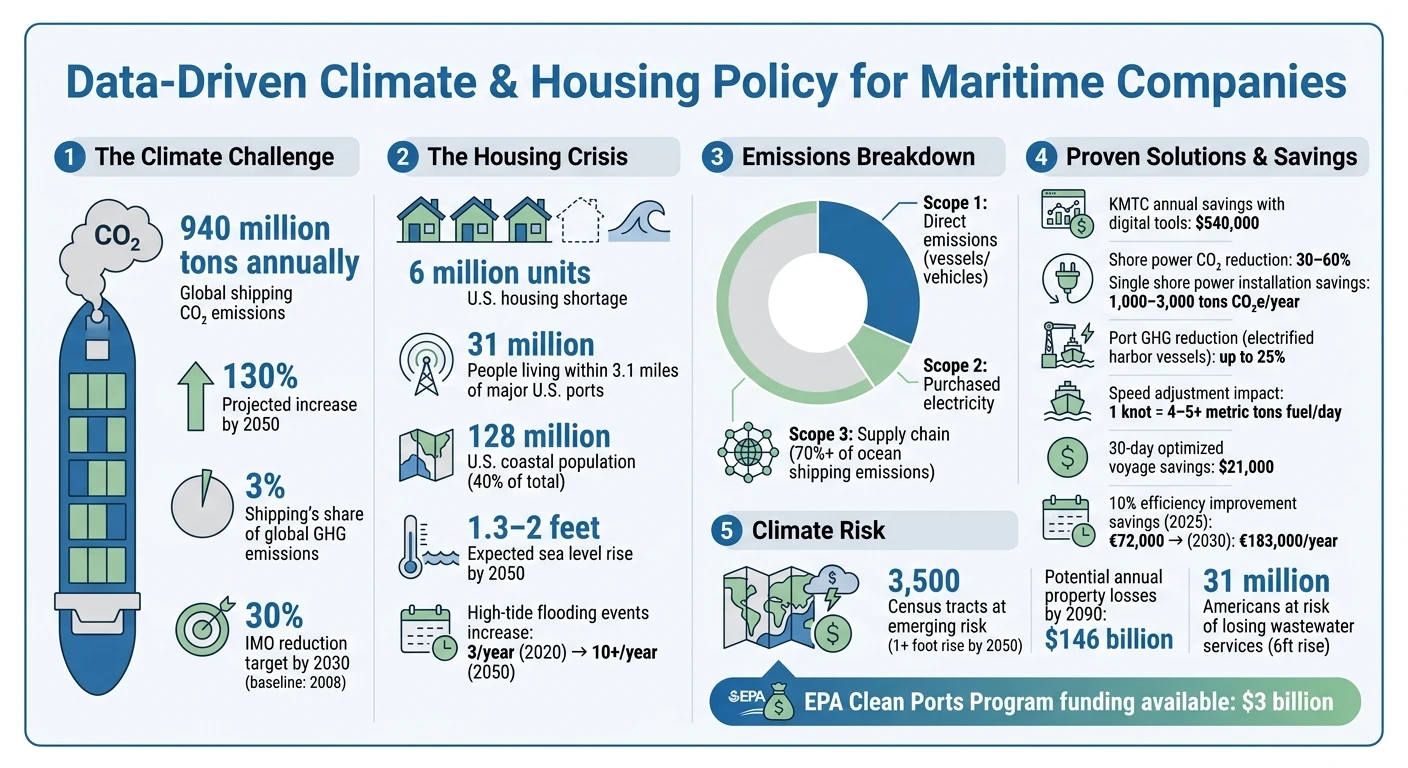
Maritime Industry Climate and Housing Data: Key Statistics for Policy Development
The importance of data quality in the era of ETS and FuelEU Maritime
Step 1: Gather the Right Data
To craft meaningful policies, focus on two critical data categories: emissions/environmental metrics and workforce/housing data. These datasets are essential for driving sustainable changes in climate and workforce housing policies. For maritime and logistics companies, this means tracking your carbon footprint alongside understanding housing challenges faced by employees.
Emissions and Environmental Data
Start by collecting primary data, such as fuel and energy consumption from telematics systems or fueling records. This approach provides accurate, real-world insights rather than relying on generalized industry averages. The focus should be on monitoring three key emission scopes:
Scope 1: Direct emissions from owned vessels and vehicles.
Scope 2: Indirect emissions from purchased electricity.
Scope 3: Emissions from your extended supply chain, which can account for over 70% of total greenhouse gas emissions in ocean shipping [5].
Specific operational metrics like distance traveled, cargo weight, fuel type (e.g., marine gas oil, LNG, biofuels), and engine specifications are vital. Following EPA guidelines, track pollutants relevant to mobile source sectors [3][8]. For ocean-going vessels, define transit mode as speeds exceeding 1 knot for precise inventory [3].
"Primary data is the linchpin for reliable emissions assessment, offering insights that drive decarbonization measures." - Shipzero [4]
Avoid treating GPS signals as primary emissions data. Instead, rely on activity-based calculations that use actual fuel consumption, weight, and distance data, steering clear of spend-based estimates [4][5]. Automate data collection by building API-based exchanges, ensuring emissions data flows seamlessly through multi-leg networks down to the shipment level [4].
Once emissions data is in place, shift your focus to workforce and housing challenges.
Workforce and Housing Demand Data
To complement emissions tracking, map housing and demographic patterns to understand workforce housing needs. Use geospatial mapping combined with demographic analysis to identify trends. High-resolution population datasets and federal port geometries can help pinpoint who lives near logistics hubs. A December 2024 US EPA report revealed that at least 31 million people reside within 3.1 miles (5,000 meters) of major US ports, with these populations often including higher shares of vulnerable groups compared to other areas [6].
"A key challenge of this work is the complexity of mapping and defining port operations geospatially." - US EPA [6]
Monitor workforce metrics such as crew retention, training completion rates, and productivity to spot housing-related stressors [7]. Incorporate data reporting requirements into terminal lease agreements to gather workforce information from tenants not directly under your port authority's control [2]. Collaborate with local universities and community groups to collect localized data on health, demographics, and air quality - factors that influence housing desirability and workforce stability [2]. Federal tools like Justice40 and EPA environmental justice guidelines can help identify vulnerable populations near your facilities [2][6].
Step 2: Use Predictive Analytics to Reduce Emissions
Once you've gathered baseline emissions and operational data, the next step is to apply predictive analytics. This approach can help cut fuel use, lower emissions, and improve overall efficiency. With global shipping responsible for 3% of worldwide greenhouse gas emissions [12], optimizing operations is essential to meet regulatory standards and lessen environmental impact.
Optimize Shipping Operations
Predictive models are transforming how shipping routes, speeds, and maintenance schedules are determined by factoring in a variety of data points. Modern route optimization considers vessel specifications, fuel efficiency curves, weather conditions, port congestion, and regulatory costs, all aimed at reducing idle time and emissions [10].
"Route optimization in shipping goes far beyond picking the shortest line on a chart. It's the discipline of selecting the best voyage configuration... to improve voyage economics... while reducing fuel burn, delay risk, and regulatory cost exposure." - AXS Marine [10]
The benefits are both financial and environmental. For sub-Capesize vessels, adjusting speed by just 1 knot can alter fuel consumption by 4–5+ metric tons per day [10]. Over a 30-day optimized voyage, operators can save $21,000, with $12,000 attributed to time savings and $9,000 from a 5% reduction in fuel consumption [10].
A pilot program is a great way to begin. Start by implementing predictive analytics on a single vessel or trade lane to establish benchmarks for fuel use and idle times [10]. Port-call analytics can help pinpoint congestion patterns and berth efficiency, allowing you to avoid heavily congested ports that lead to unnecessary emissions [10]. Predictive maintenance tools, which analyze sensor data, can also identify wear and tear early, ensuring timely repairs and reducing downtime [11]. Additionally, monitoring hull and propeller conditions can indicate when cleaning is needed, as fouling significantly increases fuel consumption [1].
These operational improvements set the stage for testing more advanced decarbonization strategies using digital tools.
Plan Decarbonization Scenarios
Digital ship models, or digital twins, provide a virtual testing ground for decarbonization strategies. These tools simulate the effects of adjustments such as changing operating profiles, retrofitting vessels, or using biofuels, offering reliable data on emissions reductions [9]. For instance, adopting shore power (cold ironing) can cut carbon emissions from docked ships by 30% to 60%, while electrifying short-trip harbor vessels like tugs and pilot boats can reduce port greenhouse gas emissions by up to 25% [12].
Prescriptive analytics takes this a step further by not just predicting outcomes but recommending actionable steps to achieve net-zero emissions [11]. Solutions like OptiCARBON™ allow fleets to model scenarios and ensure compliance with regulations such as EU ETS, FuelEU Maritime, and the IMO GHG measures [9]. For example, a 10% efficiency improvement for a 37,000 DWT chemical tanker on intra-EU voyages could save €72,000 in emissions costs in 2025, increasing to €183,000 annually by 2030 [1].
To maximize these insights, embed routing and speed recommendations directly into your operational workflows [10]. Continuously comparing actual voyage performance against modeled predictions will help refine assumptions and improve results over time [10]. By leveraging these tools, shipping companies can navigate the path toward decarbonization while staying competitive.
Step 3: Forecast Housing Needs with Data
In addition to tackling emissions, maritime companies face the challenge of ensuring workforce housing near ports. The United States is grappling with a housing shortage of approximately 6 million units, with millennials bearing the brunt of the crisis [15]. For port cities, this issue is compounded by surging property prices and climate risks that threaten existing homes.
Data-driven forecasting helps identify housing shortages and assess climate-related risks. By examining workforce distribution, migration trends, and environmental challenges, maritime employers can push for housing solutions that address both business goals and employee welfare. Much like emissions strategies, using data to predict housing needs allows companies to influence policies that benefit workers and communities alike.
Map Workforce and Housing Locations
Geospatial analysis is a powerful tool for identifying workforce housing needs. Federal datasets provide critical insights into the demographics and housing conditions of communities near ports.
Tools such as the Strong Foundations playbook offer detailed data on housing supply, affordability, migration, and job growth trends across hundreds of metropolitan areas [15]. Additionally, Python libraries like geopandas enable analysis of census tract-level data, allowing companies to map workforce locations in relation to port infrastructure and undeveloped land [14]. This kind of mapping highlights gaps where job growth outpaces housing development, giving business leaders the information they need to advocate for zoning changes and flexible lot sizes.
"The needs of employees and the needs of employers, in this case, are lining up in the same direction." – Arthur Gailes, Research Fellow, American Enterprise Institute [15]
Armed with these analyses, business leaders can make a strong case at city council meetings, demonstrating how increasing housing density near job centers benefits workers and boosts local tax revenue.
Build Climate Resilience into Housing Plans
Once workforce distribution is mapped, factoring in climate resilience ensures housing strategies remain viable in the long term. Ignoring climate risks when forecasting housing demand can leave companies exposed to disruptions. Coastal counties, home to around 128 million Americans - or 40% of the U.S. population - are especially vulnerable [14]. Sea levels along the U.S. coastline are expected to rise by 1.3–2 feet by 2050, with high-tide flooding events projected to increase from three per year in 2020 to over ten per year by 2050 [14].
Identifying "Emerging Risk Regions" is a key aspect of planning. Approximately 3,500 census tracts along the U.S. coastline - currently outside FEMA's high-risk zones - are predicted to experience at least 1 foot of sea-level rise by 2050 [14]. As Riddhisha Prabhu from Towards Data Science notes:
"Emerging Medium Term Risk census tracts should be considered high risk" [14]
Adopting a cautious approach to property valuations and development in these areas is essential.
Tools like Climate Central’s Ocean at the Door Map help assess housing vulnerabilities by comparing land elevation with sea-level rise projections and annual flood data [16]. Without proper adaptation measures, coastal regions could face up to $146 billion in annual property losses by 2090, and six feet of sea-level rise could leave 31 million Americans without wastewater services [17].
Incorporating climate data into housing forecasts enables companies to prioritize development in safer areas while advocating for infrastructure upgrades in existing neighborhoods. This might include elevated utilities or green infrastructure like rain gardens. These steps help shape policies that balance operational priorities with sustainable workforce housing solutions.
Step 4: Build Data into Policy Frameworks
After gathering data and applying predictive analytics, the next step is to translate these insights into actionable policies that drive progress in climate and housing innovation. Maritime operations are deeply connected to inland logistics, energy networks, and urban housing markets. Effective policies must reflect these interdependencies, ensuring that technical insights are seamlessly integrated into practical, cross-sector solutions.
Apply Systems Thinking to Policy Development
Sustainability in any sector demands a broad perspective. Ports, for example, are not isolated entities - they are part of a larger network that includes rail systems, warehouses, energy grids, and the communities supporting the workforce [20]. A systems-based approach views these components as interconnected layers, rather than standalone projects.
A materiality assessment can help identify the most pressing ESG concerns. For maritime companies, this often includes greenhouse gas emissions, crew welfare, and relationships with local communities [18][19]. In fact, 78% of organizations are moving toward unified environmental risk frameworks that address these issues together [18][19]. This means that climate policies must account for how decarbonization efforts impact workforce housing, and vice versa.
Legislative examples demonstrate how tools like GIS can enhance policy-making by spatially mapping environmental and housing challenges. Maritime companies can leverage GIS to combine spatial data - like flood zones or sensitive habitats - with statistical models. This creates adaptive policies that respond to evolving environmental conditions [21].
"By integrating spatial data with statistical and predictive models, policymakers craft strategies backed by real-time evidence and rigorous analysis." – Sarah Lee, GIS in Environmental Policy [21]
For instance, if a housing strategy involves coastal development, it’s crucial to have contingency plans for inland workforce housing in case sea-level rise accelerates beyond current projections.
Engage Stakeholders for Policy Success
While systems-based policy design lays the groundwork, stakeholder engagement is essential for validating and implementing these frameworks. By involving both local communities and operational stakeholders, policies can effectively bridge the gap between data-driven insights and meaningful, on-the-ground improvements. Transparency fosters trust, and public-facing dashboards that track metrics like emissions reductions, housing developments, and climate resilience can empower stakeholders to monitor progress [22]. The European Union's INSPIRE Geoportal exemplifies this approach by offering a centralized platform where governments, businesses, and communities can access shared spatial data for environmental and land-use planning [21].
Interactive mapping tools, such as Web GIS platforms like ArcGIS Online, allow stakeholders to visualize proposed land-use changes and provide informed feedback [21]. For example, when advocating for zoning adjustments or increased housing density near ports, these tools help city councils and community members understand how workforce distribution aligns with housing supply gaps. Establishing formal data-sharing agreements, like MOUs between government entities and private partners, can also streamline collaboration [22]. Many perceived legal barriers to data exchange can be addressed with clear guidelines on confidentiality and data protection [22].
To ensure policies are equitable, disaggregate data by race, ethnicity, gender, and income [22]. Collaborate with local communities to gather qualitative insights. While quantitative data on emissions and housing units is critical, engaging with people who have lived experience ensures that policies are relevant and address actual needs [22]. Between 2010 and 2017, homelessness in the U.S. decreased by 14% after adopting evidence-based practices that incorporated community input [22].
"Collection, analysis, and reporting of quality, timely qualitative and quantitative data is essential for targeting interventions, tracking results, making strategic decisions, and allocating resources at the federal, state, and local levels." – United States Interagency Council on Homelessness [22]
Step 5: Monitor and Evaluate Policy Results
Once a policy is in place, it’s essential to keep a close eye on how it performs. This means setting clear performance indicators and leveraging real-time data to make adjustments as needed. Monitoring isn't just a formality - it's how you ensure that strategies remain effective and responsive to new challenges. Without consistent evaluation, even the most carefully crafted policies can veer off track. These indicators are the foundation for assessing whether environmental and housing goals are being met.
Track Emissions and Housing Metrics
Start with a detailed emissions inventory that includes Scope 1, 2, and 3 emissions from vessels, harbor craft, handling equipment, and trucks [5][2]. Pay particular attention to Scope 3 emissions, as they often highlight the most impactful reduction opportunities. The International Maritime Organization has set a goal to cut greenhouse gas emissions by 30% by 2030, using 2008 levels as the baseline [2].
"By accurately measuring Scope 3 emissions, shipping companies can identify key areas for reduction, optimize fuel efficiency, and ensure compliance with emissions reporting standards." – Hamid Nouasria, Dockflow [5]
In addition to carbon dioxide, track air quality metrics like PM2.5, NOx, and NO2 in neighborhoods near ports [2]. Collaborating with local universities to install air quality monitors can help establish baseline data and build trust within the community. For instance, a single shore power installation at a busy berth can cut 1,000 to 3,000 tons of CO2e annually [2], making it vital to monitor how often shore power systems are being used. On the housing side, evaluate workforce distribution, the vulnerability of key assets to sea-level rise and storm surges, and the effectiveness of buffer zones separating industrial areas from residential communities [2][13].
Use Dashboards for Continuous Improvement
Real-time dashboards can turn static data into actionable insights. These tools eliminate the risk of "analysis paralysis" by allowing teams to evaluate complex datasets quickly [23]. They also create a shared space for logistics, supply chain, and sustainability teams to collaborate, enabling discussions about trade-offs like lead times versus emission reductions.
"Connecting departments, connecting different teams to have these types of conversations together that they were not able to have without this sort of visual appearance is really... a game changer." – Ruud van Dijk, Commercial Director, Routescanner [23]
Dashboards are particularly useful for running "what-if" scenarios, such as testing the impact of rerouting cargo to less polluting routes on costs and schedules [23]. Publishing air quality data openly can meet environmental justice requirements and demonstrate accountability to communities near ports [2]. If performance indicators fall short - such as receiving a 'D' or 'E' rating - document the corrective steps taken [24]. Programs like the EPA's Clean Ports Program, which offers $3 billion in funding for zero-emission equipment and infrastructure, often require detailed emissions tracking through dashboards to qualify for grants [2].
Conclusion
Maritime and logistics companies that view data as a strategic resource are better positioned to address challenges like climate change and workforce housing shortages. By leveraging predictive climate science, these companies can evaluate the risks of rare but impactful events, such as rising sea levels affecting coastal housing or extreme weather disrupting critical supply chains [26]. As Aon highlights:
"Risk managers need to move beyond a purely historical view of risk to adequately quantify the potential impacts of climate change" [26]
To meet ambitious environmental goals, such as the International Maritime Organization's 30% emissions reduction target by 2030, companies must refine local climate models and develop detailed emissions inventories [26][2]. Federal initiatives like the EPA's $3 billion Clean Ports Program provide crucial funding for businesses that document emissions and demonstrate measurable improvements [2].
Collaboration among stakeholders is essential. Fuel suppliers, shipping companies, and community advisory groups can work together to turn sustainability objectives into practical actions [25]. For instance, the City of Birmingham is using energy and climate data to support its net-zero pledge by 2030 [25]. Similarly, transparent air quality monitoring in neighborhoods near ports builds trust and addresses environmental justice concerns.
Ongoing monitoring ensures policies remain adaptable. Partnering with data experts to incorporate the latest research and transparent methodologies helps keep strategies aligned with shifting climate risks [26]. According to ICLEI:
"The importance of data-driven decision-making for climate action planning and implementation depends on the processes, methods and tools for data collection, as well as its management and interpretation" [25]
FAQs
What data should we collect first to measure Scope 1, 2, and 3 emissions accurately?
To measure Scope 1, 2, and 3 emissions effectively, begin with gathering fuel and energy consumption data:
Scope 1: Collect data on direct fuel usage from company-owned vehicles, machinery, or other equipment.
Scope 2: Use utility bills or energy meter readings to track purchased electricity, steam, or heat.
Scope 3: Focus on emissions from upstream and downstream activities, such as transportation fuel use and supply chain operations. This may include emissions from suppliers, product distribution, and even employee commuting.
Accurate data collection is the foundation for understanding and managing your emissions footprint.
How can predictive analytics cut fuel use without disrupting schedules or customer commitments?
Predictive analytics is transforming how companies manage fuel consumption while keeping schedules intact. By leveraging weather forecasts and operational data, advanced models pinpoint more fuel-efficient routes without causing delays. These approaches allow for fine-tuned fuel adjustments that align with vessel operations, striking a balance between cutting fuel use, lowering emissions, and ensuring deliveries remain on time. Through the analysis of vessel performance and environmental factors, businesses can make smarter decisions that enhance both efficiency and dependability.
How do we use geospatial and climate risk data to plan workforce housing near ports?
Planning workforce housing near ports can benefit greatly from geospatial data. By examining the proximity of potential sites to existing housing, transportation networks, and potential hazards, planners can pinpoint accessible and practical locations. Incorporating climate risk data - such as projections for sea-level rise and flooding - adds another layer of insight, ensuring that housing developments are prepared to withstand future challenges. The integration of these datasets allows ports to position housing in locations that are convenient for workers while also minimizing exposure to climate-related risks.
Related Blog Posts
How to Integrate Climate Risk into Infrastructure Planning for Maritime & Logistics Companies
How to Design Coastal Resilience & Flood Mitigation for Maritime & Logistics Companies
How to Use Data to Inform Climate and Housing Policy for Municipalities & Government Agencies
How to Use Data to Inform Climate and Housing Policy for Corporations
Latest Articles
©2026

Narrative Change and Power Building: The Missing Half of Advocacy
Narrative change is the process of disrupting dominant narratives that normalize inequity and advancing new narratives from historically marginalized communities.

Funding Resilience Without Federal Grants
BRIC is unreliable and FEMA is shrinking. Here's how cities fund climate resilience with dedicated revenue, blended finance, and a coordinating authority.

The ESG Blind Spot: How AI Is Finding Risks in Companies Nobody Else Is Watching
Norway's sovereign wealth fund uses AI to screen 7,200 portfolio companies for forced labor and corruption within 24 hours. The real story is the emerging-market coverage gap that traditional ESG data vendors miss — and what it means for any company with a global supply chain.
Narrative Change and Power Building: The Missing Half of Advocacy
Narrative change is the process of disrupting dominant narratives that normalize inequity and advancing new narratives from historically marginalized communities.
Funding Resilience Without Federal Grants
BRIC is unreliable and FEMA is shrinking. Here's how cities fund climate resilience with dedicated revenue, blended finance, and a coordinating authority.
The ESG Blind Spot: How AI Is Finding Risks in Companies Nobody Else Is Watching
Norway's sovereign wealth fund uses AI to screen 7,200 portfolio companies for forced labor and corruption within 24 hours. The real story is the emerging-market coverage gap that traditional ESG data vendors miss — and what it means for any company with a global supply chain.
FAQ
01
What does it really mean to “redefine profit”?
02
What makes Council Fire different?
03
Who does Council Fire work with?
04
What does working with Council Fire actually look like?
05
How does Council Fire help organizations turn big goals into action?
06
How does Council Fire define and measure success?
07
How does technology fit into Council Fire’s work?
Apr 21, 2026
How to Use Data to Inform Climate and Housing Policy for Maritime & Logistics Companies
Sustainability Strategy
In This Article
Leverage emissions, geospatial, and workforce data to cut port emissions, forecast housing needs, and shape resilient policy.
How to Use Data to Inform Climate and Housing Policy for Maritime & Logistics Companies
Maritime and logistics companies face two major challenges: reducing emissions and addressing workforce housing shortages. Data is the key to tackling both. By analyzing emissions and housing data, companies can optimize operations, predict future needs, and shape policies that improve efficiency and employee well-being.
Key Points:
Global shipping contributes 940 million tons of CO₂ annually, with emissions potentially rising by 130% by 2050.
Workforce housing shortages in port cities increase commute times, emissions, and productivity issues.
Companies like KMTC saved $540,000 annually using digital tools for fuel efficiency.
Predictive analytics can optimize routes, reduce emissions, and improve housing strategies.
Tools like geospatial mapping and climate risk data help forecast housing needs and mitigate risks.
Takeaway:
By leveraging emissions tracking, predictive analytics, and workforce data, maritime companies can align climate goals with housing solutions, benefiting both operations and communities.
Maritime Industry Climate and Housing Data: Key Statistics for Policy Development
The importance of data quality in the era of ETS and FuelEU Maritime
Step 1: Gather the Right Data
To craft meaningful policies, focus on two critical data categories: emissions/environmental metrics and workforce/housing data. These datasets are essential for driving sustainable changes in climate and workforce housing policies. For maritime and logistics companies, this means tracking your carbon footprint alongside understanding housing challenges faced by employees.
Emissions and Environmental Data
Start by collecting primary data, such as fuel and energy consumption from telematics systems or fueling records. This approach provides accurate, real-world insights rather than relying on generalized industry averages. The focus should be on monitoring three key emission scopes:
Scope 1: Direct emissions from owned vessels and vehicles.
Scope 2: Indirect emissions from purchased electricity.
Scope 3: Emissions from your extended supply chain, which can account for over 70% of total greenhouse gas emissions in ocean shipping [5].
Specific operational metrics like distance traveled, cargo weight, fuel type (e.g., marine gas oil, LNG, biofuels), and engine specifications are vital. Following EPA guidelines, track pollutants relevant to mobile source sectors [3][8]. For ocean-going vessels, define transit mode as speeds exceeding 1 knot for precise inventory [3].
"Primary data is the linchpin for reliable emissions assessment, offering insights that drive decarbonization measures." - Shipzero [4]
Avoid treating GPS signals as primary emissions data. Instead, rely on activity-based calculations that use actual fuel consumption, weight, and distance data, steering clear of spend-based estimates [4][5]. Automate data collection by building API-based exchanges, ensuring emissions data flows seamlessly through multi-leg networks down to the shipment level [4].
Once emissions data is in place, shift your focus to workforce and housing challenges.
Workforce and Housing Demand Data
To complement emissions tracking, map housing and demographic patterns to understand workforce housing needs. Use geospatial mapping combined with demographic analysis to identify trends. High-resolution population datasets and federal port geometries can help pinpoint who lives near logistics hubs. A December 2024 US EPA report revealed that at least 31 million people reside within 3.1 miles (5,000 meters) of major US ports, with these populations often including higher shares of vulnerable groups compared to other areas [6].
"A key challenge of this work is the complexity of mapping and defining port operations geospatially." - US EPA [6]
Monitor workforce metrics such as crew retention, training completion rates, and productivity to spot housing-related stressors [7]. Incorporate data reporting requirements into terminal lease agreements to gather workforce information from tenants not directly under your port authority's control [2]. Collaborate with local universities and community groups to collect localized data on health, demographics, and air quality - factors that influence housing desirability and workforce stability [2]. Federal tools like Justice40 and EPA environmental justice guidelines can help identify vulnerable populations near your facilities [2][6].
Step 2: Use Predictive Analytics to Reduce Emissions
Once you've gathered baseline emissions and operational data, the next step is to apply predictive analytics. This approach can help cut fuel use, lower emissions, and improve overall efficiency. With global shipping responsible for 3% of worldwide greenhouse gas emissions [12], optimizing operations is essential to meet regulatory standards and lessen environmental impact.
Optimize Shipping Operations
Predictive models are transforming how shipping routes, speeds, and maintenance schedules are determined by factoring in a variety of data points. Modern route optimization considers vessel specifications, fuel efficiency curves, weather conditions, port congestion, and regulatory costs, all aimed at reducing idle time and emissions [10].
"Route optimization in shipping goes far beyond picking the shortest line on a chart. It's the discipline of selecting the best voyage configuration... to improve voyage economics... while reducing fuel burn, delay risk, and regulatory cost exposure." - AXS Marine [10]
The benefits are both financial and environmental. For sub-Capesize vessels, adjusting speed by just 1 knot can alter fuel consumption by 4–5+ metric tons per day [10]. Over a 30-day optimized voyage, operators can save $21,000, with $12,000 attributed to time savings and $9,000 from a 5% reduction in fuel consumption [10].
A pilot program is a great way to begin. Start by implementing predictive analytics on a single vessel or trade lane to establish benchmarks for fuel use and idle times [10]. Port-call analytics can help pinpoint congestion patterns and berth efficiency, allowing you to avoid heavily congested ports that lead to unnecessary emissions [10]. Predictive maintenance tools, which analyze sensor data, can also identify wear and tear early, ensuring timely repairs and reducing downtime [11]. Additionally, monitoring hull and propeller conditions can indicate when cleaning is needed, as fouling significantly increases fuel consumption [1].
These operational improvements set the stage for testing more advanced decarbonization strategies using digital tools.
Plan Decarbonization Scenarios
Digital ship models, or digital twins, provide a virtual testing ground for decarbonization strategies. These tools simulate the effects of adjustments such as changing operating profiles, retrofitting vessels, or using biofuels, offering reliable data on emissions reductions [9]. For instance, adopting shore power (cold ironing) can cut carbon emissions from docked ships by 30% to 60%, while electrifying short-trip harbor vessels like tugs and pilot boats can reduce port greenhouse gas emissions by up to 25% [12].
Prescriptive analytics takes this a step further by not just predicting outcomes but recommending actionable steps to achieve net-zero emissions [11]. Solutions like OptiCARBON™ allow fleets to model scenarios and ensure compliance with regulations such as EU ETS, FuelEU Maritime, and the IMO GHG measures [9]. For example, a 10% efficiency improvement for a 37,000 DWT chemical tanker on intra-EU voyages could save €72,000 in emissions costs in 2025, increasing to €183,000 annually by 2030 [1].
To maximize these insights, embed routing and speed recommendations directly into your operational workflows [10]. Continuously comparing actual voyage performance against modeled predictions will help refine assumptions and improve results over time [10]. By leveraging these tools, shipping companies can navigate the path toward decarbonization while staying competitive.
Step 3: Forecast Housing Needs with Data
In addition to tackling emissions, maritime companies face the challenge of ensuring workforce housing near ports. The United States is grappling with a housing shortage of approximately 6 million units, with millennials bearing the brunt of the crisis [15]. For port cities, this issue is compounded by surging property prices and climate risks that threaten existing homes.
Data-driven forecasting helps identify housing shortages and assess climate-related risks. By examining workforce distribution, migration trends, and environmental challenges, maritime employers can push for housing solutions that address both business goals and employee welfare. Much like emissions strategies, using data to predict housing needs allows companies to influence policies that benefit workers and communities alike.
Map Workforce and Housing Locations
Geospatial analysis is a powerful tool for identifying workforce housing needs. Federal datasets provide critical insights into the demographics and housing conditions of communities near ports.
Tools such as the Strong Foundations playbook offer detailed data on housing supply, affordability, migration, and job growth trends across hundreds of metropolitan areas [15]. Additionally, Python libraries like geopandas enable analysis of census tract-level data, allowing companies to map workforce locations in relation to port infrastructure and undeveloped land [14]. This kind of mapping highlights gaps where job growth outpaces housing development, giving business leaders the information they need to advocate for zoning changes and flexible lot sizes.
"The needs of employees and the needs of employers, in this case, are lining up in the same direction." – Arthur Gailes, Research Fellow, American Enterprise Institute [15]
Armed with these analyses, business leaders can make a strong case at city council meetings, demonstrating how increasing housing density near job centers benefits workers and boosts local tax revenue.
Build Climate Resilience into Housing Plans
Once workforce distribution is mapped, factoring in climate resilience ensures housing strategies remain viable in the long term. Ignoring climate risks when forecasting housing demand can leave companies exposed to disruptions. Coastal counties, home to around 128 million Americans - or 40% of the U.S. population - are especially vulnerable [14]. Sea levels along the U.S. coastline are expected to rise by 1.3–2 feet by 2050, with high-tide flooding events projected to increase from three per year in 2020 to over ten per year by 2050 [14].
Identifying "Emerging Risk Regions" is a key aspect of planning. Approximately 3,500 census tracts along the U.S. coastline - currently outside FEMA's high-risk zones - are predicted to experience at least 1 foot of sea-level rise by 2050 [14]. As Riddhisha Prabhu from Towards Data Science notes:
"Emerging Medium Term Risk census tracts should be considered high risk" [14]
Adopting a cautious approach to property valuations and development in these areas is essential.
Tools like Climate Central’s Ocean at the Door Map help assess housing vulnerabilities by comparing land elevation with sea-level rise projections and annual flood data [16]. Without proper adaptation measures, coastal regions could face up to $146 billion in annual property losses by 2090, and six feet of sea-level rise could leave 31 million Americans without wastewater services [17].
Incorporating climate data into housing forecasts enables companies to prioritize development in safer areas while advocating for infrastructure upgrades in existing neighborhoods. This might include elevated utilities or green infrastructure like rain gardens. These steps help shape policies that balance operational priorities with sustainable workforce housing solutions.
Step 4: Build Data into Policy Frameworks
After gathering data and applying predictive analytics, the next step is to translate these insights into actionable policies that drive progress in climate and housing innovation. Maritime operations are deeply connected to inland logistics, energy networks, and urban housing markets. Effective policies must reflect these interdependencies, ensuring that technical insights are seamlessly integrated into practical, cross-sector solutions.
Apply Systems Thinking to Policy Development
Sustainability in any sector demands a broad perspective. Ports, for example, are not isolated entities - they are part of a larger network that includes rail systems, warehouses, energy grids, and the communities supporting the workforce [20]. A systems-based approach views these components as interconnected layers, rather than standalone projects.
A materiality assessment can help identify the most pressing ESG concerns. For maritime companies, this often includes greenhouse gas emissions, crew welfare, and relationships with local communities [18][19]. In fact, 78% of organizations are moving toward unified environmental risk frameworks that address these issues together [18][19]. This means that climate policies must account for how decarbonization efforts impact workforce housing, and vice versa.
Legislative examples demonstrate how tools like GIS can enhance policy-making by spatially mapping environmental and housing challenges. Maritime companies can leverage GIS to combine spatial data - like flood zones or sensitive habitats - with statistical models. This creates adaptive policies that respond to evolving environmental conditions [21].
"By integrating spatial data with statistical and predictive models, policymakers craft strategies backed by real-time evidence and rigorous analysis." – Sarah Lee, GIS in Environmental Policy [21]
For instance, if a housing strategy involves coastal development, it’s crucial to have contingency plans for inland workforce housing in case sea-level rise accelerates beyond current projections.
Engage Stakeholders for Policy Success
While systems-based policy design lays the groundwork, stakeholder engagement is essential for validating and implementing these frameworks. By involving both local communities and operational stakeholders, policies can effectively bridge the gap between data-driven insights and meaningful, on-the-ground improvements. Transparency fosters trust, and public-facing dashboards that track metrics like emissions reductions, housing developments, and climate resilience can empower stakeholders to monitor progress [22]. The European Union's INSPIRE Geoportal exemplifies this approach by offering a centralized platform where governments, businesses, and communities can access shared spatial data for environmental and land-use planning [21].
Interactive mapping tools, such as Web GIS platforms like ArcGIS Online, allow stakeholders to visualize proposed land-use changes and provide informed feedback [21]. For example, when advocating for zoning adjustments or increased housing density near ports, these tools help city councils and community members understand how workforce distribution aligns with housing supply gaps. Establishing formal data-sharing agreements, like MOUs between government entities and private partners, can also streamline collaboration [22]. Many perceived legal barriers to data exchange can be addressed with clear guidelines on confidentiality and data protection [22].
To ensure policies are equitable, disaggregate data by race, ethnicity, gender, and income [22]. Collaborate with local communities to gather qualitative insights. While quantitative data on emissions and housing units is critical, engaging with people who have lived experience ensures that policies are relevant and address actual needs [22]. Between 2010 and 2017, homelessness in the U.S. decreased by 14% after adopting evidence-based practices that incorporated community input [22].
"Collection, analysis, and reporting of quality, timely qualitative and quantitative data is essential for targeting interventions, tracking results, making strategic decisions, and allocating resources at the federal, state, and local levels." – United States Interagency Council on Homelessness [22]
Step 5: Monitor and Evaluate Policy Results
Once a policy is in place, it’s essential to keep a close eye on how it performs. This means setting clear performance indicators and leveraging real-time data to make adjustments as needed. Monitoring isn't just a formality - it's how you ensure that strategies remain effective and responsive to new challenges. Without consistent evaluation, even the most carefully crafted policies can veer off track. These indicators are the foundation for assessing whether environmental and housing goals are being met.
Track Emissions and Housing Metrics
Start with a detailed emissions inventory that includes Scope 1, 2, and 3 emissions from vessels, harbor craft, handling equipment, and trucks [5][2]. Pay particular attention to Scope 3 emissions, as they often highlight the most impactful reduction opportunities. The International Maritime Organization has set a goal to cut greenhouse gas emissions by 30% by 2030, using 2008 levels as the baseline [2].
"By accurately measuring Scope 3 emissions, shipping companies can identify key areas for reduction, optimize fuel efficiency, and ensure compliance with emissions reporting standards." – Hamid Nouasria, Dockflow [5]
In addition to carbon dioxide, track air quality metrics like PM2.5, NOx, and NO2 in neighborhoods near ports [2]. Collaborating with local universities to install air quality monitors can help establish baseline data and build trust within the community. For instance, a single shore power installation at a busy berth can cut 1,000 to 3,000 tons of CO2e annually [2], making it vital to monitor how often shore power systems are being used. On the housing side, evaluate workforce distribution, the vulnerability of key assets to sea-level rise and storm surges, and the effectiveness of buffer zones separating industrial areas from residential communities [2][13].
Use Dashboards for Continuous Improvement
Real-time dashboards can turn static data into actionable insights. These tools eliminate the risk of "analysis paralysis" by allowing teams to evaluate complex datasets quickly [23]. They also create a shared space for logistics, supply chain, and sustainability teams to collaborate, enabling discussions about trade-offs like lead times versus emission reductions.
"Connecting departments, connecting different teams to have these types of conversations together that they were not able to have without this sort of visual appearance is really... a game changer." – Ruud van Dijk, Commercial Director, Routescanner [23]
Dashboards are particularly useful for running "what-if" scenarios, such as testing the impact of rerouting cargo to less polluting routes on costs and schedules [23]. Publishing air quality data openly can meet environmental justice requirements and demonstrate accountability to communities near ports [2]. If performance indicators fall short - such as receiving a 'D' or 'E' rating - document the corrective steps taken [24]. Programs like the EPA's Clean Ports Program, which offers $3 billion in funding for zero-emission equipment and infrastructure, often require detailed emissions tracking through dashboards to qualify for grants [2].
Conclusion
Maritime and logistics companies that view data as a strategic resource are better positioned to address challenges like climate change and workforce housing shortages. By leveraging predictive climate science, these companies can evaluate the risks of rare but impactful events, such as rising sea levels affecting coastal housing or extreme weather disrupting critical supply chains [26]. As Aon highlights:
"Risk managers need to move beyond a purely historical view of risk to adequately quantify the potential impacts of climate change" [26]
To meet ambitious environmental goals, such as the International Maritime Organization's 30% emissions reduction target by 2030, companies must refine local climate models and develop detailed emissions inventories [26][2]. Federal initiatives like the EPA's $3 billion Clean Ports Program provide crucial funding for businesses that document emissions and demonstrate measurable improvements [2].
Collaboration among stakeholders is essential. Fuel suppliers, shipping companies, and community advisory groups can work together to turn sustainability objectives into practical actions [25]. For instance, the City of Birmingham is using energy and climate data to support its net-zero pledge by 2030 [25]. Similarly, transparent air quality monitoring in neighborhoods near ports builds trust and addresses environmental justice concerns.
Ongoing monitoring ensures policies remain adaptable. Partnering with data experts to incorporate the latest research and transparent methodologies helps keep strategies aligned with shifting climate risks [26]. According to ICLEI:
"The importance of data-driven decision-making for climate action planning and implementation depends on the processes, methods and tools for data collection, as well as its management and interpretation" [25]
FAQs
What data should we collect first to measure Scope 1, 2, and 3 emissions accurately?
To measure Scope 1, 2, and 3 emissions effectively, begin with gathering fuel and energy consumption data:
Scope 1: Collect data on direct fuel usage from company-owned vehicles, machinery, or other equipment.
Scope 2: Use utility bills or energy meter readings to track purchased electricity, steam, or heat.
Scope 3: Focus on emissions from upstream and downstream activities, such as transportation fuel use and supply chain operations. This may include emissions from suppliers, product distribution, and even employee commuting.
Accurate data collection is the foundation for understanding and managing your emissions footprint.
How can predictive analytics cut fuel use without disrupting schedules or customer commitments?
Predictive analytics is transforming how companies manage fuel consumption while keeping schedules intact. By leveraging weather forecasts and operational data, advanced models pinpoint more fuel-efficient routes without causing delays. These approaches allow for fine-tuned fuel adjustments that align with vessel operations, striking a balance between cutting fuel use, lowering emissions, and ensuring deliveries remain on time. Through the analysis of vessel performance and environmental factors, businesses can make smarter decisions that enhance both efficiency and dependability.
How do we use geospatial and climate risk data to plan workforce housing near ports?
Planning workforce housing near ports can benefit greatly from geospatial data. By examining the proximity of potential sites to existing housing, transportation networks, and potential hazards, planners can pinpoint accessible and practical locations. Incorporating climate risk data - such as projections for sea-level rise and flooding - adds another layer of insight, ensuring that housing developments are prepared to withstand future challenges. The integration of these datasets allows ports to position housing in locations that are convenient for workers while also minimizing exposure to climate-related risks.
Related Blog Posts
How to Integrate Climate Risk into Infrastructure Planning for Maritime & Logistics Companies
How to Design Coastal Resilience & Flood Mitigation for Maritime & Logistics Companies
How to Use Data to Inform Climate and Housing Policy for Municipalities & Government Agencies
How to Use Data to Inform Climate and Housing Policy for Corporations
Latest Articles
©2026
Narrative Change and Power Building: The Missing Half of Advocacy
Narrative change is the process of disrupting dominant narratives that normalize inequity and advancing new narratives from historically marginalized communities.
Funding Resilience Without Federal Grants
BRIC is unreliable and FEMA is shrinking. Here's how cities fund climate resilience with dedicated revenue, blended finance, and a coordinating authority.
The ESG Blind Spot: How AI Is Finding Risks in Companies Nobody Else Is Watching
Norway's sovereign wealth fund uses AI to screen 7,200 portfolio companies for forced labor and corruption within 24 hours. The real story is the emerging-market coverage gap that traditional ESG data vendors miss — and what it means for any company with a global supply chain.
FAQ
01
What does it really mean to “redefine profit”?
02
What makes Council Fire different?
03
Who does Council Fire work with?
04
What does working with Council Fire actually look like?
05
How does Council Fire help organizations turn big goals into action?
06
How does Council Fire define and measure success?
07
How does technology fit into Council Fire’s work?
Apr 21, 2026
How to Use Data to Inform Climate and Housing Policy for Maritime & Logistics Companies
Sustainability Strategy
In This Article
Leverage emissions, geospatial, and workforce data to cut port emissions, forecast housing needs, and shape resilient policy.
How to Use Data to Inform Climate and Housing Policy for Maritime & Logistics Companies
Maritime and logistics companies face two major challenges: reducing emissions and addressing workforce housing shortages. Data is the key to tackling both. By analyzing emissions and housing data, companies can optimize operations, predict future needs, and shape policies that improve efficiency and employee well-being.
Key Points:
Global shipping contributes 940 million tons of CO₂ annually, with emissions potentially rising by 130% by 2050.
Workforce housing shortages in port cities increase commute times, emissions, and productivity issues.
Companies like KMTC saved $540,000 annually using digital tools for fuel efficiency.
Predictive analytics can optimize routes, reduce emissions, and improve housing strategies.
Tools like geospatial mapping and climate risk data help forecast housing needs and mitigate risks.
Takeaway:
By leveraging emissions tracking, predictive analytics, and workforce data, maritime companies can align climate goals with housing solutions, benefiting both operations and communities.
Maritime Industry Climate and Housing Data: Key Statistics for Policy Development
The importance of data quality in the era of ETS and FuelEU Maritime
Step 1: Gather the Right Data
To craft meaningful policies, focus on two critical data categories: emissions/environmental metrics and workforce/housing data. These datasets are essential for driving sustainable changes in climate and workforce housing policies. For maritime and logistics companies, this means tracking your carbon footprint alongside understanding housing challenges faced by employees.
Emissions and Environmental Data
Start by collecting primary data, such as fuel and energy consumption from telematics systems or fueling records. This approach provides accurate, real-world insights rather than relying on generalized industry averages. The focus should be on monitoring three key emission scopes:
Scope 1: Direct emissions from owned vessels and vehicles.
Scope 2: Indirect emissions from purchased electricity.
Scope 3: Emissions from your extended supply chain, which can account for over 70% of total greenhouse gas emissions in ocean shipping [5].
Specific operational metrics like distance traveled, cargo weight, fuel type (e.g., marine gas oil, LNG, biofuels), and engine specifications are vital. Following EPA guidelines, track pollutants relevant to mobile source sectors [3][8]. For ocean-going vessels, define transit mode as speeds exceeding 1 knot for precise inventory [3].
"Primary data is the linchpin for reliable emissions assessment, offering insights that drive decarbonization measures." - Shipzero [4]
Avoid treating GPS signals as primary emissions data. Instead, rely on activity-based calculations that use actual fuel consumption, weight, and distance data, steering clear of spend-based estimates [4][5]. Automate data collection by building API-based exchanges, ensuring emissions data flows seamlessly through multi-leg networks down to the shipment level [4].
Once emissions data is in place, shift your focus to workforce and housing challenges.
Workforce and Housing Demand Data
To complement emissions tracking, map housing and demographic patterns to understand workforce housing needs. Use geospatial mapping combined with demographic analysis to identify trends. High-resolution population datasets and federal port geometries can help pinpoint who lives near logistics hubs. A December 2024 US EPA report revealed that at least 31 million people reside within 3.1 miles (5,000 meters) of major US ports, with these populations often including higher shares of vulnerable groups compared to other areas [6].
"A key challenge of this work is the complexity of mapping and defining port operations geospatially." - US EPA [6]
Monitor workforce metrics such as crew retention, training completion rates, and productivity to spot housing-related stressors [7]. Incorporate data reporting requirements into terminal lease agreements to gather workforce information from tenants not directly under your port authority's control [2]. Collaborate with local universities and community groups to collect localized data on health, demographics, and air quality - factors that influence housing desirability and workforce stability [2]. Federal tools like Justice40 and EPA environmental justice guidelines can help identify vulnerable populations near your facilities [2][6].
Step 2: Use Predictive Analytics to Reduce Emissions
Once you've gathered baseline emissions and operational data, the next step is to apply predictive analytics. This approach can help cut fuel use, lower emissions, and improve overall efficiency. With global shipping responsible for 3% of worldwide greenhouse gas emissions [12], optimizing operations is essential to meet regulatory standards and lessen environmental impact.
Optimize Shipping Operations
Predictive models are transforming how shipping routes, speeds, and maintenance schedules are determined by factoring in a variety of data points. Modern route optimization considers vessel specifications, fuel efficiency curves, weather conditions, port congestion, and regulatory costs, all aimed at reducing idle time and emissions [10].
"Route optimization in shipping goes far beyond picking the shortest line on a chart. It's the discipline of selecting the best voyage configuration... to improve voyage economics... while reducing fuel burn, delay risk, and regulatory cost exposure." - AXS Marine [10]
The benefits are both financial and environmental. For sub-Capesize vessels, adjusting speed by just 1 knot can alter fuel consumption by 4–5+ metric tons per day [10]. Over a 30-day optimized voyage, operators can save $21,000, with $12,000 attributed to time savings and $9,000 from a 5% reduction in fuel consumption [10].
A pilot program is a great way to begin. Start by implementing predictive analytics on a single vessel or trade lane to establish benchmarks for fuel use and idle times [10]. Port-call analytics can help pinpoint congestion patterns and berth efficiency, allowing you to avoid heavily congested ports that lead to unnecessary emissions [10]. Predictive maintenance tools, which analyze sensor data, can also identify wear and tear early, ensuring timely repairs and reducing downtime [11]. Additionally, monitoring hull and propeller conditions can indicate when cleaning is needed, as fouling significantly increases fuel consumption [1].
These operational improvements set the stage for testing more advanced decarbonization strategies using digital tools.
Plan Decarbonization Scenarios
Digital ship models, or digital twins, provide a virtual testing ground for decarbonization strategies. These tools simulate the effects of adjustments such as changing operating profiles, retrofitting vessels, or using biofuels, offering reliable data on emissions reductions [9]. For instance, adopting shore power (cold ironing) can cut carbon emissions from docked ships by 30% to 60%, while electrifying short-trip harbor vessels like tugs and pilot boats can reduce port greenhouse gas emissions by up to 25% [12].
Prescriptive analytics takes this a step further by not just predicting outcomes but recommending actionable steps to achieve net-zero emissions [11]. Solutions like OptiCARBON™ allow fleets to model scenarios and ensure compliance with regulations such as EU ETS, FuelEU Maritime, and the IMO GHG measures [9]. For example, a 10% efficiency improvement for a 37,000 DWT chemical tanker on intra-EU voyages could save €72,000 in emissions costs in 2025, increasing to €183,000 annually by 2030 [1].
To maximize these insights, embed routing and speed recommendations directly into your operational workflows [10]. Continuously comparing actual voyage performance against modeled predictions will help refine assumptions and improve results over time [10]. By leveraging these tools, shipping companies can navigate the path toward decarbonization while staying competitive.
Step 3: Forecast Housing Needs with Data
In addition to tackling emissions, maritime companies face the challenge of ensuring workforce housing near ports. The United States is grappling with a housing shortage of approximately 6 million units, with millennials bearing the brunt of the crisis [15]. For port cities, this issue is compounded by surging property prices and climate risks that threaten existing homes.
Data-driven forecasting helps identify housing shortages and assess climate-related risks. By examining workforce distribution, migration trends, and environmental challenges, maritime employers can push for housing solutions that address both business goals and employee welfare. Much like emissions strategies, using data to predict housing needs allows companies to influence policies that benefit workers and communities alike.
Map Workforce and Housing Locations
Geospatial analysis is a powerful tool for identifying workforce housing needs. Federal datasets provide critical insights into the demographics and housing conditions of communities near ports.
Tools such as the Strong Foundations playbook offer detailed data on housing supply, affordability, migration, and job growth trends across hundreds of metropolitan areas [15]. Additionally, Python libraries like geopandas enable analysis of census tract-level data, allowing companies to map workforce locations in relation to port infrastructure and undeveloped land [14]. This kind of mapping highlights gaps where job growth outpaces housing development, giving business leaders the information they need to advocate for zoning changes and flexible lot sizes.
"The needs of employees and the needs of employers, in this case, are lining up in the same direction." – Arthur Gailes, Research Fellow, American Enterprise Institute [15]
Armed with these analyses, business leaders can make a strong case at city council meetings, demonstrating how increasing housing density near job centers benefits workers and boosts local tax revenue.
Build Climate Resilience into Housing Plans
Once workforce distribution is mapped, factoring in climate resilience ensures housing strategies remain viable in the long term. Ignoring climate risks when forecasting housing demand can leave companies exposed to disruptions. Coastal counties, home to around 128 million Americans - or 40% of the U.S. population - are especially vulnerable [14]. Sea levels along the U.S. coastline are expected to rise by 1.3–2 feet by 2050, with high-tide flooding events projected to increase from three per year in 2020 to over ten per year by 2050 [14].
Identifying "Emerging Risk Regions" is a key aspect of planning. Approximately 3,500 census tracts along the U.S. coastline - currently outside FEMA's high-risk zones - are predicted to experience at least 1 foot of sea-level rise by 2050 [14]. As Riddhisha Prabhu from Towards Data Science notes:
"Emerging Medium Term Risk census tracts should be considered high risk" [14]
Adopting a cautious approach to property valuations and development in these areas is essential.
Tools like Climate Central’s Ocean at the Door Map help assess housing vulnerabilities by comparing land elevation with sea-level rise projections and annual flood data [16]. Without proper adaptation measures, coastal regions could face up to $146 billion in annual property losses by 2090, and six feet of sea-level rise could leave 31 million Americans without wastewater services [17].
Incorporating climate data into housing forecasts enables companies to prioritize development in safer areas while advocating for infrastructure upgrades in existing neighborhoods. This might include elevated utilities or green infrastructure like rain gardens. These steps help shape policies that balance operational priorities with sustainable workforce housing solutions.
Step 4: Build Data into Policy Frameworks
After gathering data and applying predictive analytics, the next step is to translate these insights into actionable policies that drive progress in climate and housing innovation. Maritime operations are deeply connected to inland logistics, energy networks, and urban housing markets. Effective policies must reflect these interdependencies, ensuring that technical insights are seamlessly integrated into practical, cross-sector solutions.
Apply Systems Thinking to Policy Development
Sustainability in any sector demands a broad perspective. Ports, for example, are not isolated entities - they are part of a larger network that includes rail systems, warehouses, energy grids, and the communities supporting the workforce [20]. A systems-based approach views these components as interconnected layers, rather than standalone projects.
A materiality assessment can help identify the most pressing ESG concerns. For maritime companies, this often includes greenhouse gas emissions, crew welfare, and relationships with local communities [18][19]. In fact, 78% of organizations are moving toward unified environmental risk frameworks that address these issues together [18][19]. This means that climate policies must account for how decarbonization efforts impact workforce housing, and vice versa.
Legislative examples demonstrate how tools like GIS can enhance policy-making by spatially mapping environmental and housing challenges. Maritime companies can leverage GIS to combine spatial data - like flood zones or sensitive habitats - with statistical models. This creates adaptive policies that respond to evolving environmental conditions [21].
"By integrating spatial data with statistical and predictive models, policymakers craft strategies backed by real-time evidence and rigorous analysis." – Sarah Lee, GIS in Environmental Policy [21]
For instance, if a housing strategy involves coastal development, it’s crucial to have contingency plans for inland workforce housing in case sea-level rise accelerates beyond current projections.
Engage Stakeholders for Policy Success
While systems-based policy design lays the groundwork, stakeholder engagement is essential for validating and implementing these frameworks. By involving both local communities and operational stakeholders, policies can effectively bridge the gap between data-driven insights and meaningful, on-the-ground improvements. Transparency fosters trust, and public-facing dashboards that track metrics like emissions reductions, housing developments, and climate resilience can empower stakeholders to monitor progress [22]. The European Union's INSPIRE Geoportal exemplifies this approach by offering a centralized platform where governments, businesses, and communities can access shared spatial data for environmental and land-use planning [21].
Interactive mapping tools, such as Web GIS platforms like ArcGIS Online, allow stakeholders to visualize proposed land-use changes and provide informed feedback [21]. For example, when advocating for zoning adjustments or increased housing density near ports, these tools help city councils and community members understand how workforce distribution aligns with housing supply gaps. Establishing formal data-sharing agreements, like MOUs between government entities and private partners, can also streamline collaboration [22]. Many perceived legal barriers to data exchange can be addressed with clear guidelines on confidentiality and data protection [22].
To ensure policies are equitable, disaggregate data by race, ethnicity, gender, and income [22]. Collaborate with local communities to gather qualitative insights. While quantitative data on emissions and housing units is critical, engaging with people who have lived experience ensures that policies are relevant and address actual needs [22]. Between 2010 and 2017, homelessness in the U.S. decreased by 14% after adopting evidence-based practices that incorporated community input [22].
"Collection, analysis, and reporting of quality, timely qualitative and quantitative data is essential for targeting interventions, tracking results, making strategic decisions, and allocating resources at the federal, state, and local levels." – United States Interagency Council on Homelessness [22]
Step 5: Monitor and Evaluate Policy Results
Once a policy is in place, it’s essential to keep a close eye on how it performs. This means setting clear performance indicators and leveraging real-time data to make adjustments as needed. Monitoring isn't just a formality - it's how you ensure that strategies remain effective and responsive to new challenges. Without consistent evaluation, even the most carefully crafted policies can veer off track. These indicators are the foundation for assessing whether environmental and housing goals are being met.
Track Emissions and Housing Metrics
Start with a detailed emissions inventory that includes Scope 1, 2, and 3 emissions from vessels, harbor craft, handling equipment, and trucks [5][2]. Pay particular attention to Scope 3 emissions, as they often highlight the most impactful reduction opportunities. The International Maritime Organization has set a goal to cut greenhouse gas emissions by 30% by 2030, using 2008 levels as the baseline [2].
"By accurately measuring Scope 3 emissions, shipping companies can identify key areas for reduction, optimize fuel efficiency, and ensure compliance with emissions reporting standards." – Hamid Nouasria, Dockflow [5]
In addition to carbon dioxide, track air quality metrics like PM2.5, NOx, and NO2 in neighborhoods near ports [2]. Collaborating with local universities to install air quality monitors can help establish baseline data and build trust within the community. For instance, a single shore power installation at a busy berth can cut 1,000 to 3,000 tons of CO2e annually [2], making it vital to monitor how often shore power systems are being used. On the housing side, evaluate workforce distribution, the vulnerability of key assets to sea-level rise and storm surges, and the effectiveness of buffer zones separating industrial areas from residential communities [2][13].
Use Dashboards for Continuous Improvement
Real-time dashboards can turn static data into actionable insights. These tools eliminate the risk of "analysis paralysis" by allowing teams to evaluate complex datasets quickly [23]. They also create a shared space for logistics, supply chain, and sustainability teams to collaborate, enabling discussions about trade-offs like lead times versus emission reductions.
"Connecting departments, connecting different teams to have these types of conversations together that they were not able to have without this sort of visual appearance is really... a game changer." – Ruud van Dijk, Commercial Director, Routescanner [23]
Dashboards are particularly useful for running "what-if" scenarios, such as testing the impact of rerouting cargo to less polluting routes on costs and schedules [23]. Publishing air quality data openly can meet environmental justice requirements and demonstrate accountability to communities near ports [2]. If performance indicators fall short - such as receiving a 'D' or 'E' rating - document the corrective steps taken [24]. Programs like the EPA's Clean Ports Program, which offers $3 billion in funding for zero-emission equipment and infrastructure, often require detailed emissions tracking through dashboards to qualify for grants [2].
Conclusion
Maritime and logistics companies that view data as a strategic resource are better positioned to address challenges like climate change and workforce housing shortages. By leveraging predictive climate science, these companies can evaluate the risks of rare but impactful events, such as rising sea levels affecting coastal housing or extreme weather disrupting critical supply chains [26]. As Aon highlights:
"Risk managers need to move beyond a purely historical view of risk to adequately quantify the potential impacts of climate change" [26]
To meet ambitious environmental goals, such as the International Maritime Organization's 30% emissions reduction target by 2030, companies must refine local climate models and develop detailed emissions inventories [26][2]. Federal initiatives like the EPA's $3 billion Clean Ports Program provide crucial funding for businesses that document emissions and demonstrate measurable improvements [2].
Collaboration among stakeholders is essential. Fuel suppliers, shipping companies, and community advisory groups can work together to turn sustainability objectives into practical actions [25]. For instance, the City of Birmingham is using energy and climate data to support its net-zero pledge by 2030 [25]. Similarly, transparent air quality monitoring in neighborhoods near ports builds trust and addresses environmental justice concerns.
Ongoing monitoring ensures policies remain adaptable. Partnering with data experts to incorporate the latest research and transparent methodologies helps keep strategies aligned with shifting climate risks [26]. According to ICLEI:
"The importance of data-driven decision-making for climate action planning and implementation depends on the processes, methods and tools for data collection, as well as its management and interpretation" [25]
FAQs
What data should we collect first to measure Scope 1, 2, and 3 emissions accurately?
To measure Scope 1, 2, and 3 emissions effectively, begin with gathering fuel and energy consumption data:
Scope 1: Collect data on direct fuel usage from company-owned vehicles, machinery, or other equipment.
Scope 2: Use utility bills or energy meter readings to track purchased electricity, steam, or heat.
Scope 3: Focus on emissions from upstream and downstream activities, such as transportation fuel use and supply chain operations. This may include emissions from suppliers, product distribution, and even employee commuting.
Accurate data collection is the foundation for understanding and managing your emissions footprint.
How can predictive analytics cut fuel use without disrupting schedules or customer commitments?
Predictive analytics is transforming how companies manage fuel consumption while keeping schedules intact. By leveraging weather forecasts and operational data, advanced models pinpoint more fuel-efficient routes without causing delays. These approaches allow for fine-tuned fuel adjustments that align with vessel operations, striking a balance between cutting fuel use, lowering emissions, and ensuring deliveries remain on time. Through the analysis of vessel performance and environmental factors, businesses can make smarter decisions that enhance both efficiency and dependability.
How do we use geospatial and climate risk data to plan workforce housing near ports?
Planning workforce housing near ports can benefit greatly from geospatial data. By examining the proximity of potential sites to existing housing, transportation networks, and potential hazards, planners can pinpoint accessible and practical locations. Incorporating climate risk data - such as projections for sea-level rise and flooding - adds another layer of insight, ensuring that housing developments are prepared to withstand future challenges. The integration of these datasets allows ports to position housing in locations that are convenient for workers while also minimizing exposure to climate-related risks.
Related Blog Posts
How to Integrate Climate Risk into Infrastructure Planning for Maritime & Logistics Companies
How to Design Coastal Resilience & Flood Mitigation for Maritime & Logistics Companies
How to Use Data to Inform Climate and Housing Policy for Municipalities & Government Agencies
How to Use Data to Inform Climate and Housing Policy for Corporations
Latest Articles
©2026
Narrative Change and Power Building: The Missing Half of Advocacy
Narrative change is the process of disrupting dominant narratives that normalize inequity and advancing new narratives from historically marginalized communities.
Funding Resilience Without Federal Grants
BRIC is unreliable and FEMA is shrinking. Here's how cities fund climate resilience with dedicated revenue, blended finance, and a coordinating authority.
The ESG Blind Spot: How AI Is Finding Risks in Companies Nobody Else Is Watching
Norway's sovereign wealth fund uses AI to screen 7,200 portfolio companies for forced labor and corruption within 24 hours. The real story is the emerging-market coverage gap that traditional ESG data vendors miss — and what it means for any company with a global supply chain.
FAQ
What does it really mean to “redefine profit”?
What makes Council Fire different?
Who does Council Fire work with?
What does working with Council Fire actually look like?
How does Council Fire help organizations turn big goals into action?
How does Council Fire define and measure success?
How does technology fit into Council Fire’s work?