
Jul 26, 2026
Blended Finance Monitoring: Best Practices
ESG Strategy
In This Article
Track finance, energy, and climate/social KPIs from deal design; assign owners, verify data, fund monitoring, and link findings to decisions.
Blended Finance Monitoring: Best Practices
If I had to boil this down to one point, it’s this: blended finance monitoring only works when I track money, energy output, and climate/social results together from the start.
If I wait until after financial close, reporting turns into patchwork. The article makes that plain: I need a results framework before funds go out, a short list of shared KPIs, named data owners, fixed reporting cycles, outside checks, and clear rules for what happens when numbers miss target. It also shows that monitoring costs money - often 0.5% to 3% of project cost - and that this spend should sit in the project budget from day one.
Here’s the short version:
Set the framework early: define baselines, targets, and attribution before financial close.
Track three result types at once: financial, technical, and climate/social.
Assign ownership: every KPI needs one named party responsible for source data and reporting.
Match reporting to decisions: monthly plant data, quarterly finance data, annual impact data, and milestone reviews.
Check data quality: use range checks, reconciliations, portfolio reviews, audits, and third-party assurance.
Tie data to action: use thresholds for review when DSCR, generation, revenue, or social targets slip.
Use results across the portfolio: compare deals to adjust guarantees, grants, TA, and future capital mix.
What stayed with me most is that good monitoring is not just for compliance. It is how I see whether $200,000,000 in blended capital, a 3:1 leverage ratio, or a 200 MW solar target is turning into actual power, lower emissions, and better service on the ground.
That is the standard the article sets, and it is a useful one.
Build a Results Framework Before Financial Close
A results framework should be set up before financial close, while the deal structure is still taking shape. In blended finance, public, philanthropic, and private investors often come in with different goals. Those goals need to line up from day one across financial flows, commercial performance, and development results.[1][2] Once the framework is in place, the next move is plain but important: assign who collects data, how often reporting happens, and who checks that the numbers hold up.
Map Inputs, Outputs, Outcomes, and Impacts
For a blended renewable energy deal, the theory of change follows a clear chain.
Inputs are the capital instruments and support that get the project off the ground. That can include concessional loans, first-loss tranches, guarantees, grant-funded technical assistance, and policy support. In practice, one project might mix concessional capital, guarantees, grants, and commercial debt.
Outputs are the direct items you can count. Think megawatts of capacity installed, the number of distributed solar systems deployed, training sessions delivered to local operators, or policy products prepared and delivered.
Outcomes are the changes that come next. These include annual electricity generation in MWh, fewer grid outages, new household or business connections, and follow-on private investment drawn into the sector.[3][6]
Impacts are the longer-term results funders care about most: tCO₂e avoided each year, expanded electricity access, and better grid reliability. For example, the Clean Technology Fund reports annual GHG reductions of 42.3 million metric tons of CO₂e, with that figure expected to grow to 82 million metric tons of CO₂e as its portfolio matures.[11]
Put this chain into a one-page theory of change before disbursement. Quantitative targets should use U.S. number formatting, such as $250,000,000 and 450,000 MWh/year.
Choose Indicators That Balance Finance, Climate, and Social Results
Use a small core set of indicators across finance, climate, and social results. A project can hit its MW target and still miss the mark if it does not produce the expected MWh.[4][7]
Indicator Type | Example Indicators | Typical Data Sources | Strengths |
|---|---|---|---|
Financial | Total blended capital ($), private finance mobilized ($), leverage ratio, project IRR, DSCR, tariff revenue | Term sheets, financial close documents, audited accounts, investor reports | Precise and comparable across deals; familiar to private investors; supports risk management |
Climate – Technical | Installed capacity (MW), annual generation (MWh) | Metering systems, SCADA, EPC contracts | Directly tied to SDG 7; straightforward to verify |
Climate – Impact | tCO₂e avoided per year | Grid emissions factors, standardized MRV tools | Central to SDG 13 and NDC reporting |
Social | Households and businesses connected, service reliability improved, jobs created, share of jobs held by women | Project records, household surveys, payroll data | Reveals who benefits; essential for just transition claims by capital providers |
Set Baselines, Targets, and Attribution Rules Up Front
A target without a baseline does not tell you much. Before financial close, teams need to record the starting point for every core indicator, including current grid emissions intensity in tCO₂e/MWh, existing generation capacity, and household electricity access rates in the project area.[3][7] If baseline data is thin, use secondary sources like national energy plans, utility reports, and international databases, and mark estimates clearly.
Targets should come from engineering feasibility and financial modeling, not wishful thinking. A 200 MW solar project might reasonably target 450,000 MWh of annual generation and mobilization of $200 million in total capital, with a 3:1 leverage ratio of private to public finance.[5] Each target should link plainly to SDG 7 and SDG 13, and also match the country's nationally determined contribution (NDC), so project metrics can roll up into national commitments.[7][9][10]
When several funders share one deal, they should agree ahead of time on how credit gets assigned. That can be based on risk-sharing proportion, pro-rata finance share, or causal contribution. Geographic and time boundaries also need to be defined early so the results stay auditable.[7][2]
With the metrics agreed, monitoring can shift from design work to disciplined reporting.
Put Data Collection and Reporting on a Disciplined Schedule
Once the framework is in place, turn it into a working routine. That means naming owners, setting file formats, and fixing deadlines before the first disbursement. With the framework defined, the next job is simple in theory and often messy in practice: make ownership clear and set a reporting rhythm people can actually follow.
Assign Data Responsibilities Across the Capital Stack
Every core data point in a blended finance deal should have a named owner, and that owner should be written into the deal documents so the duty is enforceable, not left to guesswork.[12]
In practice, the work is split across the stack. SPVs collect source data. Operators keep O&M logs. Fund managers roll up portfolio results. Funders set disclosure rules. Lenders monitor covenants. Independent verifiers check and assure the numbers.[5][12][13]
A simple RACI matrix - Responsible, Accountable, Consulted, Informed - mapped to each main indicator helps stop two common problems: missing data and duplicate work. It also helps to pair that matrix with service-level agreements that spell out timing, completeness standards, and what happens when a submission is late or doesn’t line up with prior reports.
Once ownership is settled, deadlines should follow the decisions that data is meant to support.
Use Reporting Cycles That Match Operational and Investment Decisions
Reporting schedules should match decision points, not office habit. For U.S.-based renewable energy blended finance projects, a practical setup usually follows four reporting cycles:
Monthly operating data covers generation (MWh), plant availability, capacity factor, downtime, and key performance measures such as grid reliability or storage performance. SPVs often submit these reports 10–15 days after month-end so asset managers can spot technical trouble before it hits cash flow.[5]
Quarterly financial and covenant reporting covers income statements, balance sheets, cash flow statements prepared under U.S. GAAP, and covenant tests such as the Debt Service Coverage Ratio (DSCR). The timing should line up with investment committee meetings, where teams may need to decide on refinancing or corrective action.[14]
Annual impact reporting pulls together tCO₂e avoided, renewable electricity generated, households served, and jobs created. These reports are often issued within 90–120 days after fiscal year-end.[14]
Midterm and end-of-project evaluations are tied to major milestones, including refinancing windows, scale-up choices, or the planned exit of concessional capital. These usually happen around years two to three and again near project maturity.[12][13]
Without quality checks, even a tidy reporting calendar can turn into noise.
Strengthen Data Quality, Verification, and Transparency
Three controls do most of the heavy lifting here: preventive checks, portfolio-level anomaly detection, and independent assurance.
Preventive checks include automated range tests that catch impossible values, like negative generation or sudden jumps in capacity factor that don’t fit the operating profile. They should also include reconciliations between metered output and billed revenue. Portfolio-level anomaly detection means the fund manager reviews cross-asset trends to catch patterns that may look fine at one site but look off when compared with the full portfolio. Independent assurance adds another layer: annual financial audits by CPAs, periodic impact verification by specialist firms or NGOs, and environmental and social compliance audits.
Data Source | Responsible Party | Verification Method | Primary Use Case |
|---|---|---|---|
Metering systems (SCADA, smart meters) | SPV / project operator | Digital MRV, remote sensing | Energy generation KPIs, performance monitoring |
Audited financial statements | SPV / project sponsor | Independent audit (CPA firm) | Financial covenants, investor reporting |
Beneficiary surveys | NGOs / community groups | Third-party social audit | Household access, jobs, social inclusion |
GHG emissions calculations | Operator | Third-party assurance | Climate reporting, emissions reduction tracking |
Compliance and governance data | SPV / compliance team | Independent environmental and social review | Safeguards, regulatory compliance |
Disclosure rules should also draw a clean line between asset-level data shared with investors and aggregate impact metrics used for public reporting. That’s not just a reporting preference; it matters for trust across the capital stack. Convergence’s analysis finds that approximately 50% of blended finance transactions do not publicly disclose impact outcomes,[8] and that gap weakens market credibility. Annual reports should spell out methods, assumptions, and limits - not just publish totals.
Govern Monitoring Through Clear Roles, Budgets, and Decision Rules
Data only matters when someone owns the next move. After reporting cycles are in place, governance decides who reviews exceptions, who takes action, and how fast that happens. That’s what turns monitoring from a reporting exercise into a decision tool.
Define Oversight Roles for Funders, Investors, Operators, and Communities
Every blended finance deal should have a formal oversight body, usually a project steering committee or investment committee, with documented role descriptions written into term sheets, shareholder agreements, and the Environmental and Social Management System (ESMS).[1][15][17] The setup matters, but the split of responsibilities matters just as much.
Public funders and concessional providers set top-line impact goals and minimum reporting standards. Private investors track credit risk, financial performance, and covenant compliance. Operators run day-to-day work and carry out corrective actions. Communities give input on social performance through set channels such as community advisory panels, grievance redress systems, and periodic consultations.
The goal isn’t just to assign names to tasks. It’s to spell out what happens when results fall short. Use an amber threshold to trigger closer monitoring and a red threshold to trigger a formal exception review. When governance rules require community-derived data as a mandatory input to those reviews, projects can spot social risk sooner and respond before problems grow.
Budget for Monitoring as a Core Project Function
Monitoring should sit in the budget as its own capital and operating cost. As a general benchmark, full M&E can range from 0.5% to 3% of total project costs, depending on project complexity, the number of stakeholders involved, and verification requirements.[2][16]
Capital budgets cover metering and data systems. Operating budgets cover staff time, analysis, engagement, and verification. Larger multi-asset funds often add budget for portfolio-level analytics and third-party evaluators, such as engineering firms or independent impact verifiers, to confirm energy generation data, GHG calculations, and social outcomes.
That budget discipline matters. If contracts don’t tie funds to specific outputs, monitoring often gets pushed aside when costs tighten. Define deliverables up front, including:
Quarterly performance dashboards
Annual impact reports
Verification statements
Link Monitoring Findings to Risk Management and Investment Decisions
Monitoring data should flow straight into the investment committee and other decision forums. A monitoring governance plan should map the data path from source, whether that’s meters, financial systems, or community surveys, through validation and into committee review, with pre-agreed response options for common issues.
Flag assets when trailing 12-month DSCR headroom drops below 0.15x above covenant, then move the issue from an operating review to a financial review.[18] If generation is weak, start with the likely technical causes, such as resource variability, equipment faults, or grid curtailment, before treating it as a deeper structural issue. If revenue falls short, review tariff structures or PPA terms. If development targets are missed, such as local jobs or gender inclusion metrics, use that signal to revise community investment plans or shift impact-focused capital.
The table below shows how accountability should sit across stakeholder groups. It also makes clear what tends to break when no one owns the issue.
Stakeholder | Oversight Role | Controlled Data | Risk if Accountability Is Unclear |
|---|---|---|---|
Public Funder | Sets impact KPIs; provides first-loss capital | Impact metrics, subsidy usage, social KPIs | Over-subsidization; wasted public resources |
Private Investor | Monitors financial returns; assesses credit risk | Financial performance, DSCR, debt service | Moral hazard; insufficient project diligence |
Operator | Manages daily operations; owns data reporting | Energy output, O&M logs, safety incidents | Performance shortfalls; data gaps or manipulation |
Independent Verifier | Validates data quality and impact claims | Verified tCO₂e reductions, generation metrics | Greenwashing; loss of investor and public trust |
Community | Provides local support and context | Service reliability, grievance records, land use | Project delays; permitting failures; social opposition |
Decision rights and response options should be set in advance so monitoring can drive course correction while there’s still time to act. Those same decisions should also feed portfolio learning and shape future deal design.
Use Monitoring for Learning, Adaptive Management, and System-Level Impact
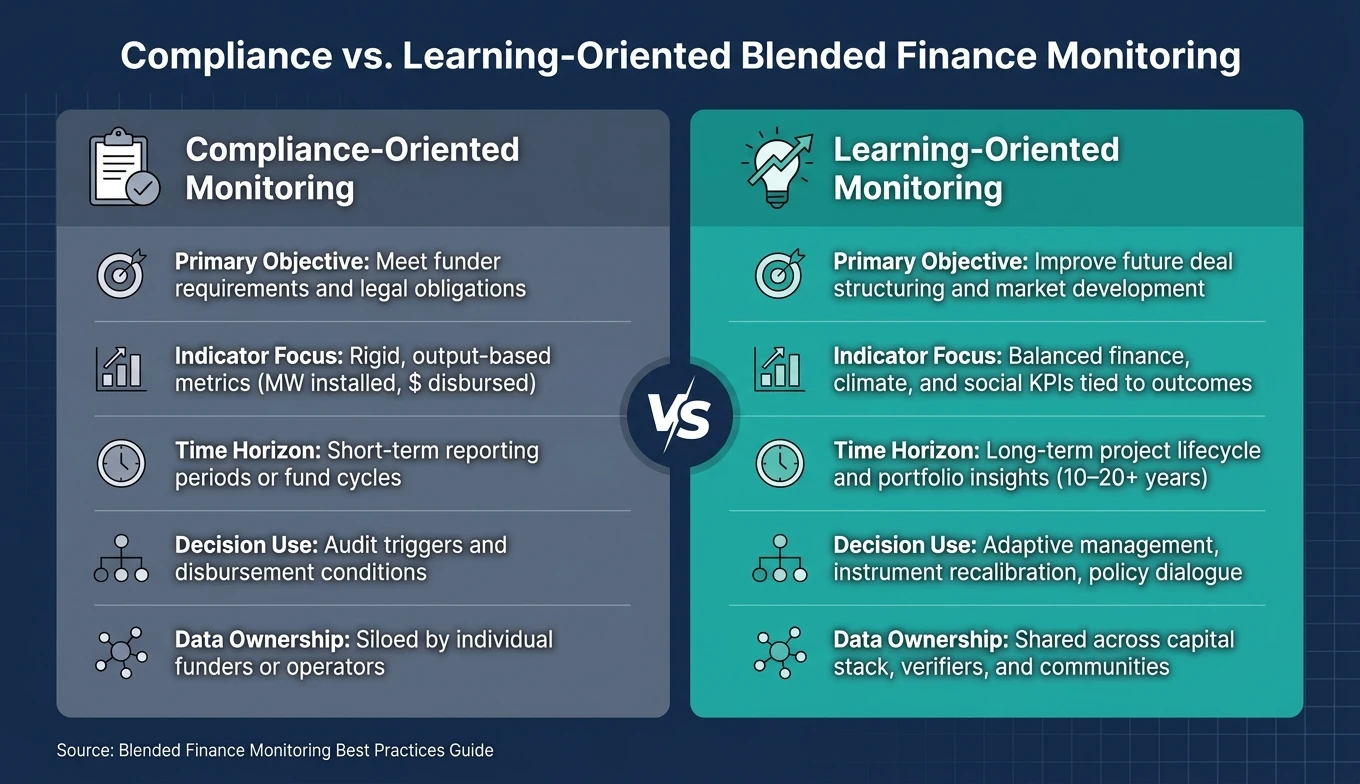
Compliance vs. Learning-Oriented Blended Finance Monitoring
Once monitoring is set up well, the next step is simple: use the data to make the next deal better, not just to describe the last one. That shift turns monitoring from a reporting exercise into a tool for portfolio design and smarter capital deployment.
Turn Project Data Into Portfolio and Market Insights
Project-level data starts to matter far more when it is standardized and pooled across a portfolio. For that to work, blended finance facilities need to collect the same core variables for every transaction: the type and dollar amount of concessional support, the grant-equivalent value, leverage ratios, capacity factor by technology type, WACC, DSCR, and local lender participation.
That kind of comparability makes patterns hard to miss. It shows which concessional tools - grants, guarantees, or subordinated debt - do the best job of bringing in local banks. It shows whether risk premiums fall in later deals, which points to actual market growth instead of a steady need for public subsidy. It also puts a dollar figure on system bottlenecks. If distributed solar projects across a portfolio keep running into multi-month interconnection delays, monitoring data can show the added financing cost in U.S. dollars and give decision-makers a clear case for streamlining interconnection rules.
Use a shared results structure so data can roll up across the portfolio. Then use those patterns to shape the next round of capital allocation and technical assistance.
Design Feedback Loops That Improve Future Transactions
Those findings should flow into annual decisions on structure, support, and incentives. Monitoring results need a formal place in scheduled review points, especially annual portfolio reviews, where the evidence is presented to investment committees and used to adjust instrument mix, technical assistance (TA) priorities, and developer support.
A few examples make the point:
If monitoring shows that guarantees bring in higher local lender participation at a lower concessional cost than grants, the facility should shift its capital stack in that direction.
If the data shows that early-stage distributed solar developers cannot reach financial close without more flexible capital, the answer is to add development-stage grants or convertible instruments.
If several projects show cost overruns tied to weak interconnection planning, TA resources should move toward utility coordination and grid integration engineering support.
Monitoring data should also directly shape how incentive levels are adjusted and tapered as markets mature.[19][20]
Conclusion: Key Practices That Make Monitoring Credible and Useful
Across this guide, the core practices come down to a short list of non-negotiables: define results before financial close, use a shared indicator set that covers finance, climate, and social outcomes, assign data ownership clearly across the capital stack, verify information through independent third parties, fund monitoring as a core project cost, and tie evidence to decisions through governance rules that require action, not just review.
The table below shows the difference between monitoring that checks a box for funders and monitoring that helps improve portfolio performance and market development.
Feature | Compliance-Oriented Monitoring | Learning-Oriented Monitoring |
|---|---|---|
Primary Objective | Meet funder requirements and legal obligations | Improve future deal structuring and market development |
Indicator Focus | Rigid, output-based metrics (MW installed, $ disbursed) | Balanced finance, climate, and social KPIs tied to outcomes |
Time Horizon | Short-term reporting periods or fund cycles | Long-term project lifecycle and portfolio insights (10–20+ years) |
Decision Use | Audit triggers and disbursement conditions | Adaptive management, instrument recalibration, policy dialogue |
Data Ownership | Siloed by individual funders or operators | Shared across the capital stack, verifiers, and communities |
Used with discipline, these practices make monitoring the mechanism that improves how blended finance structures are designed, priced, and deployed in future transactions.
FAQs
What is blended finance monitoring?
Blended finance monitoring is the structured process of tracking how a project performs, whether it meets its obligations, and what social or environmental impact it delivers when funding comes from a mix of public, philanthropic, and private capital.
It matters because it supports accountability, builds investor trust, and helps open the door to future funding. Strong monitoring starts before financial close with clear KPIs, baseline data, and set reporting schedules. That early setup helps make sure public funds are used only when needed and that the project stays on track with its sustainability goals.
Which KPIs matter most first?
Define KPIs, baselines, and reporting schedules before financial close so accountability and funding are built in from day one.
Start with the metrics most closely tied to the project’s main goals. That might mean energy production, emissions cuts, or climate resilience results. Keep the focus tight. If a metric doesn’t help show whether the project is doing what it promised, it probably doesn’t belong in the first set of KPIs.
Baselines matter just as much. You need a clear starting point before anyone can claim progress. Without that, reporting turns into guesswork, and funding conversations get messy fast.
Once the metrics and baselines are set, put them into contracts. That step makes expectations clear across every partner involved. It also gives project sponsors, lenders, and operators a shared scorecard, so performance isn’t left open to interpretation.
How much should monitoring cost?
Monitoring costs can swing quite a bit depending on how the project is set up and how demanding the reporting is. Environmental Impact Bonds are a good example. They can add about $800,000 in transaction costs because the monitoring process is more involved.
By contrast, projects using the Climate Bonds Standard come with lower entry costs. Fees start at $1,000 for developing nations and $2,000 for developed nations, plus 0.00001 of the bond issuance amount.
That price gap matters. Monitoring is not just a box to check for compliance. It supports accountability, gives investors clearer visibility, and can make future capital raises easier. Build those costs into your initial budget and your risk plan from the start.
Related Blog Posts
Latest Articles
©2026

Narrative Change and Power Building: The Missing Half of Advocacy
Narrative change is the process of disrupting dominant narratives that normalize inequity and advancing new narratives from historically marginalized communities.

Funding Resilience Without Federal Grants
BRIC is unreliable and FEMA is shrinking. Here's how cities fund climate resilience with dedicated revenue, blended finance, and a coordinating authority.

The ESG Blind Spot: How AI Is Finding Risks in Companies Nobody Else Is Watching
Norway's sovereign wealth fund uses AI to screen 7,200 portfolio companies for forced labor and corruption within 24 hours. The real story is the emerging-market coverage gap that traditional ESG data vendors miss — and what it means for any company with a global supply chain.
Narrative Change and Power Building: The Missing Half of Advocacy
Narrative change is the process of disrupting dominant narratives that normalize inequity and advancing new narratives from historically marginalized communities.
Funding Resilience Without Federal Grants
BRIC is unreliable and FEMA is shrinking. Here's how cities fund climate resilience with dedicated revenue, blended finance, and a coordinating authority.
The ESG Blind Spot: How AI Is Finding Risks in Companies Nobody Else Is Watching
Norway's sovereign wealth fund uses AI to screen 7,200 portfolio companies for forced labor and corruption within 24 hours. The real story is the emerging-market coverage gap that traditional ESG data vendors miss — and what it means for any company with a global supply chain.
FAQ
01
What does it really mean to “redefine profit”?
02
What makes Council Fire different?
03
Who does Council Fire work with?
04
What does working with Council Fire actually look like?
05
How does Council Fire help organizations turn big goals into action?
06
How does Council Fire define and measure success?
07
How does technology fit into Council Fire’s work?
Jul 26, 2026
Blended Finance Monitoring: Best Practices
ESG Strategy
In This Article
Track finance, energy, and climate/social KPIs from deal design; assign owners, verify data, fund monitoring, and link findings to decisions.
Blended Finance Monitoring: Best Practices
If I had to boil this down to one point, it’s this: blended finance monitoring only works when I track money, energy output, and climate/social results together from the start.
If I wait until after financial close, reporting turns into patchwork. The article makes that plain: I need a results framework before funds go out, a short list of shared KPIs, named data owners, fixed reporting cycles, outside checks, and clear rules for what happens when numbers miss target. It also shows that monitoring costs money - often 0.5% to 3% of project cost - and that this spend should sit in the project budget from day one.
Here’s the short version:
Set the framework early: define baselines, targets, and attribution before financial close.
Track three result types at once: financial, technical, and climate/social.
Assign ownership: every KPI needs one named party responsible for source data and reporting.
Match reporting to decisions: monthly plant data, quarterly finance data, annual impact data, and milestone reviews.
Check data quality: use range checks, reconciliations, portfolio reviews, audits, and third-party assurance.
Tie data to action: use thresholds for review when DSCR, generation, revenue, or social targets slip.
Use results across the portfolio: compare deals to adjust guarantees, grants, TA, and future capital mix.
What stayed with me most is that good monitoring is not just for compliance. It is how I see whether $200,000,000 in blended capital, a 3:1 leverage ratio, or a 200 MW solar target is turning into actual power, lower emissions, and better service on the ground.
That is the standard the article sets, and it is a useful one.
Build a Results Framework Before Financial Close
A results framework should be set up before financial close, while the deal structure is still taking shape. In blended finance, public, philanthropic, and private investors often come in with different goals. Those goals need to line up from day one across financial flows, commercial performance, and development results.[1][2] Once the framework is in place, the next move is plain but important: assign who collects data, how often reporting happens, and who checks that the numbers hold up.
Map Inputs, Outputs, Outcomes, and Impacts
For a blended renewable energy deal, the theory of change follows a clear chain.
Inputs are the capital instruments and support that get the project off the ground. That can include concessional loans, first-loss tranches, guarantees, grant-funded technical assistance, and policy support. In practice, one project might mix concessional capital, guarantees, grants, and commercial debt.
Outputs are the direct items you can count. Think megawatts of capacity installed, the number of distributed solar systems deployed, training sessions delivered to local operators, or policy products prepared and delivered.
Outcomes are the changes that come next. These include annual electricity generation in MWh, fewer grid outages, new household or business connections, and follow-on private investment drawn into the sector.[3][6]
Impacts are the longer-term results funders care about most: tCO₂e avoided each year, expanded electricity access, and better grid reliability. For example, the Clean Technology Fund reports annual GHG reductions of 42.3 million metric tons of CO₂e, with that figure expected to grow to 82 million metric tons of CO₂e as its portfolio matures.[11]
Put this chain into a one-page theory of change before disbursement. Quantitative targets should use U.S. number formatting, such as $250,000,000 and 450,000 MWh/year.
Choose Indicators That Balance Finance, Climate, and Social Results
Use a small core set of indicators across finance, climate, and social results. A project can hit its MW target and still miss the mark if it does not produce the expected MWh.[4][7]
Indicator Type | Example Indicators | Typical Data Sources | Strengths |
|---|---|---|---|
Financial | Total blended capital ($), private finance mobilized ($), leverage ratio, project IRR, DSCR, tariff revenue | Term sheets, financial close documents, audited accounts, investor reports | Precise and comparable across deals; familiar to private investors; supports risk management |
Climate – Technical | Installed capacity (MW), annual generation (MWh) | Metering systems, SCADA, EPC contracts | Directly tied to SDG 7; straightforward to verify |
Climate – Impact | tCO₂e avoided per year | Grid emissions factors, standardized MRV tools | Central to SDG 13 and NDC reporting |
Social | Households and businesses connected, service reliability improved, jobs created, share of jobs held by women | Project records, household surveys, payroll data | Reveals who benefits; essential for just transition claims by capital providers |
Set Baselines, Targets, and Attribution Rules Up Front
A target without a baseline does not tell you much. Before financial close, teams need to record the starting point for every core indicator, including current grid emissions intensity in tCO₂e/MWh, existing generation capacity, and household electricity access rates in the project area.[3][7] If baseline data is thin, use secondary sources like national energy plans, utility reports, and international databases, and mark estimates clearly.
Targets should come from engineering feasibility and financial modeling, not wishful thinking. A 200 MW solar project might reasonably target 450,000 MWh of annual generation and mobilization of $200 million in total capital, with a 3:1 leverage ratio of private to public finance.[5] Each target should link plainly to SDG 7 and SDG 13, and also match the country's nationally determined contribution (NDC), so project metrics can roll up into national commitments.[7][9][10]
When several funders share one deal, they should agree ahead of time on how credit gets assigned. That can be based on risk-sharing proportion, pro-rata finance share, or causal contribution. Geographic and time boundaries also need to be defined early so the results stay auditable.[7][2]
With the metrics agreed, monitoring can shift from design work to disciplined reporting.
Put Data Collection and Reporting on a Disciplined Schedule
Once the framework is in place, turn it into a working routine. That means naming owners, setting file formats, and fixing deadlines before the first disbursement. With the framework defined, the next job is simple in theory and often messy in practice: make ownership clear and set a reporting rhythm people can actually follow.
Assign Data Responsibilities Across the Capital Stack
Every core data point in a blended finance deal should have a named owner, and that owner should be written into the deal documents so the duty is enforceable, not left to guesswork.[12]
In practice, the work is split across the stack. SPVs collect source data. Operators keep O&M logs. Fund managers roll up portfolio results. Funders set disclosure rules. Lenders monitor covenants. Independent verifiers check and assure the numbers.[5][12][13]
A simple RACI matrix - Responsible, Accountable, Consulted, Informed - mapped to each main indicator helps stop two common problems: missing data and duplicate work. It also helps to pair that matrix with service-level agreements that spell out timing, completeness standards, and what happens when a submission is late or doesn’t line up with prior reports.
Once ownership is settled, deadlines should follow the decisions that data is meant to support.
Use Reporting Cycles That Match Operational and Investment Decisions
Reporting schedules should match decision points, not office habit. For U.S.-based renewable energy blended finance projects, a practical setup usually follows four reporting cycles:
Monthly operating data covers generation (MWh), plant availability, capacity factor, downtime, and key performance measures such as grid reliability or storage performance. SPVs often submit these reports 10–15 days after month-end so asset managers can spot technical trouble before it hits cash flow.[5]
Quarterly financial and covenant reporting covers income statements, balance sheets, cash flow statements prepared under U.S. GAAP, and covenant tests such as the Debt Service Coverage Ratio (DSCR). The timing should line up with investment committee meetings, where teams may need to decide on refinancing or corrective action.[14]
Annual impact reporting pulls together tCO₂e avoided, renewable electricity generated, households served, and jobs created. These reports are often issued within 90–120 days after fiscal year-end.[14]
Midterm and end-of-project evaluations are tied to major milestones, including refinancing windows, scale-up choices, or the planned exit of concessional capital. These usually happen around years two to three and again near project maturity.[12][13]
Without quality checks, even a tidy reporting calendar can turn into noise.
Strengthen Data Quality, Verification, and Transparency
Three controls do most of the heavy lifting here: preventive checks, portfolio-level anomaly detection, and independent assurance.
Preventive checks include automated range tests that catch impossible values, like negative generation or sudden jumps in capacity factor that don’t fit the operating profile. They should also include reconciliations between metered output and billed revenue. Portfolio-level anomaly detection means the fund manager reviews cross-asset trends to catch patterns that may look fine at one site but look off when compared with the full portfolio. Independent assurance adds another layer: annual financial audits by CPAs, periodic impact verification by specialist firms or NGOs, and environmental and social compliance audits.
Data Source | Responsible Party | Verification Method | Primary Use Case |
|---|---|---|---|
Metering systems (SCADA, smart meters) | SPV / project operator | Digital MRV, remote sensing | Energy generation KPIs, performance monitoring |
Audited financial statements | SPV / project sponsor | Independent audit (CPA firm) | Financial covenants, investor reporting |
Beneficiary surveys | NGOs / community groups | Third-party social audit | Household access, jobs, social inclusion |
GHG emissions calculations | Operator | Third-party assurance | Climate reporting, emissions reduction tracking |
Compliance and governance data | SPV / compliance team | Independent environmental and social review | Safeguards, regulatory compliance |
Disclosure rules should also draw a clean line between asset-level data shared with investors and aggregate impact metrics used for public reporting. That’s not just a reporting preference; it matters for trust across the capital stack. Convergence’s analysis finds that approximately 50% of blended finance transactions do not publicly disclose impact outcomes,[8] and that gap weakens market credibility. Annual reports should spell out methods, assumptions, and limits - not just publish totals.
Govern Monitoring Through Clear Roles, Budgets, and Decision Rules
Data only matters when someone owns the next move. After reporting cycles are in place, governance decides who reviews exceptions, who takes action, and how fast that happens. That’s what turns monitoring from a reporting exercise into a decision tool.
Define Oversight Roles for Funders, Investors, Operators, and Communities
Every blended finance deal should have a formal oversight body, usually a project steering committee or investment committee, with documented role descriptions written into term sheets, shareholder agreements, and the Environmental and Social Management System (ESMS).[1][15][17] The setup matters, but the split of responsibilities matters just as much.
Public funders and concessional providers set top-line impact goals and minimum reporting standards. Private investors track credit risk, financial performance, and covenant compliance. Operators run day-to-day work and carry out corrective actions. Communities give input on social performance through set channels such as community advisory panels, grievance redress systems, and periodic consultations.
The goal isn’t just to assign names to tasks. It’s to spell out what happens when results fall short. Use an amber threshold to trigger closer monitoring and a red threshold to trigger a formal exception review. When governance rules require community-derived data as a mandatory input to those reviews, projects can spot social risk sooner and respond before problems grow.
Budget for Monitoring as a Core Project Function
Monitoring should sit in the budget as its own capital and operating cost. As a general benchmark, full M&E can range from 0.5% to 3% of total project costs, depending on project complexity, the number of stakeholders involved, and verification requirements.[2][16]
Capital budgets cover metering and data systems. Operating budgets cover staff time, analysis, engagement, and verification. Larger multi-asset funds often add budget for portfolio-level analytics and third-party evaluators, such as engineering firms or independent impact verifiers, to confirm energy generation data, GHG calculations, and social outcomes.
That budget discipline matters. If contracts don’t tie funds to specific outputs, monitoring often gets pushed aside when costs tighten. Define deliverables up front, including:
Quarterly performance dashboards
Annual impact reports
Verification statements
Link Monitoring Findings to Risk Management and Investment Decisions
Monitoring data should flow straight into the investment committee and other decision forums. A monitoring governance plan should map the data path from source, whether that’s meters, financial systems, or community surveys, through validation and into committee review, with pre-agreed response options for common issues.
Flag assets when trailing 12-month DSCR headroom drops below 0.15x above covenant, then move the issue from an operating review to a financial review.[18] If generation is weak, start with the likely technical causes, such as resource variability, equipment faults, or grid curtailment, before treating it as a deeper structural issue. If revenue falls short, review tariff structures or PPA terms. If development targets are missed, such as local jobs or gender inclusion metrics, use that signal to revise community investment plans or shift impact-focused capital.
The table below shows how accountability should sit across stakeholder groups. It also makes clear what tends to break when no one owns the issue.
Stakeholder | Oversight Role | Controlled Data | Risk if Accountability Is Unclear |
|---|---|---|---|
Public Funder | Sets impact KPIs; provides first-loss capital | Impact metrics, subsidy usage, social KPIs | Over-subsidization; wasted public resources |
Private Investor | Monitors financial returns; assesses credit risk | Financial performance, DSCR, debt service | Moral hazard; insufficient project diligence |
Operator | Manages daily operations; owns data reporting | Energy output, O&M logs, safety incidents | Performance shortfalls; data gaps or manipulation |
Independent Verifier | Validates data quality and impact claims | Verified tCO₂e reductions, generation metrics | Greenwashing; loss of investor and public trust |
Community | Provides local support and context | Service reliability, grievance records, land use | Project delays; permitting failures; social opposition |
Decision rights and response options should be set in advance so monitoring can drive course correction while there’s still time to act. Those same decisions should also feed portfolio learning and shape future deal design.
Use Monitoring for Learning, Adaptive Management, and System-Level Impact
Compliance vs. Learning-Oriented Blended Finance Monitoring
Once monitoring is set up well, the next step is simple: use the data to make the next deal better, not just to describe the last one. That shift turns monitoring from a reporting exercise into a tool for portfolio design and smarter capital deployment.
Turn Project Data Into Portfolio and Market Insights
Project-level data starts to matter far more when it is standardized and pooled across a portfolio. For that to work, blended finance facilities need to collect the same core variables for every transaction: the type and dollar amount of concessional support, the grant-equivalent value, leverage ratios, capacity factor by technology type, WACC, DSCR, and local lender participation.
That kind of comparability makes patterns hard to miss. It shows which concessional tools - grants, guarantees, or subordinated debt - do the best job of bringing in local banks. It shows whether risk premiums fall in later deals, which points to actual market growth instead of a steady need for public subsidy. It also puts a dollar figure on system bottlenecks. If distributed solar projects across a portfolio keep running into multi-month interconnection delays, monitoring data can show the added financing cost in U.S. dollars and give decision-makers a clear case for streamlining interconnection rules.
Use a shared results structure so data can roll up across the portfolio. Then use those patterns to shape the next round of capital allocation and technical assistance.
Design Feedback Loops That Improve Future Transactions
Those findings should flow into annual decisions on structure, support, and incentives. Monitoring results need a formal place in scheduled review points, especially annual portfolio reviews, where the evidence is presented to investment committees and used to adjust instrument mix, technical assistance (TA) priorities, and developer support.
A few examples make the point:
If monitoring shows that guarantees bring in higher local lender participation at a lower concessional cost than grants, the facility should shift its capital stack in that direction.
If the data shows that early-stage distributed solar developers cannot reach financial close without more flexible capital, the answer is to add development-stage grants or convertible instruments.
If several projects show cost overruns tied to weak interconnection planning, TA resources should move toward utility coordination and grid integration engineering support.
Monitoring data should also directly shape how incentive levels are adjusted and tapered as markets mature.[19][20]
Conclusion: Key Practices That Make Monitoring Credible and Useful
Across this guide, the core practices come down to a short list of non-negotiables: define results before financial close, use a shared indicator set that covers finance, climate, and social outcomes, assign data ownership clearly across the capital stack, verify information through independent third parties, fund monitoring as a core project cost, and tie evidence to decisions through governance rules that require action, not just review.
The table below shows the difference between monitoring that checks a box for funders and monitoring that helps improve portfolio performance and market development.
Feature | Compliance-Oriented Monitoring | Learning-Oriented Monitoring |
|---|---|---|
Primary Objective | Meet funder requirements and legal obligations | Improve future deal structuring and market development |
Indicator Focus | Rigid, output-based metrics (MW installed, $ disbursed) | Balanced finance, climate, and social KPIs tied to outcomes |
Time Horizon | Short-term reporting periods or fund cycles | Long-term project lifecycle and portfolio insights (10–20+ years) |
Decision Use | Audit triggers and disbursement conditions | Adaptive management, instrument recalibration, policy dialogue |
Data Ownership | Siloed by individual funders or operators | Shared across the capital stack, verifiers, and communities |
Used with discipline, these practices make monitoring the mechanism that improves how blended finance structures are designed, priced, and deployed in future transactions.
FAQs
What is blended finance monitoring?
Blended finance monitoring is the structured process of tracking how a project performs, whether it meets its obligations, and what social or environmental impact it delivers when funding comes from a mix of public, philanthropic, and private capital.
It matters because it supports accountability, builds investor trust, and helps open the door to future funding. Strong monitoring starts before financial close with clear KPIs, baseline data, and set reporting schedules. That early setup helps make sure public funds are used only when needed and that the project stays on track with its sustainability goals.
Which KPIs matter most first?
Define KPIs, baselines, and reporting schedules before financial close so accountability and funding are built in from day one.
Start with the metrics most closely tied to the project’s main goals. That might mean energy production, emissions cuts, or climate resilience results. Keep the focus tight. If a metric doesn’t help show whether the project is doing what it promised, it probably doesn’t belong in the first set of KPIs.
Baselines matter just as much. You need a clear starting point before anyone can claim progress. Without that, reporting turns into guesswork, and funding conversations get messy fast.
Once the metrics and baselines are set, put them into contracts. That step makes expectations clear across every partner involved. It also gives project sponsors, lenders, and operators a shared scorecard, so performance isn’t left open to interpretation.
How much should monitoring cost?
Monitoring costs can swing quite a bit depending on how the project is set up and how demanding the reporting is. Environmental Impact Bonds are a good example. They can add about $800,000 in transaction costs because the monitoring process is more involved.
By contrast, projects using the Climate Bonds Standard come with lower entry costs. Fees start at $1,000 for developing nations and $2,000 for developed nations, plus 0.00001 of the bond issuance amount.
That price gap matters. Monitoring is not just a box to check for compliance. It supports accountability, gives investors clearer visibility, and can make future capital raises easier. Build those costs into your initial budget and your risk plan from the start.
Related Blog Posts
Latest Articles
©2026
Narrative Change and Power Building: The Missing Half of Advocacy
Narrative change is the process of disrupting dominant narratives that normalize inequity and advancing new narratives from historically marginalized communities.
Funding Resilience Without Federal Grants
BRIC is unreliable and FEMA is shrinking. Here's how cities fund climate resilience with dedicated revenue, blended finance, and a coordinating authority.
The ESG Blind Spot: How AI Is Finding Risks in Companies Nobody Else Is Watching
Norway's sovereign wealth fund uses AI to screen 7,200 portfolio companies for forced labor and corruption within 24 hours. The real story is the emerging-market coverage gap that traditional ESG data vendors miss — and what it means for any company with a global supply chain.
FAQ
01
What does it really mean to “redefine profit”?
02
What makes Council Fire different?
03
Who does Council Fire work with?
04
What does working with Council Fire actually look like?
05
How does Council Fire help organizations turn big goals into action?
06
How does Council Fire define and measure success?
07
How does technology fit into Council Fire’s work?
Jul 26, 2026
Blended Finance Monitoring: Best Practices
ESG Strategy
In This Article
Track finance, energy, and climate/social KPIs from deal design; assign owners, verify data, fund monitoring, and link findings to decisions.
Blended Finance Monitoring: Best Practices
If I had to boil this down to one point, it’s this: blended finance monitoring only works when I track money, energy output, and climate/social results together from the start.
If I wait until after financial close, reporting turns into patchwork. The article makes that plain: I need a results framework before funds go out, a short list of shared KPIs, named data owners, fixed reporting cycles, outside checks, and clear rules for what happens when numbers miss target. It also shows that monitoring costs money - often 0.5% to 3% of project cost - and that this spend should sit in the project budget from day one.
Here’s the short version:
Set the framework early: define baselines, targets, and attribution before financial close.
Track three result types at once: financial, technical, and climate/social.
Assign ownership: every KPI needs one named party responsible for source data and reporting.
Match reporting to decisions: monthly plant data, quarterly finance data, annual impact data, and milestone reviews.
Check data quality: use range checks, reconciliations, portfolio reviews, audits, and third-party assurance.
Tie data to action: use thresholds for review when DSCR, generation, revenue, or social targets slip.
Use results across the portfolio: compare deals to adjust guarantees, grants, TA, and future capital mix.
What stayed with me most is that good monitoring is not just for compliance. It is how I see whether $200,000,000 in blended capital, a 3:1 leverage ratio, or a 200 MW solar target is turning into actual power, lower emissions, and better service on the ground.
That is the standard the article sets, and it is a useful one.
Build a Results Framework Before Financial Close
A results framework should be set up before financial close, while the deal structure is still taking shape. In blended finance, public, philanthropic, and private investors often come in with different goals. Those goals need to line up from day one across financial flows, commercial performance, and development results.[1][2] Once the framework is in place, the next move is plain but important: assign who collects data, how often reporting happens, and who checks that the numbers hold up.
Map Inputs, Outputs, Outcomes, and Impacts
For a blended renewable energy deal, the theory of change follows a clear chain.
Inputs are the capital instruments and support that get the project off the ground. That can include concessional loans, first-loss tranches, guarantees, grant-funded technical assistance, and policy support. In practice, one project might mix concessional capital, guarantees, grants, and commercial debt.
Outputs are the direct items you can count. Think megawatts of capacity installed, the number of distributed solar systems deployed, training sessions delivered to local operators, or policy products prepared and delivered.
Outcomes are the changes that come next. These include annual electricity generation in MWh, fewer grid outages, new household or business connections, and follow-on private investment drawn into the sector.[3][6]
Impacts are the longer-term results funders care about most: tCO₂e avoided each year, expanded electricity access, and better grid reliability. For example, the Clean Technology Fund reports annual GHG reductions of 42.3 million metric tons of CO₂e, with that figure expected to grow to 82 million metric tons of CO₂e as its portfolio matures.[11]
Put this chain into a one-page theory of change before disbursement. Quantitative targets should use U.S. number formatting, such as $250,000,000 and 450,000 MWh/year.
Choose Indicators That Balance Finance, Climate, and Social Results
Use a small core set of indicators across finance, climate, and social results. A project can hit its MW target and still miss the mark if it does not produce the expected MWh.[4][7]
Indicator Type | Example Indicators | Typical Data Sources | Strengths |
|---|---|---|---|
Financial | Total blended capital ($), private finance mobilized ($), leverage ratio, project IRR, DSCR, tariff revenue | Term sheets, financial close documents, audited accounts, investor reports | Precise and comparable across deals; familiar to private investors; supports risk management |
Climate – Technical | Installed capacity (MW), annual generation (MWh) | Metering systems, SCADA, EPC contracts | Directly tied to SDG 7; straightforward to verify |
Climate – Impact | tCO₂e avoided per year | Grid emissions factors, standardized MRV tools | Central to SDG 13 and NDC reporting |
Social | Households and businesses connected, service reliability improved, jobs created, share of jobs held by women | Project records, household surveys, payroll data | Reveals who benefits; essential for just transition claims by capital providers |
Set Baselines, Targets, and Attribution Rules Up Front
A target without a baseline does not tell you much. Before financial close, teams need to record the starting point for every core indicator, including current grid emissions intensity in tCO₂e/MWh, existing generation capacity, and household electricity access rates in the project area.[3][7] If baseline data is thin, use secondary sources like national energy plans, utility reports, and international databases, and mark estimates clearly.
Targets should come from engineering feasibility and financial modeling, not wishful thinking. A 200 MW solar project might reasonably target 450,000 MWh of annual generation and mobilization of $200 million in total capital, with a 3:1 leverage ratio of private to public finance.[5] Each target should link plainly to SDG 7 and SDG 13, and also match the country's nationally determined contribution (NDC), so project metrics can roll up into national commitments.[7][9][10]
When several funders share one deal, they should agree ahead of time on how credit gets assigned. That can be based on risk-sharing proportion, pro-rata finance share, or causal contribution. Geographic and time boundaries also need to be defined early so the results stay auditable.[7][2]
With the metrics agreed, monitoring can shift from design work to disciplined reporting.
Put Data Collection and Reporting on a Disciplined Schedule
Once the framework is in place, turn it into a working routine. That means naming owners, setting file formats, and fixing deadlines before the first disbursement. With the framework defined, the next job is simple in theory and often messy in practice: make ownership clear and set a reporting rhythm people can actually follow.
Assign Data Responsibilities Across the Capital Stack
Every core data point in a blended finance deal should have a named owner, and that owner should be written into the deal documents so the duty is enforceable, not left to guesswork.[12]
In practice, the work is split across the stack. SPVs collect source data. Operators keep O&M logs. Fund managers roll up portfolio results. Funders set disclosure rules. Lenders monitor covenants. Independent verifiers check and assure the numbers.[5][12][13]
A simple RACI matrix - Responsible, Accountable, Consulted, Informed - mapped to each main indicator helps stop two common problems: missing data and duplicate work. It also helps to pair that matrix with service-level agreements that spell out timing, completeness standards, and what happens when a submission is late or doesn’t line up with prior reports.
Once ownership is settled, deadlines should follow the decisions that data is meant to support.
Use Reporting Cycles That Match Operational and Investment Decisions
Reporting schedules should match decision points, not office habit. For U.S.-based renewable energy blended finance projects, a practical setup usually follows four reporting cycles:
Monthly operating data covers generation (MWh), plant availability, capacity factor, downtime, and key performance measures such as grid reliability or storage performance. SPVs often submit these reports 10–15 days after month-end so asset managers can spot technical trouble before it hits cash flow.[5]
Quarterly financial and covenant reporting covers income statements, balance sheets, cash flow statements prepared under U.S. GAAP, and covenant tests such as the Debt Service Coverage Ratio (DSCR). The timing should line up with investment committee meetings, where teams may need to decide on refinancing or corrective action.[14]
Annual impact reporting pulls together tCO₂e avoided, renewable electricity generated, households served, and jobs created. These reports are often issued within 90–120 days after fiscal year-end.[14]
Midterm and end-of-project evaluations are tied to major milestones, including refinancing windows, scale-up choices, or the planned exit of concessional capital. These usually happen around years two to three and again near project maturity.[12][13]
Without quality checks, even a tidy reporting calendar can turn into noise.
Strengthen Data Quality, Verification, and Transparency
Three controls do most of the heavy lifting here: preventive checks, portfolio-level anomaly detection, and independent assurance.
Preventive checks include automated range tests that catch impossible values, like negative generation or sudden jumps in capacity factor that don’t fit the operating profile. They should also include reconciliations between metered output and billed revenue. Portfolio-level anomaly detection means the fund manager reviews cross-asset trends to catch patterns that may look fine at one site but look off when compared with the full portfolio. Independent assurance adds another layer: annual financial audits by CPAs, periodic impact verification by specialist firms or NGOs, and environmental and social compliance audits.
Data Source | Responsible Party | Verification Method | Primary Use Case |
|---|---|---|---|
Metering systems (SCADA, smart meters) | SPV / project operator | Digital MRV, remote sensing | Energy generation KPIs, performance monitoring |
Audited financial statements | SPV / project sponsor | Independent audit (CPA firm) | Financial covenants, investor reporting |
Beneficiary surveys | NGOs / community groups | Third-party social audit | Household access, jobs, social inclusion |
GHG emissions calculations | Operator | Third-party assurance | Climate reporting, emissions reduction tracking |
Compliance and governance data | SPV / compliance team | Independent environmental and social review | Safeguards, regulatory compliance |
Disclosure rules should also draw a clean line between asset-level data shared with investors and aggregate impact metrics used for public reporting. That’s not just a reporting preference; it matters for trust across the capital stack. Convergence’s analysis finds that approximately 50% of blended finance transactions do not publicly disclose impact outcomes,[8] and that gap weakens market credibility. Annual reports should spell out methods, assumptions, and limits - not just publish totals.
Govern Monitoring Through Clear Roles, Budgets, and Decision Rules
Data only matters when someone owns the next move. After reporting cycles are in place, governance decides who reviews exceptions, who takes action, and how fast that happens. That’s what turns monitoring from a reporting exercise into a decision tool.
Define Oversight Roles for Funders, Investors, Operators, and Communities
Every blended finance deal should have a formal oversight body, usually a project steering committee or investment committee, with documented role descriptions written into term sheets, shareholder agreements, and the Environmental and Social Management System (ESMS).[1][15][17] The setup matters, but the split of responsibilities matters just as much.
Public funders and concessional providers set top-line impact goals and minimum reporting standards. Private investors track credit risk, financial performance, and covenant compliance. Operators run day-to-day work and carry out corrective actions. Communities give input on social performance through set channels such as community advisory panels, grievance redress systems, and periodic consultations.
The goal isn’t just to assign names to tasks. It’s to spell out what happens when results fall short. Use an amber threshold to trigger closer monitoring and a red threshold to trigger a formal exception review. When governance rules require community-derived data as a mandatory input to those reviews, projects can spot social risk sooner and respond before problems grow.
Budget for Monitoring as a Core Project Function
Monitoring should sit in the budget as its own capital and operating cost. As a general benchmark, full M&E can range from 0.5% to 3% of total project costs, depending on project complexity, the number of stakeholders involved, and verification requirements.[2][16]
Capital budgets cover metering and data systems. Operating budgets cover staff time, analysis, engagement, and verification. Larger multi-asset funds often add budget for portfolio-level analytics and third-party evaluators, such as engineering firms or independent impact verifiers, to confirm energy generation data, GHG calculations, and social outcomes.
That budget discipline matters. If contracts don’t tie funds to specific outputs, monitoring often gets pushed aside when costs tighten. Define deliverables up front, including:
Quarterly performance dashboards
Annual impact reports
Verification statements
Link Monitoring Findings to Risk Management and Investment Decisions
Monitoring data should flow straight into the investment committee and other decision forums. A monitoring governance plan should map the data path from source, whether that’s meters, financial systems, or community surveys, through validation and into committee review, with pre-agreed response options for common issues.
Flag assets when trailing 12-month DSCR headroom drops below 0.15x above covenant, then move the issue from an operating review to a financial review.[18] If generation is weak, start with the likely technical causes, such as resource variability, equipment faults, or grid curtailment, before treating it as a deeper structural issue. If revenue falls short, review tariff structures or PPA terms. If development targets are missed, such as local jobs or gender inclusion metrics, use that signal to revise community investment plans or shift impact-focused capital.
The table below shows how accountability should sit across stakeholder groups. It also makes clear what tends to break when no one owns the issue.
Stakeholder | Oversight Role | Controlled Data | Risk if Accountability Is Unclear |
|---|---|---|---|
Public Funder | Sets impact KPIs; provides first-loss capital | Impact metrics, subsidy usage, social KPIs | Over-subsidization; wasted public resources |
Private Investor | Monitors financial returns; assesses credit risk | Financial performance, DSCR, debt service | Moral hazard; insufficient project diligence |
Operator | Manages daily operations; owns data reporting | Energy output, O&M logs, safety incidents | Performance shortfalls; data gaps or manipulation |
Independent Verifier | Validates data quality and impact claims | Verified tCO₂e reductions, generation metrics | Greenwashing; loss of investor and public trust |
Community | Provides local support and context | Service reliability, grievance records, land use | Project delays; permitting failures; social opposition |
Decision rights and response options should be set in advance so monitoring can drive course correction while there’s still time to act. Those same decisions should also feed portfolio learning and shape future deal design.
Use Monitoring for Learning, Adaptive Management, and System-Level Impact
Compliance vs. Learning-Oriented Blended Finance Monitoring
Once monitoring is set up well, the next step is simple: use the data to make the next deal better, not just to describe the last one. That shift turns monitoring from a reporting exercise into a tool for portfolio design and smarter capital deployment.
Turn Project Data Into Portfolio and Market Insights
Project-level data starts to matter far more when it is standardized and pooled across a portfolio. For that to work, blended finance facilities need to collect the same core variables for every transaction: the type and dollar amount of concessional support, the grant-equivalent value, leverage ratios, capacity factor by technology type, WACC, DSCR, and local lender participation.
That kind of comparability makes patterns hard to miss. It shows which concessional tools - grants, guarantees, or subordinated debt - do the best job of bringing in local banks. It shows whether risk premiums fall in later deals, which points to actual market growth instead of a steady need for public subsidy. It also puts a dollar figure on system bottlenecks. If distributed solar projects across a portfolio keep running into multi-month interconnection delays, monitoring data can show the added financing cost in U.S. dollars and give decision-makers a clear case for streamlining interconnection rules.
Use a shared results structure so data can roll up across the portfolio. Then use those patterns to shape the next round of capital allocation and technical assistance.
Design Feedback Loops That Improve Future Transactions
Those findings should flow into annual decisions on structure, support, and incentives. Monitoring results need a formal place in scheduled review points, especially annual portfolio reviews, where the evidence is presented to investment committees and used to adjust instrument mix, technical assistance (TA) priorities, and developer support.
A few examples make the point:
If monitoring shows that guarantees bring in higher local lender participation at a lower concessional cost than grants, the facility should shift its capital stack in that direction.
If the data shows that early-stage distributed solar developers cannot reach financial close without more flexible capital, the answer is to add development-stage grants or convertible instruments.
If several projects show cost overruns tied to weak interconnection planning, TA resources should move toward utility coordination and grid integration engineering support.
Monitoring data should also directly shape how incentive levels are adjusted and tapered as markets mature.[19][20]
Conclusion: Key Practices That Make Monitoring Credible and Useful
Across this guide, the core practices come down to a short list of non-negotiables: define results before financial close, use a shared indicator set that covers finance, climate, and social outcomes, assign data ownership clearly across the capital stack, verify information through independent third parties, fund monitoring as a core project cost, and tie evidence to decisions through governance rules that require action, not just review.
The table below shows the difference between monitoring that checks a box for funders and monitoring that helps improve portfolio performance and market development.
Feature | Compliance-Oriented Monitoring | Learning-Oriented Monitoring |
|---|---|---|
Primary Objective | Meet funder requirements and legal obligations | Improve future deal structuring and market development |
Indicator Focus | Rigid, output-based metrics (MW installed, $ disbursed) | Balanced finance, climate, and social KPIs tied to outcomes |
Time Horizon | Short-term reporting periods or fund cycles | Long-term project lifecycle and portfolio insights (10–20+ years) |
Decision Use | Audit triggers and disbursement conditions | Adaptive management, instrument recalibration, policy dialogue |
Data Ownership | Siloed by individual funders or operators | Shared across the capital stack, verifiers, and communities |
Used with discipline, these practices make monitoring the mechanism that improves how blended finance structures are designed, priced, and deployed in future transactions.
FAQs
What is blended finance monitoring?
Blended finance monitoring is the structured process of tracking how a project performs, whether it meets its obligations, and what social or environmental impact it delivers when funding comes from a mix of public, philanthropic, and private capital.
It matters because it supports accountability, builds investor trust, and helps open the door to future funding. Strong monitoring starts before financial close with clear KPIs, baseline data, and set reporting schedules. That early setup helps make sure public funds are used only when needed and that the project stays on track with its sustainability goals.
Which KPIs matter most first?
Define KPIs, baselines, and reporting schedules before financial close so accountability and funding are built in from day one.
Start with the metrics most closely tied to the project’s main goals. That might mean energy production, emissions cuts, or climate resilience results. Keep the focus tight. If a metric doesn’t help show whether the project is doing what it promised, it probably doesn’t belong in the first set of KPIs.
Baselines matter just as much. You need a clear starting point before anyone can claim progress. Without that, reporting turns into guesswork, and funding conversations get messy fast.
Once the metrics and baselines are set, put them into contracts. That step makes expectations clear across every partner involved. It also gives project sponsors, lenders, and operators a shared scorecard, so performance isn’t left open to interpretation.
How much should monitoring cost?
Monitoring costs can swing quite a bit depending on how the project is set up and how demanding the reporting is. Environmental Impact Bonds are a good example. They can add about $800,000 in transaction costs because the monitoring process is more involved.
By contrast, projects using the Climate Bonds Standard come with lower entry costs. Fees start at $1,000 for developing nations and $2,000 for developed nations, plus 0.00001 of the bond issuance amount.
That price gap matters. Monitoring is not just a box to check for compliance. It supports accountability, gives investors clearer visibility, and can make future capital raises easier. Build those costs into your initial budget and your risk plan from the start.
Related Blog Posts
Latest Articles
©2026
Narrative Change and Power Building: The Missing Half of Advocacy
Narrative change is the process of disrupting dominant narratives that normalize inequity and advancing new narratives from historically marginalized communities.
Funding Resilience Without Federal Grants
BRIC is unreliable and FEMA is shrinking. Here's how cities fund climate resilience with dedicated revenue, blended finance, and a coordinating authority.
The ESG Blind Spot: How AI Is Finding Risks in Companies Nobody Else Is Watching
Norway's sovereign wealth fund uses AI to screen 7,200 portfolio companies for forced labor and corruption within 24 hours. The real story is the emerging-market coverage gap that traditional ESG data vendors miss — and what it means for any company with a global supply chain.
FAQ
What does it really mean to “redefine profit”?
What makes Council Fire different?
Who does Council Fire work with?
What does working with Council Fire actually look like?
How does Council Fire help organizations turn big goals into action?
How does Council Fire define and measure success?
How does technology fit into Council Fire’s work?