In This Article
Use baselines, matched reference sites, and preset thresholds to interpret EIA monitoring and trigger timely protective actions.
Baseline Data and EIA Monitoring: What Changes Count?
A change after construction does not, by itself, prove the project caused it. I start with three checks: Is the measurement sound, does it differ from seasonal and reference-site patterns, and does it cross a preset action threshold? If people or habitats face an acute threat, I act before the cause is confirmed.
To decide what your monitoring results mean, I focus on:
The starting point: Record pre-project conditions, seasonal swings, existing stressors, and sampling methods.
The comparison: Track matched reference sites before and after work - not just the project site.
The decision rules: Separate statistical changes, legal limits, health or habitat benchmarks, and management triggers.
The cause and response: Check timing, exposure routes, and other possible causes; assign owners and deadlines, then check whether controls worked.
My guiding rule: match each claim to what the data support, <u>keep the original baseline</u>, and document uncertainty without delaying needed protection.
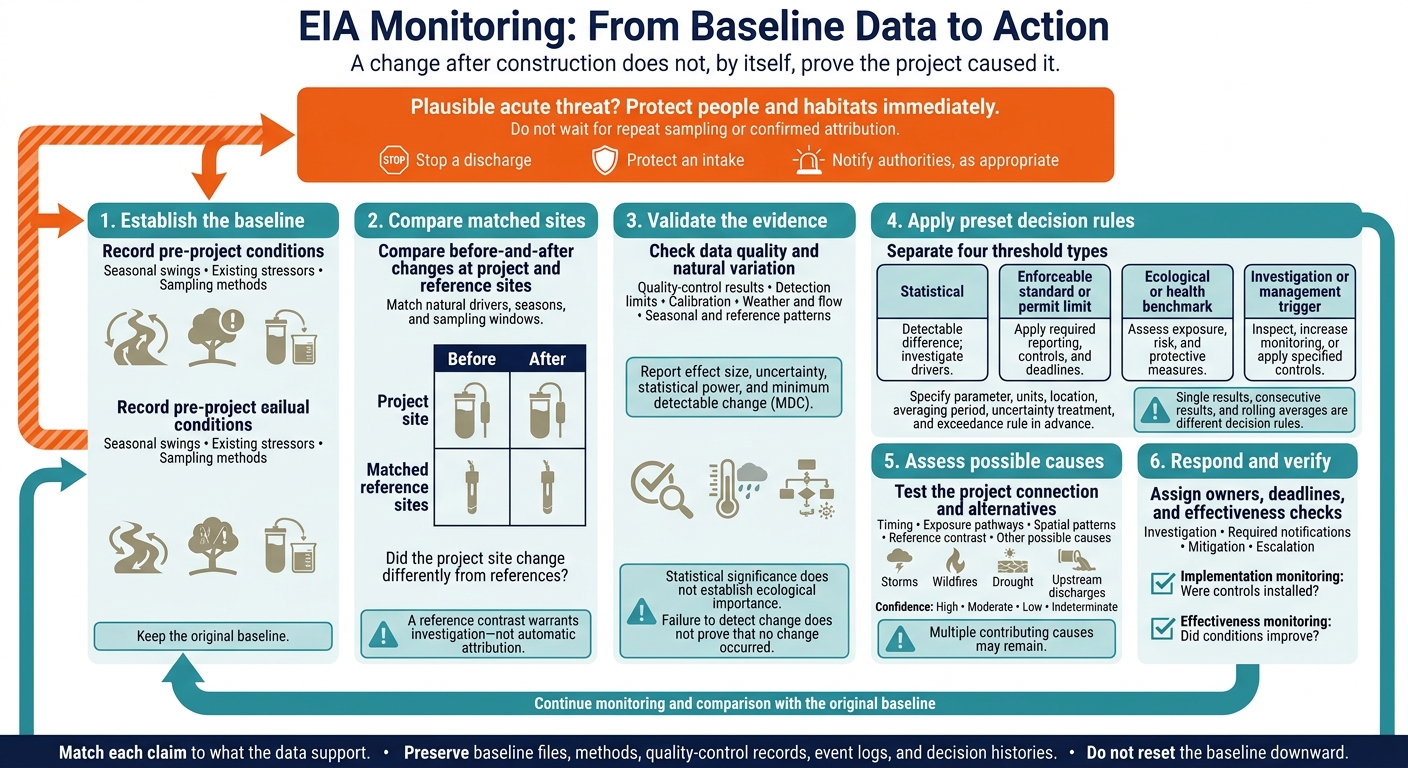
EIA Monitoring: From Baseline Data to Action
Lecture 38: EIA Methods for Ecology (Baseline Study)
sbb-itb-8baf5f1
Use Reference Sites to Compare Changes
Reference sites help separate project-related changes from broader background changes. Measure them at the same time as the project site to test whether similar changes occur outside the project area. A reference site is a benchmark - not just a nearby location. Its usefulness depends on how closely it matches the factors that drive the indicator.[3][2]
Choose Comparable Reference Sites
Start by mapping groundwater-flow direction and surface-water connections. A reference site must track the same natural drivers as the project site. Match the conditions that control the indicator: geology, hydrology, elevation, land use, climate, seasonality, and existing sources.
Match aquifers and well-screen depths, too; nearby wells may sample different water. Use multiple reference sites where flow paths or natural conditions vary. Treat downgradient wells and downstream stations as impact sites unless you can rule out exposure.[4][5]
Only matched sites can support judgments about whether a change is project-related.
Compare Before-and-After Changes Across Sites
Choose a study design based on the question: Did the project site change, did non-project conditions change, or did the project site change differently from reference sites?
| Design | What it can establish | Data needs | Main limits |
|---|---|---|---|
| Before–after | Whether the project site changed | Comparable pre-project and later measurements | Cannot separate project effects from shared trends |
| Reference-only | Whether non-project conditions changed during the same period | Repeated, concurrent reference measurements | Cannot establish whether the project site changed |
| Before–after/control–impact (BACI) | Whether the project site changed differently from references | Before-and-after measurements at both, replicated over time and preferably across sites | Depends on comparable pre-project trends, suitable sites, and adequate sampling |
The goal goes beyond detecting change: test whether the project site changed differently from the reference. In BACI analysis, compare changes at both sites across matched seasons and sampling windows. Sample routine conditions and short-lived events at both. Review uncertainty and pre-project trends. A project-site change that exceeds reference changes warrants further investigation, but does not automatically establish attribution.[1][2]
Keep reference monitoring active through project phases. After flooding, wildfire, new development, or altered pumping, reassess affected sites against the remaining network. Preserve flagged observations and explain exclusions rather than silently dropping inconvenient results. Similar changes across sites suggest a shared driver, though a project effect may still be layered on top.[3]
Record Reference-Site Suitability
Document why each site can or cannot serve as a reference for each indicator. Use the table below as a decision record for later attribution.
| Field | What to record |
|---|---|
| Location | Coordinates, elevation, watershed or aquifer, distance and direction from project |
| Site role | Reference, background, upgradient, downstream, impact, or regional station |
| Resource comparability | Geology, hydrology, screen depth, habitat, land use, climate, and indicator-specific similarities |
| Expected project influence | Connections and transport pathways; why exposure is unlikely, possible, or likely |
| Known confounders | Existing sources, land-use changes, drought, flooding, wildfire, remediation, or other disturbances |
| Access and continuity | Permissions, safe access, sampling history, equipment, maintenance, and long-term availability |
| Data quality | Methods, detection limits, missing records, quality-control results, and laboratory continuity |
| Suitability by resource | Suitable, conditionally suitable, or unsuitable for each resource and indicator |
| Review status | Review date, reviewer, decision, and conditions requiring reassessment |
Use reference for the comparison role, upgradient/downstream for flow position, and background for intended no-project conditions. Record the reason for each classification and revision.[5] Document these judgments before analysis so later exclusions remain traceable.
Decide When Changes Require Action
Once baseline and reference comparisons are defined, assess whether a later change is real, relevant, and actionable under predefined thresholds. Urgent protection must not wait for repeat sampling or confirmed attribution. A plausible acute threat may require stopping a discharge, protecting an intake, or notifying authorities while the investigation continues.[9][12]
Check Data Quality and Natural Variation
Check chain of custody, holding times, laboratory validation flags, blanks, duplicates, instrument calibration, and drift. Confirm that detection limits support the decision and that sampling conditions match the monitoring plan. Compare results with seasonal ranges and matched reference data to determine whether the change exceeds expected seasonal variation. Account for weather, flow, and other known drivers.[7][8][10][11]
Treat repeated measurements as correlated, not independent. Before monitoring begins, estimate statistical power and minimum detectable change (MDC). Report effect size with uncertainty. Statistical significance does not establish ecological importance, and failure to detect change does not prove that no change occurred.[6][7][13]
Set Statistical, Legal, and Management Thresholds
After validating the change, apply the decision rules set during planning. Use EPA’s Data Quality Objectives process to define the action level. Before reviewing results, specify the parameter, units, location, averaging period, treatment of uncertainty, and exceedance rule - including how nondetects are handled. Assign a responsible party and deadline. Keep emergency controls, compliance reporting, investigation, and longer-term corrective action separate.[14][15]
| Threshold | Basis and comparison period | Interpretation | Required response |
|---|---|---|---|
| Statistical | Prespecified test, effect size, confidence interval, or trend test; defined baseline or reference window | Detectable difference under the statistical model; not proof of harm or cause | Validate analysis, investigate drivers, and compare with ecological or compliance criteria |
| Enforceable standard or permit limit | Applicable legal requirement; specified instantaneous, daily, or longer averaging period | Compliance finding under the applicable calculation and exceedance rules | Follow required reporting, controls, and deadlines |
| Ecological or health benchmark | Receptor-specific evidence; relevant exposure duration | Potential harm; not automatically a legal violation | Assess exposure, risk, and protective measures |
| Investigation or management trigger | Monitoring plan or project commitment; defined event, trend, or rolling window | Investigation or action warranted; enforceability depends on legal status | Inspect, increase monitoring, or apply specified controls |
Keep ecological or health benchmarks and project commitments clearly labeled unless they have been incorporated into enforceable requirements. Single results, consecutive results, and rolling averages are different decision rules. Apply the rule that governs the finding.[9][12]
Classify Findings Without Assuming Cause
| Finding | Evidence needed | Interpretation limit | Response |
|---|---|---|---|
| No detectable change | Valid data, suitable detection limits, adequate coverage, and documented MDC | Limited sensitivity can hide meaningful effects | Continue monitoring and document power and limitations |
| Statistically detectable change | Prespecified analysis supports a difference | Magnitude, duration, and benchmark relevance still need assessment | Investigate drivers and assess ecological or health relevance |
| Regulatory exceedance | Applicable measurement and averaging requirements are met | Source and ecological injury may remain unresolved | Follow reporting and corrective-action requirements; protect receptors immediately if needed |
| Ecologically meaningful change | Harmful magnitude, duration, biological response, or loss of function | Site conditions and sparse indicators may limit certainty | Assess risk and apply mitigation |
| Change supported as project-related | Consistent timing, plausible pathway, spatial pattern, reference contrast, and alternative-cause review | Multiple contributing causes may remain | Implement controls, assign evidence-supported responsibility, and preserve the causal analysis |
Match the response to the strongest available evidence; these categories can overlap. Check persistence when assessing chronic exposure or cumulative effects, but only when waiting will not increase risk. Do not require persistence before responding to an acute threat.[9][12]
Assess Causes and Plan a Response
Check Pathways and Other Possible Causes
When a change crosses a threshold, check whether a plausible pathway connects project activity to the observed change. Examine timing, possible exposure routes, spatial patterns, and agreement with predicted effects. Match monitoring timestamps to construction phases, operating changes, spills, and maintenance logs. Also check external events, including storms, wildfires, drought, and upstream discharges. EPA’s CADDIS framework supports using site evidence alongside comparable evidence from other locations.[20]
Where evidence is missing, add pathway-specific measurements, reference locations, or more observation time rather than forcing attribution. Rate attribution confidence as high, moderate, low, or indeterminate, and document the supporting evidence and gaps. Account for short baselines, poorly matched references, multiple stressors, and delayed or cumulative effects.[18][20]
Assign Response Roles and Preserve Records
If screening shows the change warrants further review, assign responsibility and document the response. Name owners and deadlines for investigation, required notifications, mitigation, escalation, and effectiveness checks. Keep implementation monitoring - checking whether controls were installed - separate from effectiveness monitoring, which checks whether conditions improved. Set the expected response and review date before judging success.[19] Confirm applicable federal, state, Tribal, permit, and settlement duties with the relevant agency, since notification and record-retention rules vary.
Preserve original baseline files, assumptions, predictions, methods, quality-control records, event logs, and decision histories. Date and explain monitoring revisions, retain continuity stations, and compare updated conditions against the original baseline. Do not reset the baseline downward. Follow EPA environmental-justice recommendations to involve affected communities in selecting indicators and communicating findings in accessible ways. Where appropriate, compare findings with community monitoring.[16][17] Keep these records connected so later reviewers can trace the evidence and decisions.
Conclusion: Match Decisions to the Evidence
After reviewing causes, move from interpreting findings to assigning action. Representative baselines and preset thresholds support defensible decisions; they do not automatically prove cause. Serious risk may justify interim protection even while attribution remains unresolved.[18][20]
FAQs
How much baseline data do we need before construction?
There’s no fixed industry standard for baseline data. How much you need depends on the project’s scale, potential impacts, and regulatory requirements. Research suggests 3 to 5 years of data are often needed to separate natural climate cycles from project impacts.
High-risk projects affecting natural habitats often require fieldwork across multiple seasons and at least one full year of baseline surveys. Data quality and reliability matter more than volume when supporting sound decisions and independent review.
What if we cannot find a suitable reference site?
When no suitable reference site is available, place sensors alongside established USGS stream gages or weather stations to add historical context. Trusted secondary sources or proxies can also fill data gaps. Document the methods and their limits so readers understand how the data was gathered and where uncertainty remains.
Council Fire stresses that long-term records can help separate project-specific effects from broader regional shifts when primary measurements are limited. These records help turn ecological trends into metrics that guide risk and resilience planning.
What if monitoring misses short-lived pollution spikes?
Missing brief pollution spikes can skew baseline conditions, hide acute project impacts, and delay or prevent needed emergency responses. Use layered monitoring: continuous, high-frequency sensors to detect spikes, paired with multi-year records to track long-term trends.
If you miss an important event or monitoring window, document the gap and explain how it affects decision-making. Fill that gap before finalizing findings on the significance of impacts.

FAQ