In This Article
15 KPIs to measure representation, hiring, promotion, pay, retention, and inclusion with clear rules and privacy controls.
On this page
- Define Populations, Timeframes, and Benchmarks
- Protect Employee Privacy and Verify Data Quality
- 1. Workforce Representation by Demographic Group
- 2. Representation by Job Level
- 3. Intersectional Representation
- 4. Hiring Funnel Diversity
- 5. New-Hire Representation by Demographic Group
- 6. Selection-Rate Equity Ratio
- 7. Promotion Rate by Demographic Group
- 8. Promotion Equity Ratio
- 9. Leadership Representation
- 10. Succession Pipeline Diversity
- 11. Retention Rate by Demographic Group
- 12. Voluntary Turnover Rate by Demographic Group
- 13. Pay Equity Gap
- 14. Development Access Rate
- 15. Inclusion and Belonging Index
- Compare KPI Categories, Reporting Schedules, and Data Sources
- Choose KPIs That Match Your Equity Goals
- Conclusion: Assign Owners and Follow Through
- FAQs
Workforce Diversity Metrics: 15 KPIs to Track Progress
Headcount alone doesn’t tell us whether employees have equal access to opportunity. I recommend pairing a workforce outcome, such as leadership representation, with measures that help explain it, such as promotion rates and development access.
These 15 KPIs help us examine who joins, advances, stays, and feels supported:
Workforce composition: Representation by demographic group, representation by job level, and intersectional representation.
Hiring: Hiring funnel diversity, new-hire representation, and the selection-rate equity ratio.
Advancement: Promotion rates, the promotion equity ratio, and succession pipeline diversity.
Leadership: Leadership representation.
Retention: Retention rates and voluntary turnover rates.
Pay and employee experience: The pay equity gap, development access rate, and inclusion and belonging index.
I treat these measures as signals for review - not proof of causes. For example, a selection-rate ratio below 0.80 can flag a hiring process for review; it does not establish discrimination.
Before calculating results, I define the population, dates, denominator, and benchmark. Then I check data quality, protect employee privacy, and assign an owner and next action. <u>The goal is fewer barriers - not a longer dashboard.</u>
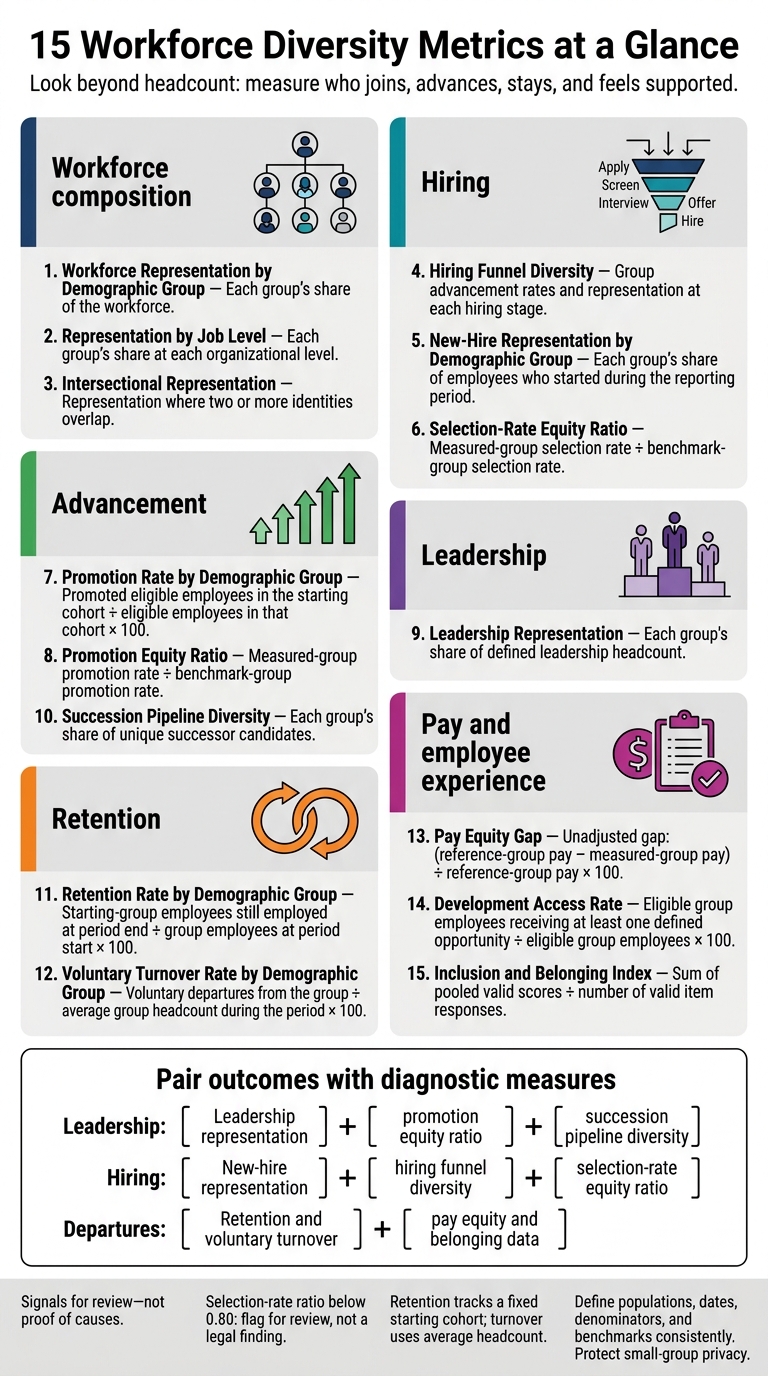
15 Workforce Diversity Metrics at a Glance
Define Populations, Timeframes, and Benchmarks
Set the measurement rules before calculating results. Specify who counts as an employee on the measurement date, including how to handle leave, interns, temporary staff, and contractors. Count hires by start dates within the reporting period and departures by termination dates within that period. Count promotions as approved moves to a higher job level or grade. Set separate eligibility rules for promotion, development, and succession measures, and apply them consistently across demographic groups, locations, and employment types.
Match the denominator to the question:
Representation: Group headcount ÷ total headcount at period end.
Retention: Starting-cohort employees still employed at period end ÷ original cohort. Exclude later hires.
Turnover: Departures during the period ÷ average headcount. When staffing is stable, calculate average headcount as (beginning headcount + ending headcount) ÷ 2. When staffing fluctuates a lot, use a documented monthly average.[6][8]
Multiply each result by 100. Use the same rules across groups so any gap reflects the workforce, not differences in the math.
Choose exact reporting dates and stick to them. Monthly monitoring, quarterly reviews, and annual trend reporting are practical options. Save snapshots from the HR information system that include job level, function, location, employment type, and employment dates. If a reorganization or definition change affects comparisons, restate earlier results or clearly mark the break. Consistent snapshots support sound trend comparisons and every KPI in the list that follows.
Set a baseline in both counts and percentages. Then specify the target population, target value, deadline, owner, and review schedule. Base targets on internal history and relevant labor-market availability. External benchmarks should match the occupation, geography, and recruiting market - not just the national workforce. Treat availability as a comparison point, not a ceiling.[7][9] These definitions keep the 15 KPIs comparable across groups and time.
Report results by level and function, adding location and employment type where relevant. Company-wide figures can hide gaps in leadership or technical roles. Label calculations precisely: a percentage-point gap subtracts the benchmark percentage from the organization’s percentage; a relative representation ratio divides the organization’s percentage by the benchmark percentage. They answer different questions and should never share an unclear label such as “percent gap.”
sbb-itb-8baf5f1
Protect Employee Privacy and Verify Data Quality
Before calculating the KPIs below, set privacy and data-quality rules that support valid subgroup comparisons in hiring, promotion, retention, pay, and inclusion. Collect sensitive data only through voluntary self-identification. Explain why you need it, how you’ll use it, who can access it, and how employees can decline. Where lawful, collect race and ethnicity, gender, disability, veteran status, age, LGBTQ+ identity, and intersectional identities. Never infer identities from names, photos, appearance, pronouns, location, or algorithmic predictions. Keep self-identification responses separate from hiring and other employment decision materials.[10][11]
Use one data dictionary across HRIS, recruiting, payroll, learning, performance, and survey systems. For each field, record its definition, response options, source, collection date, permitted uses, and reporting rules. Store raw responses separately from mapped categories, including multiple identities. Before each report, check for duplicate IDs, missing outcomes, invalid dates, and mismatched totals. Investigate sudden shifts in coverage before describing them as workforce trends.
For demographic KPIs, report self-identification coverage for each field: self-identified responses ÷ eligible records × 100. Show coverage separately for applicants, employees, hires, promotions, exits, and survey respondents. Keep “undisclosed,” “unknown,” and “not asked” separate. Include them in coverage denominators, and never redistribute them among known groups. Document exclusions from subgroup comparisons and test whether the way you handle missing data changes the findings.
Protect raw data with role-based access, encryption, access logs, and retention limits. De-identification alone isn’t enough. Set a documented minimum cell size with privacy and legal review.[13]
For example, suppress counts below 5 or 10; neither is a universal legal minimum.
Protect intersecting identities, too. Check whether totals, filters, or adjacent reports let readers calculate suppressed counts by subtraction. When needed, suppress additional cells or aggregate results. Apply these safeguards consistently to protect privacy without distorting KPI reporting, especially for intersectional groups.
Require employment-counsel review before launch or material changes. The review should cover collection wording, confidentiality, retention, system linking, reporting, and any use in employment decisions, with particular attention to disability, LGBTQ+ data, and applicable federal-contractor requirements.[10][12] Assign owners for data quality, security, privacy, and legal review. Give employees a clear process to correct their records.
1. Workforce Representation by Demographic Group
What It Measures and How to Read It
This KPI tracks each demographic group’s share of your workforce. Report groups separately rather than combining them into one “diverse” category. It shows who is present - not whether employees have equitable access to opportunity.
Formula and Population
Group representation (%) = employees in the group ÷ total employees × 100. Calculate this using headcount, not hours worked.
Data Sources
Start with the HRIS employee roster and reconcile it against payroll before calculating the rate.
Link to Equity Goals
Compare representation with the relevant labor market, not the entire U.S. population. The U.S. Census Bureau’s EEO Tabulation provides comparisons by occupation and geography.[2] Assign an owner to this KPI and review it quarterly alongside hiring, promotion, retention, and pay metrics. Then use this baseline to compare representation by job level.
2. Representation by Job Level
What It Measures and How to Read It
This KPI shows each demographic group’s share at each job level, from individual contributor through executive. It reveals concentrations that company-wide figures can hide. Compare adjacent levels, but don’t treat a drop as proof of a promotion barrier. Hiring and turnover also affect where representation narrows.
Formula and Population
Representation at level (%) = employees from the group at that level ÷ all employees at that level × 100
Use the same workforce scope and snapshot date across all levels. Report counts alongside percentages, masking data as needed.
Data Sources
Combine HRIS demographic and job-code records, job architecture, and organizational charts. Define levels by scope, decision authority, and responsibility - not job titles alone. Fix inconsistent mappings before reporting, and keep definitions stable across departments and reporting periods.
Link to Equity Goals
Use comparisons between adjacent levels to identify where representation narrows. Assign HR and the function’s business leader to investigate those transitions using promotion, leadership development access, and turnover data. Direct their findings toward specific barriers rather than relying only on a company-wide representation goal. Use this level-by-level breakdown as the baseline for promotion, hiring, and retention analysis.
3. Intersectional Representation
What It Measures and How to Read It
This KPI tracks representation gaps where two or more identities overlap, such as race and gender. Use it alongside broader demographic measures, not in their place. It helps reveal gaps at specific job levels that broad averages can hide. Read small changes cautiously because intersectional groups are often small.
Formula and Population
Intersectional representation (%) = employees with the defined intersecting identities ÷ employees in the chosen workforce or job level × 100
Choose intersections that match your equity goals. Specify whether the denominator includes all employees in scope or only those who self-identified. Keep missing responses separate, and never infer identity from nonresponse.[14]
Data Sources
Small counts make privacy safeguards especially important. Link self-ID data to HRIS records for employee status, department, and level. Limit access to authorized analysts, apply the standard suppression threshold, and check whether totals, filters, or downloads could indirectly reveal someone’s identity.[15]
Link to Equity Goals
Assign HR and the relevant business leader to review the selected intersections quarterly or semiannually. Pair representation data with promotion, development access, and voluntary turnover data for the same group to see where outcomes differ most sharply. Before crediting an intervention, check whether the change reflects actual workforce movement or greater participation in self-identification.
4. Hiring Funnel Diversity
What It Measures and How to Read It
Representation shows who is present. Hiring funnel diversity shows where groups move forward - or drop out. This KPI tracks demographic groups through applications, screening, interviews, offers, and hires.
Advancement rates show how often each group reaches the next stage. Stage representation shows each group’s share of candidates at that stage. Read them together: a diverse applicant pool can mask uneven screening outcomes. Differences point to areas for review; they are not automatic proof of discrimination.
Formula and Population
Group advancement rate (%) = group candidates advancing ÷ group candidates at the prior stage × 100
Stage representation (%) = group candidates at each stage ÷ all candidates at that stage × 100
Compare matched requisition cohorts by job family, location, seniority, and employment type, with consistent stage definitions. Track withdrawals separately from employer rejections so the data accurately reflects process outcomes.
Data Sources
Connect ATS, interview, assessment, offer, HRIS, and requisition records using candidate and requisition IDs. Include stage, dates, disposition, offer status, hire outcome, and demographic fields.
Keep undisclosed responses separate in counts and percentages. Display counts alongside percentages, while protecting small groups from identification.
Link to Equity Goals
Tie this KPI to a clear goal: increasing representation in technical hiring, reducing disproportionate screening losses, or ensuring equitable access to interviews. An unfavorable result should prompt a documented review. Confirm the gap, then pinpoint the stage creating it before changing the process.
Identify the stage and requisitions with the largest gap.
Compare outcomes by recruiter, hiring manager, sourcing channel, and location at that stage.
Check job descriptions for unnecessary qualifications or exclusionary language that may contribute to the gap.
Check that stage’s interview questions, scoring rubrics, assessments, screening rules, and accommodation processes against job requirements.
Test less exclusionary alternatives to the selection method creating the gap.
Measure changes in advancement - not just applicant mix. The EEOC’s 80% four-fifths rule flags possible selection-rate gaps for review, but it does not replace sample-size or job-relatedness analysis.[5]
5. New-Hire Representation by Demographic Group
What It Measures and How to Read It
This KPI tracks the demographic mix of employees who started during a set period - the outcome of the hiring funnel. It shows who was hired, not whether the process was equitable. Use it to check whether hiring is changing the workforce mix before examining patterns in job level, promotion, and retention.
Formula and Population
New-hire representation (%) = group hires ÷ all hires × 100
Include employees whose start dates fall within the reporting period, and document whether rehires count. Exclude transfers, contractors, interns, acquisitions, and contingent workers unless they fall within the defined scope.
Data Sources
Use HRIS to confirm start dates, ATS to connect hires with applicant pools, and onboarding records for voluntary self-identification. Reconcile these records so accepted offers count only when the employee starts. Report unknown responses separately, since missing data can distort comparisons.
Link to Equity Goals
Track whether hiring is changing workforce composition in the roles and locations tied to your equity goals. Compare results with prior periods and qualified-candidate pools for those same roles and locations - not broad national demographics. BLS occupation-level data offers context, not a qualification standard.[17][18]
Assign ownership to recruiting or people analytics, and review results quarterly. Pair this KPI with selection-rate and offer-acceptance data to identify where disparities begin in the hiring process.
6. Selection-Rate Equity Ratio
What It Measures and How to Read It
After mapping where candidates drop out of the hiring funnel, compare groups’ advancement rates at the same stage. A ratio below 1.0 means the group being measured advances at a lower rate than the benchmark group. Treat 0.80 as a screening threshold, not a legal finding.[5][22]
Formula and Population
Selection-rate equity ratio = selection rate for the group being measured ÷ benchmark-group selection rate
Each selection rate equals selected candidates ÷ candidates considered. Define “selected” for the stage you’re measuring, and include only candidates considered at that stage. Compare matched requisitions, levels, and locations at the same stage. Document group definitions, the benchmark group, dates, eligibility rules, withdrawals, and how you handle missing data.[5]
Data Sources
Use ATS stage histories, decision records, and assessment outcomes. Record requisition IDs, demographic groups, stage entry and outcomes, withdrawals, and disposition reasons. Check for duplicate applications and inconsistent coding. Show counts alongside ratios and note sample sizes - small samples can produce unstable results.[4][20][21]
Link to Equity Goals
Connect this KPI to a specific goal, such as reducing assessment-stage disparities. HR analytics calculates the ratio; recruiting leaders investigate flagged stages. Review it monthly for high-volume hiring and quarterly for lower-volume roles.
Before making changes, check assessment validity, accommodations, and scoring consistency. Then track the results. Send recurring disparities and interventions to employment counsel for review.[5][19] Apply the same discipline to the promotion and retention measures later in the list.
7. Promotion Rate by Demographic Group
What It Measures and How to Read It
Use this KPI after selection-rate analysis to check whether gaps at individual stages carry through to actual promotions. It measures the percentage of eligible employees in each demographic group promoted during a defined period. Compare employees in similar roles and levels, with similar tenure and promotion opportunities.
A lower rate flags a barrier, not proof of discrimination. Look beyond final decisions to examine access to sponsorship, stretch assignments, and promotion consideration. This connects gaps in the promotion funnel to actual outcomes.
Formula and Population
Promotion rate = promoted eligible employees in the starting cohort ÷ eligible employees in the starting cohort × 100
Define eligibility rules for minimum tenure, employment status, job level, review requirements, and leave treatment. Keep the starting cohort fixed, and count each employee once - even if they receive more than one promotion.
Check whether these rules unfairly exclude employees. For example, an employee may be missing a required review because of protected leave or a manager’s delay.
Data Sources
Use HRIS records to establish the starting cohort and demographic groups. Check promotions and grade changes against job-change and payroll records. Use performance records to confirm eligibility and ratings, then review promotion records to trace nominations, decisions, and reasons for nonselection. Keep employees who were never considered separate from those considered but not promoted.
Link to Equity Goals
Focus on a specific advancement barrier, such as the first move into management. Calculate the rate annually; review it quarterly only when promotion volume supports that frequency. Investigate gaps by role, tenure, manager, and whether employees received promotion consideration.
Publish clear promotion criteria, standardize review rubrics, and track two annual cycles to see whether gaps narrow.
8. Promotion Equity Ratio
What It Measures and How to Read It
After reviewing promotion rate, use this ratio to compare how quickly different groups move through the same promotion process. It compares a group’s promotion rate with a benchmark group’s rate within the same eligible employee pool.
A ratio of 1.00 means equal rates; 0.80 means the measured group’s rate was 80% of the benchmark rate; 1.20 means it was 20% higher. Treat the ratio as a signal for review - not proof of discrimination - especially when eligible headcounts or promotion counts are small.
Formula and Population
Promotion equity ratio = measured-group promotion rate ÷ benchmark-group promotion rate.
Use the same promotion-rate calculation, eligibility rules, time period, job levels, and benchmark-group definition as KPI 7. If the benchmark group’s promotion rate is zero, report the ratio as undefined, not 0.
Data Sources
Use HRIS or talent-management records, supported by approved promotion forms, compensation changes, and performance records as needed. Report eligible headcount, promotions, and promotion rates for both groups so readers can see the numbers behind the ratio.
Link to Equity Goals
Report separate ratios by level, function, and promotion step. Look for repeated differences across multiple periods rather than drawing conclusions from a single quarter or annual cycle.
For recurring gaps, assign an owner to review nomination practices, promotion criteria, sponsorship access, performance ratings, and decision patterns. Set a follow-up date to assess targeted changes. Compare the results with leadership representation to see whether gaps widen at higher levels.
9. Leadership Representation
What It Measures and How to Read It
This KPI tracks who holds decision-making power. Define leadership as executive and senior roles with authority over strategy, budgets, and hiring. Keep that definition consistent across reporting periods.
By focusing on the top of the organization, this metric shows representation gaps that can shape decisions and succession. Use it to assess whether hiring, promotion, development, and retention are producing equitable leadership outcomes.
Formula and Population
Leadership representation (%) = leaders in the group ÷ total leadership headcount × 100
Use the defined leadership snapshot and report headcounts alongside percentages. Exclude board directors. Report board representation separately, using total board directors as the denominator.
Data Sources
Use HRIS records and voluntary demographic self-identification. Check the leadership population against executive rosters and organizational charts. Resolve title or job-grade mismatches before reporting.
Link to Equity Goals
Compare results with prior periods and the internal pipeline for leadership roles, then review differences by function and geography. Assign an executive owner to address gaps through succession planning, access to development, and retention. Check progress quarterly or semiannually, and use the results to assess whether the succession pipeline is broadening or narrowing.
10. Succession Pipeline Diversity
What It Measures and How to Read It
After measuring who holds leadership roles, look at who’s being prepared to step into them. This KPI tracks the share of successor candidates for critical roles who belong to a given demographic group. Compare it with the eligible successor pool, not the full workforce. Even a strong overall pipeline can mask gaps among candidates who are ready now.
Formula and Population
Succession pipeline diversity (%) = successor candidates in the group ÷ all successor candidates × 100. Count each person once, even if they’re nominated for multiple roles.[23]
Include employees named in formal succession plans or talent reviews during a defined period, such as a quarter or calendar year. Break results down by role level and readiness category: ready now, ready in 1–2 years, and ready in 3+ years.
Data Sources
Use succession-management and talent-review records linked to HRIS demographic data. Include role inventories, readiness ratings, nomination records, and relevant performance, development, mobility, and self-ID data.
Check the succession roster against the employee master file. Document missing or declined demographic data, preserve historical snapshots, and limit access to authorized users. Keep a consistent data dictionary that defines successor, critical role, and each readiness category.
Link to Equity Goals
After each talent review, track nomination rates, sponsorship access, and stretch-assignment access by demographic group. If a group’s share of successors falls below its share of the eligible pool, review nomination evidence, readiness standards, and access to development before attributing the gap to bias.
Assign an owner to track movement into ready-now pools and appointments. Where the pipeline is thin for certain groups, check whether retention and turnover patterns help explain the gaps.
11. Retention Rate by Demographic Group
What It Measures and How to Read It
After reviewing promotions, look at retention to see whether representation gaps reflect employee exits rather than advancement. This KPI measures the share of a starting cohort still employed at the end of a set period.
Compare demographic groups over the same dates, using overall retention, voluntary and involuntary turnover, tenure, level, location, and manager for context. A gap points to where to investigate - not why people leave. New hires can increase a group’s representation even when retention within its original cohort is weak.
Formula and Population
Retention rate (%) = starting-group employees still employed at period end ÷ group employees at period start × 100. Keep the cohort fixed and exclude later hires. Do not substitute end-of-period headcount or calculate retention as “100% minus turnover.”[24][25]
Define cohort rules before calculating the rate. Count employees on approved leave as retained, and keep internal transfers in the organization-wide cohort. Specify how to handle rehires, furloughs, layoffs, contractors, employer-of-record workers, retirement, and extended disability leave.
Keep both starting and ending team assignments. Exclude employees acquired after the start date or report them separately.
Data Sources
Use HRIS as the source of truth for cohort membership and employment status at period end. Include employee IDs, employment-status histories, hire and termination dates, separation reasons, demographic attributes, job level, location, department, and manager history.
Reconcile HRIS data with payroll, leave, recruiting/acquisition, and exit records. Report starting counts, retained counts, and retention rates. Suppress small-group results when they could reveal an individual’s employment outcome.
Link to Equity Goals
Review large groups quarterly and smaller groups annually. When quarterly results fluctuate, use rolling 12-month cohorts. Read retention alongside voluntary and involuntary exits, promotion rates, pay equity, access to development, engagement or belonging scores, and exit reasons.
Set a measurable objective tied to a specific group gap. Assign owners and document actions, deadlines, and outcomes. Check promotion and mobility data so successful internal moves are not counted as employee losses. Pair retention with voluntary turnover to assess whether departures cluster within specific groups.
12. Voluntary Turnover Rate by Demographic Group
What It Measures and How to Read It
After reviewing retention, use this KPI to separate employee-initiated departures by demographic group. Report each group’s rate alongside the overall rate and a clearly named reference group. A positive turnover gap means the measured group leaves at a higher rate than the reference group - not why it leaves.
Formula and Population
Voluntary turnover rate (%) = voluntary departures from the group ÷ average group headcount during the period × 100.[26]
Define average headcount consistently. Use beginning-plus-ending headcount divided by two, or the mean of monthly headcounts when staffing fluctuates. Count resignations and other employee-initiated exits. Exclude layoffs, reductions in force, and other involuntary exits, and document whether retirements are reported separately.
Turnover gap (percentage points) = measured-group rate − reference-group rate. Keep the reference-group definition consistent across reporting periods.
Turnover uses average headcount; retention tracks only the starting cohort.
Data Sources
Combine HRIS headcount snapshots, resignation and separation records, and separation dates to place departures in the correct reporting period.
Use exit interviews to review stated reasons alongside tenure, manager, location, and job level. Compare interview participation rates across groups: responses add context, but they may not represent everyone who leaves.
Link to Equity Goals
Use persistent gaps to test pay, mobility, workload, flexibility, and manager practices rather than assume a cause. Assign an HR owner and set a baseline, target, actions, and review dates.
Track both the group’s rate and its gap using rolling 12-month results. A falling company-wide rate can still hide a widening disparity. Review the gap alongside promotion and pay data to see whether departures are concentrated in specific groups.
13. Pay Equity Gap
What It Measures and How to Read It
After promotion and retention, pay tests whether opportunity translates into compensation. This KPI compares a measured group’s pay with a reference group’s pay. A positive gap means the measured group earns less. State whether you use mean or median pay; high earners affect the mean more. A gap points to where you should investigate - it does not prove discrimination.[31][32]
Formula and Population
Keep the raw gap separate from within-job comparisons.
Unadjusted pay gap (%) = (reference-group pay − measured-group pay) ÷ reference-group pay × 100.
Define the groups, reporting date, employee population, and exclusions. Report the overall gap separately from within-job and within-level gaps. Use the same pay basis throughout: hourly or annualized. Calculate separate gaps for base pay, bonuses, commissions, overtime, equity, and total compensation. Explain how you value equity awards.[27][28][30]
Data Sources
Combine payroll and compensation records with HRIS demographics, job architecture, hours, tenure, and location records. For adjusted analysis, add promotion history and performance ratings. Check job codes, pay periods, and effective dates. Protect small-group results by suppressing them or combining them into larger groups.
Link to Equity Goals
Pay gaps can persist even when representation looks stable. Use adjusted analysis as a second lens, not a replacement for the unadjusted gap. Pair the raw gap with a model-based adjusted estimate only when qualified analysts and adequate sample sizes support it. Document the model and its controls.
Job level, prior salary, tenure, and performance ratings may carry inequities into the analysis; do not assume they are neutral controls. Compare results with and without questionable variables. A smaller adjusted gap does not establish equitable pay.[27][29][30]
Have employment counsel and compensation or statistical experts review corrective actions, such as pay adjustments, starting-pay rules, or bonus calibration.[33] Assign an owner, budget, deadline, and follow-up metric. Review the KPI annually and after major compensation cycles.
14. Development Access Rate
What It Measures and How to Read It
Development Access Rate measures the share of eligible employees in a demographic group who receive at least one development opportunity during a set period. After reviewing the succession pipeline, use this KPI to check access to experiences that support promotion and leadership: optional learning, mentoring, sponsorship, and stretch assignments.
Report mandatory training separately so compliance training doesn’t hide gaps in discretionary access. Also separate sponsorship from mentoring. Sponsors advocate for employees and connect them with advancement opportunities; mentors offer advice and support.[34][35]
Compare each demographic group’s rate with the rate for all eligible employees. Where sample sizes allow, break results down by job level, function, location, employment status, and opportunity type. This metric shows access - not completion or advancement.
Formula and Population
Development access rate (%) = eligible group employees receiving at least one defined opportunity ÷ eligible group employees × 100.
Count each employee once per reporting period, even if they receive several opportunities. Clearly define eligibility rules, such as role, tenure, location, employment status, performance requirements, or prerequisites, and apply them consistently.
Use a fixed reporting period - a quarter, six months, or a year. For rolling programs, assign access to the period when it began.
Data Sources
Combine HRIS demographic and eligibility records with learning-management-system data, mentoring and sponsorship records, assignment or project systems, and program application or selection logs.
Use employee IDs to remove duplicate records. Record opportunity type, invitation or selection date, start date, and completion status. Track offers, acceptance, starts, and completions separately to identify where access breaks down.
Link to Equity Goals
If your equity goal is equitable access to leadership pipelines, focus on sponsorship, stretch assignments, and leadership-program access by group and job level - not total training attendance.
Audit nomination and manager-referral rules, and fund paid learning time. Assign an owner, publish eligibility criteria, and review progress on a fixed schedule. Pair this KPI with the inclusion index to assess whether access comes with a real sense of belonging.
15. Inclusion and Belonging Index
What It Measures and How to Read It
After measuring access, use this index to check whether employees experience that access as fair, safe, and welcoming. It measures employees’ reported sense of belonging, voice, fair treatment, respect, and psychological safety. The aim is to see whether representation and opportunity shape daily work - not just HR records.
Use several consistently worded survey items rather than a single question.
“I feel that I belong at this organization”
“My opinions count at work”
“I can speak up without fear of negative consequences.”
Score agreement on the same scale, such as 1 (strongly disagree) to 5 (strongly agree). Higher scores indicate better experiences.
Formula and Population
Index = sum of pooled valid scores ÷ number of valid item responses.
Define the eligible population before measurement begins and keep it fixed across periods. Document the response window, rating scale, reverse-worded items, minimum number of completed items, missing-response rule, and item weights.
Exclude unanswered items from the denominator unless your methodology states otherwise. Reverse-score negatively worded questions so higher values always reflect better inclusion.
Data Sources
Use anonymous engagement or pulse surveys with item-level responses and optional demographic categories. Use HRIS counts only for the denominator, not to identify respondents.
Report valid and excluded response counts, average item scores, and response rate = completed eligible responses ÷ eligible employees × 100. Include subgroup score gaps and participation rates, applying your established privacy threshold before breaking results down by subgroup.
Link to Equity Goals
For advancement goals, compare voice and psychological-safety scores with promotion rates. For retention goals, compare belonging scores with voluntary turnover.
An overall average can hide subgroup gaps. Treat those gaps as signals to investigate, not proof of discrimination. Check participation and item-level trends, assign an action owner and deadline, and repeat the same questions after changes.
Report what leaders changed before the next survey cycle. Keep definitions consistent across category comparisons and reporting schedules.
Compare KPI Categories, Reporting Schedules, and Data Sources
Use this table to compare all 15 KPIs by purpose, reporting schedule, data source, and the equity question each helps answer.
| KPI | Category | Reporting cadence | Principal data source | Primary equity question |
|---|---|---|---|---|
| 1. Workforce Representation by Demographic Group | Workforce composition | Quarterly | HRIS | Does composition match equity goals and labor-market availability? |
| 2. Representation by Job Level | Workforce composition | Quarterly | HRIS; organizational hierarchy | Where do representation gaps widen? |
| 3. Intersectional Representation | Workforce composition | Quarterly, where privacy permits | HRIS; demographic self-identification | Which intersecting groups are missing or concentrated? |
| 4. Hiring Funnel Diversity | Hiring | Quarterly | Applicant tracking system (ATS) | Where do recruiting gaps emerge? |
| 5. New-Hire Representation by Demographic Group | Hiring | Quarterly | ATS reconciled with HRIS | Are hires addressing representation gaps? |
| 6. Selection-Rate Equity Ratio | Hiring | Quarterly | ATS | Are selection rates comparable for comparable roles? |
| 7. Promotion Rate by Demographic Group | Career advancement | Quarterly | HRIS and talent records | Do eligible employees advance at comparable rates? |
| 8. Promotion Equity Ratio | Career advancement | Quarterly | HRIS and talent records | Which groups have lower promotion rates? |
| 9. Leadership Representation | Leadership composition | Quarterly | HRIS; organizational hierarchy | Which groups are underrepresented in leadership? |
| 10. Succession Pipeline Diversity | Career advancement | Semiannually, after talent reviews | Succession-planning system | Who is included in critical-role succession slates? |
| 11. Retention Rate by Demographic Group | Retention | Quarterly | HRIS; payroll | Which groups are least retained? |
| 12. Voluntary Turnover Rate by Demographic Group | Retention | Quarterly | HRIS; payroll; exit records | Which groups leave voluntarily at higher rates? |
| 13. Pay Equity Gap | Employee experience | Annually; follow up after material compensation changes | Payroll; compensation system; HRIS | Which pay differences need investigation or correction? |
| 14. Development Access Rate | Career advancement | Semiannually, after talent or learning cycles | Learning-management system; mentoring and sponsorship records | Who lacks development access? |
| 15. Inclusion and Belonging Index | Employee experience | Quarterly or semiannually | Employee survey platform | Which groups report weaker inclusion, belonging, or voice? |
Reporting cadence is not the measurement window. A quarterly dashboard can use rolling 12-month rates. Use longer windows for rare or seasonal events, label every window, and record the compensation snapshot date for pay equity.
Read the measures by use, not just category. They fall into three groups: development access and succession diversity are early indicators; hiring-funnel diversity and selection-rate equity are process measures; representation, leadership composition, retention, turnover, and pay equity are lagging outcomes.
Longer windows do not remove privacy risks. Apply minimum-cell thresholds to both groups and event counts, and prevent readers from reconstructing suppressed results through overlapping tables. Never label suppressed results as zero. Use this wording:
“not reported because the population is below the privacy threshold,”
Before each release, reconcile HRIS with payroll, remove duplicate applicant records, and confirm job levels and event dates. Flag denominator changes, assign a data owner, and set a sign-off process.
Choose KPIs That Match Your Equity Goals
Use the KPI list above as a menu for leadership, hiring, or retention decisions. Choose only the measures needed to answer one decision. Start with the equity question, not the dashboard. Pair one outcome KPI with at least one diagnostic or experience measure.
For leadership advancement, pair leadership representation with promotion equity ratio and succession pipeline diversity.
Compare the same eligible pool and readiness bands. Look for where the gap begins: access to the pipeline or promotion decisions.
For hiring barriers, pair new-hire representation with hiring funnel diversity and the selection-rate equity ratio.
Representation alone doesn’t show where hiring barriers occur. Check process measures before changing recruitment practices. Treat the four-fifths rule as a screening flag, not a final finding.[5] At the flagged stage, review job-related requirements, assessment scores, and scoring consistency. This ties hiring metrics to the stage where the gap appears.
Employee departures show the exit side of the same equity system tracked through workforce composition and advancement.
For employee departures, pair retention and voluntary turnover with pay equity and belonging data.
Where privacy permits, examine patterns by tenure, job level, location, and manager. Use the findings to investigate exit reasons, workload, access to advancement, compensation, and manager practices. Treat these patterns as signals, not proof of causes.
Set the measurement rules before reporting. Write a measurement plan for each KPI that defines its population, numerator, denominator, timeframe, benchmark, owner, cadence, target, deadline, and trigger. Match benchmarks to the question: historical results for progress, candidate pools for hiring, and peer groups for disparity checks. State who must respond when a trigger is met.
Use findings to fix systems, not to make individual decisions from demographic targets.
Hiring gaps can prompt structured assessments and standardized scoring; advancement gaps can prompt clear promotion criteria and broader development access; unexplained pay differences can prompt compensation reviews.
For flagged selection processes, check that criteria are job-related and applied consistently, and review less exclusionary alternatives.[16] Assign owners and review dates before the next reporting cycle.
Conclusion: Assign Owners and Follow Through
Turn the KPIs tied to your equity goals into a regular management routine. Bring them together in one dashboard, with each KPI’s value, baseline, target, trend, benchmark, reporting period, owner, review cadence, escalation trigger, due date, and next action. Give every measure one accountable executive and one owner responsible for day-to-day work.[38]
Each metric also needs privacy controls and a response plan. Protect employee identities by reporting results in aggregate, suppressing small cells, and restricting access by role.[36] Keep an action log for each KPI that records the issue, suspected barrier, intervention, owner, resources, expected outcome, and next review date.
Review KPI outcomes quarterly, using the action log to decide which measures to keep reporting. Retain a measure only if it identifies a barrier, guides a decision, or shows whether an intervention worked. Drop measures that add noise without changing policy or practice.[38] Measure progress by fewer barriers and more access to opportunity.[37]
FAQs
Which diversity KPIs should a small organization prioritize?
Focus on workforce representation by demographic and job level, applicant-to-hire conversion, and promotion rates and gaps among eligible employees. Track adjusted and unadjusted pay equity gaps and reductions, retention and voluntary attrition by group, and inclusion and belonging through a short, consistent survey [1].
For each metric, document its definition, denominator, data source, owner, and review cadence. Track leading indicators quarterly and review trends annually so the results guide action - not just reporting [1][2].
How can we tell whether a KPI change reflects real progress?
Track the KPI over time with fixed definitions, a clear baseline period, and subgroup breakdowns. Check that any shifts reflect actual changes - not changes in definitions or data collection [1]. Measure outcomes, not just activity, and look for narrowing gaps between groups [2].
Verify changes against reliable sources, such as payroll-verified corrections for pay metrics. Then confirm that those changes lead to actual changes in decisions or processes, not just updates to reports [3][4].
How can we improve voluntary demographic disclosure?
Publish a workforce sustainability snapshot using secure, HR-audited data. Track “prefer not to say,” blank, unknown, and not collected as separate categories. Keep definitions consistent in a metric dictionary.
Break down results by level, function, location, and intersections only when sample sizes support safe disclosure. Protect confidentiality with suppression, broader groupings, and role-based access. Before publishing, use governance and data stewardship to validate methods and document them transparently. [1][2]




FAQ