
Sep 26, 2026 · 18 min read
Governance
In This Article
Treat DEI as a management cycle: consistent metrics, baselines, privacy controls, accountable owners, and budgeted actions.
Guide to Longitudinal DEI Outcome Tracking
If you only check DEI once a year, you can miss who gets hired, who moves up, who leaves, and where gaps stay stuck. I’d treat DEI tracking as a repeat cycle: measure the same outcomes over time, break results out by group, assign one owner per outcome, and tie each finding to a budget, policy choice, or process change.
In plain terms, this means I would:
track both early signs and end results
keep metric definitions the same from period to period
use a clear baseline, such as 01/01/2026–12/31/2026
check data quality, privacy risk, and small-group exposure
review subgroup gaps by level, function, location, and intersections
keep a written action log with owners, dates, and dollars
revisit the framework each year and document every change
A few points matter most:
One score is not enough. Representation can improve while pay gaps, retention, or belonging stay flat.
Annual snapshots can mislead. A survey score up 6 points means less if response rates drop from 78% to 42%.
Definitions must stay fixed. If your HRIS, job levels, or survey scales change, trend lines can break.
Reports need a next step. A dashboard without an owner, deadline, and funding path is just information.
Privacy controls matter. Small-cell suppression, role-based access, and separate handling of “prefer not to say,” blank, and unknown responses help cut exposure risk.
Here’s the article in one simple view:
| Area | What I’d focus on |
|---|---|
| Metrics | Representation, hiring funnel, promotion, pay, attrition, belonging, development access |
| Time frame | Monthly for funnel data; quarterly or semiannual for promotion, pay, retention; annual for representation and culture trends |
| Governance | Named owner, data steward, access rules, audit logs, review records |
| Reporting | Different views for executives, managers, employees, boards, and governance groups |
| Action | Continue, expand, redesign, or stop based on repeated results |
| Budget link | Put a dollar range on each response, from process fixes to pay reviews |
Bottom line: I’d use longitudinal DEI tracking as a management system, not just a report. The point is not to collect more numbers. The point is to see whether conditions are changing, for whom, and what the organization will do next.
How to Benchmark DEI in the Workplace
sbb-itb-8baf5f1
Build the Measurement Framework
Once you’ve defined leading and lagging indicators, the next job is to narrow the list. You don’t need a mountain of metrics. You need the smallest set of measures that helps people make real decisions. Start with the decision first, then pick the metric. If the choice on the table is whether to change succession planning, adjust promotion criteria, or expand access to leadership development, work backward to the measures that show if that move is working.
Align Metrics with Strategy and Decision-Making
Each priority outcome needs one executive owner with budget and policy authority. That person should be on the hook for reviewing results, approving course corrections, and reporting progress. Say the goal is to increase leadership representation of women and underrepresented racial or ethnic groups. In that case, the CHRO or the right business-unit leader should own the outcome, with a clear target, a set review rhythm, and a trigger for action when results slip.
Review timing should line up with how fast the process moves. Recruiting funnel metrics are often best reviewed monthly, since teams can fix problems before they show up in the annual workforce profile. Promotion, pay, and retention metrics usually make more sense on a quarterly or semiannual basis. Representation and culture outcomes tend to need annual analysis, paired with quarterly leading indicators so early warning signs don’t go unnoticed.
Choose a Balanced Scorecard and Define Every Metric
A useful DEI scorecard should cover the full employee lifecycle. That includes representation by level, function, and location, along with recruitment funnel conversion, promotion and advancement rates, voluntary attrition, compensation equity, inclusion experience such as psychological safety, belonging, and perceived fairness, participation in development programs, and relevant organizational outcomes like engagement or grievance patterns.
The scorecard should blend leading indicators - like participation, manager behaviors, and psychological-safety scores - with lagging indicators like representation, promotion gaps, pay disparities, and turnover. That mix matters. Leading indicators help you spot trouble early; lagging indicators show where you ended up.
Before you publish even one number, create a metric dictionary. Think of it as the master record for how every measure is calculated and governed. At a minimum, each entry should include the metric name, its purpose, the exact definition, the formula, the data source, the owner, the reporting cadence, the required demographic breakdowns, the population and inclusion rules, the confidentiality threshold, the target, and the action path if results move the wrong way.
For instance, "promotion rate" should be defined as the number of employees promoted during the reporting period divided by the number of eligible employees at the beginning of that period.
That level of detail may sound a bit dry, but it saves a lot of grief later. Without it, teams end up arguing about what a number means instead of deciding what to do about it.
Set Baselines and Preserve Comparability Over Time
Use a baseline that reflects normal operations. A full calendar or fiscal year - for example, January 1 through December 31, 2026 - is usually more dependable than a single quarter because it smooths out seasonal hiring cycles and one-time events. Before you lock it in, check that demographic fields were collected the same way across the period, that the dataset has enough observations for subgroup analysis, and that the year wasn’t warped by a merger, mass layoff, or a major policy shift. If it was, keep the baseline for transparency, but it can help to use a trailing three-year average as a second reference point.
The biggest risk here is an undocumented change that breaks the trend line. Maybe an HRIS migration changes how race and ethnicity are recorded. Maybe a job-level redesign makes “director” mean something different from one year to the next. Maybe a survey moves its psychological-safety scale from five response options to seven. At that point, the series is no longer continuous.
The fix is plain but strict: document the change and manage the transition. Record the effective date, the reason, the affected population, the old and new definitions, and the expected effect of every material shift. For survey instruments, keep the core wording and response scales the same whenever you can. If a change can’t be avoided, run the old and new versions side by side for one cycle.
Use the same metric definitions for snapshots, trends, cohorts, and interventions.
| Reporting Approach | Primary Question | Best Use | Main Limitation |
|---|---|---|---|
| Cohort analysis | What happens to a defined group over time? | Comparing retention, advancement, or pay progression for cohorts | Requires reliable longitudinal identifiers |
| Intervention evaluation | Did a specific action produce a meaningful difference? | Assessing sponsorship, structured interviews, or manager training | Attribution is difficult without a credible comparison group |
Once the framework is fixed, governance keeps the trend line trustworthy.
Govern Data Quality, Privacy, and Accountability
Once baselines are in place, governance keeps definitions, access, and quality checks steady enough to support comparison over time. That steadiness is what makes reporting and year-over-year analysis believable.
Assign Roles for Governance and Access Control
DEI data governance should be cross-functional. It shouldn't sit with HR or the DEI team alone. Build a group that includes an executive sponsor, DEI lead, HR/HRIS, people analytics, legal, privacy, security, business-unit owners, and employee representatives.
Set one accountable owner for the full measurement program, and assign a named data steward for each source system and metric. A responsibility matrix should spell out who approves collection, access, definitions, retention, corrections, publication, and corrective action. Be explicit about who can approve changes, not just who can comment on them.
Each role has a clear job. The executive sponsor owns resources and escalation. Legal reviews collection purposes and public claims. The privacy officer checks retention and re-identification risk. Security handles authentication, encryption, logs, and incidents. Business owners run local action plans. Employee representatives can spot unintended harm early, before it spreads.
Use a written governance charter that defines permitted sources, access levels, sign-off rules, retention periods, correction requests, and what can be published at each level of detail. Limit access by role and risk. Use least-privilege access: identifiable data for a small group of administrators, pseudonymized data for approved analysts, and aggregated data for decision-makers. Require multi-factor authentication, quarterly access reviews, and automated logging so you can always see who accessed, changed, or exported data.
Protect Confidentiality and Improve Data Quality
Small groups are a common confidentiality risk in DEI reporting. Set a suppression threshold for small groups with legal and privacy review. But the bigger trap is inference from nearby cells. If a dashboard shows a department total and every subgroup except one, someone can back into the hidden number with simple subtraction. That’s where teams get burned. Suppress or coarsen related cells, and block drill-downs, filters, and downloads that could expose hidden values.
Treat "prefer not to say", blank, unknown, and not collected as separate statuses. They do not mean the same thing. "Prefer not to say" is a meaningful response. A blank may point to a system defect or a broken workflow. Report the share of each status, and watch whether nonresponse clusters in certain business units, job levels, or survey modes. The EEOC identifies voluntary self-identification as the preferred method for race and ethnicity data and says that records should be kept separately from basic personnel files or records available to people making personnel decisions. [1][2]
The table below shows common data-quality risks, how to spot them, and who should handle them.
| Risk | Detection method | Mitigation | Owner |
|---|---|---|---|
| Missing or "prefer not to say" responses | Completeness rates by source, subgroup, location, and time; trend breaks | Improve instructions and accessibility; separate response statuses; investigate differential nonresponse; publish missingness | HR data steward and DEI analytics lead |
| Inconsistent demographic classifications | Compare source categories and mapping tables across cycles; inspect records that map to multiple or obsolete categories | Maintain a versioned crosswalk; preserve historical categories; document aggregation rules; obtain employee input on wording | HRIS owner and DEI data steward |
| Changes in survey wording or response options | Compare instruments and metadata across cycles; flag definition changes | Freeze core questions where possible; pilot revisions; create a bridge analysis; label breaks in the time series | Survey owner and people analytics |
| System mismatches or duplicate employee records | Reconcile HRIS, recruiting, promotion, and exit systems; check unique identifiers and headcount totals | Establish a master employee ID; define effective dates; perform monthly reconciliation; maintain exception reports | HRIS and systems integration owners |
| Small-cell disclosure | Scan all dashboard dimensions and combinations; test differencing and drill-down paths | Suppress, coarsen, aggregate, or restrict access; apply complementary suppression | Privacy officer and analytics lead |
| Unauthorized access or export | Review access logs, downloads, permission changes, and unusual queries | Apply least privilege, multifactor authentication, data-loss controls, incident response, and periodic access recertification | Information security and privacy |
Once data quality is under control, the next move is to present results in forms each audience can use.
Link Accountability to Corrective Action
Every priority outcome needs one accountable executive and one operational owner. If nobody is clearly named, gaps tend to linger. The executive makes sure the organization responds. The operational owner carries out the response and tracks whether it works.
For each outcome, keep a written action record with the baseline, current value, target, review date, disparity, cause hypothesis, interventions, milestones, resources, and a decision log that shows whether actions will continue, change, receive funding, pause, or stop. Use leading indicators to track implementation. Use lagging outcomes to confirm whether change actually happened.
Review leading indicators monthly or quarterly. Review lagging outcomes semiannually. Escalate at once for suspected confidentiality breaches, retaliation, material data corruption, or unauthorized publication. Each review should produce a dated record of results, data-quality exceptions, decisions, owners, deadlines, and the status of earlier corrective actions. Use layered accountability across executives, managers, and implementers to manage privacy risk.
Those records should feed straight into reporting, budget decisions, and policy updates.
Report Findings and Connect Them to Budgets and Policy
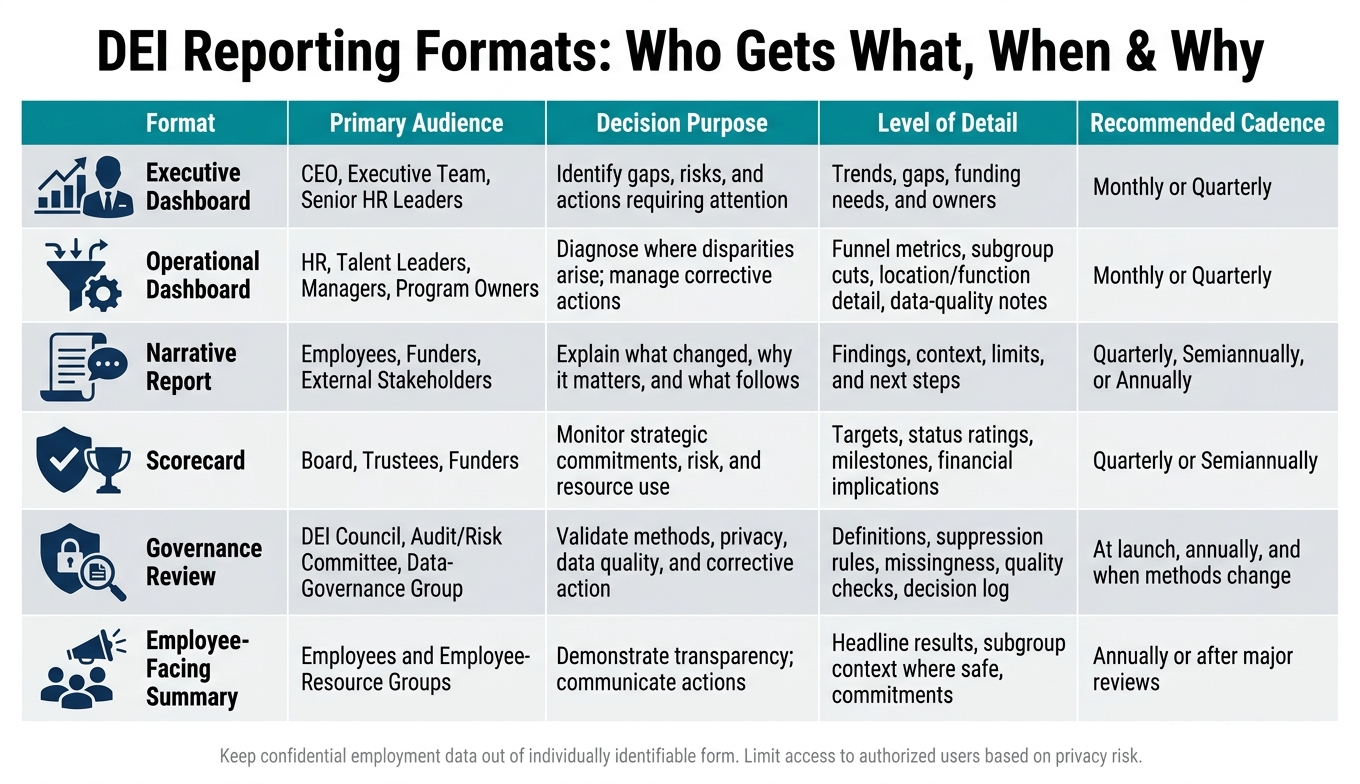
DEI Reporting Formats: Audience, Purpose & Cadence at a Glance
Reporting is where tracking starts to matter. If the report doesn’t reach the right people - or doesn’t lead to a decision - it just sits there. That’s why it helps to use the same owner and decision log from the accountability cycle, so every report ends with a named next step.
Match Reporting Formats to Each Audience
Not every audience needs the same view. An executive needs trends, gaps, funding needs, and owners. A manager needs process-stage data and assigned actions. An employee needs a plain-language summary of what was measured and what happens next, without exposing small-group results. A board or funder needs a scorecard that ties outcomes to strategy and resource commitments. A governance group needs a review package that shows methodology, data quality, privacy controls, and corrective-action status.
| Format | Primary audience | Decision purpose | Level of detail | Recommended cadence |
|---|---|---|---|---|
| Executive dashboard | CEO, executive team, senior HR leaders | Identify gaps, risks, and actions requiring attention | Trends, gaps, funding needs, and owners | Monthly or quarterly |
| Operational dashboard | HR, talent leaders, managers, program owners | Diagnose where disparities arise; manage corrective actions | Funnel metrics, subgroup cuts, location/function detail, data-quality notes | Monthly or quarterly |
| Narrative report | Employees, funders, external stakeholders | Explain what changed, why it matters, and what follows | Findings, context, limits, and next steps | Quarterly, semiannually, or annually |
| Scorecard | Board, trustees, funders | Monitor strategic commitments, risk, and resource use | Targets, status ratings, milestones, financial implications | Quarterly or semiannually |
| Governance review | DEI council, audit/risk committee, data-governance group | Validate methods, privacy, data quality, and corrective action | Definitions, suppression rules, missingness, quality checks, decision log | At launch, annually, and when methods change |
| Employee-facing summary | Employees and employee-resource groups | Demonstrate transparency; communicate actions | Headline results, subgroup context where safe, commitments | Annually or after major reviews |
Keep confidential employment data out of individually identifiable form. Access should be limited to authorized users based on privacy risk.
Once the format is in place, the report has to show where the biggest gaps are.
Present Subgroup Gaps Without Flattening Differences
A single company-wide average can blur what’s happening underneath. An organization might report 80% favorable inclusion scores overall, while employees in one location report 55% favorable results and a specific demographic subgroup reports 48%.
Disaggregate results by demographic group, job level, function, location, employment type, and relevant intersections wherever privacy and sample size allow. That’s often where the story changes. Intersectional analysis - for example, promotion rates for Black women in management - can surface patterns that separate race and gender averages miss. Use the same baselines and definitions from the measurement framework, and publish subgroup results only when sample size supports safe disclosure. The EEOC specifically warns that race, ethnicity, and sex information collected for reporting cannot be used to facilitate unlawful discrimination [3].
Numbers alone rarely explain the gap. Pair trend data with interviews, focus groups, open-text responses, or listening sessions to show why results look the way they do. Mark qualitative findings as themes, and give each result its denominator, time period, comparison group, and data-quality note. That small bit of discipline goes a long way when people start asking hard questions.
Those findings should then shape budget and policy choices.
Translate Findings into Budget and Policy Decisions
Once a gap is visible, the next step is to define the response. Every material finding should lead to a management response, an accountable owner, a time horizon, and a budget estimate. The U.S. Government Accountability Office ties accountability to leader performance on DEI progress [4]. In plain terms, a finding can’t just be noted and filed away. It needs a disposition.
Four response labels keep that process clear:
Continue when implementation is sound and outcomes are improving
Expand when results are strong and the delivery model can scale
Redesign when participation is high but outcomes are flat or differ sharply across groups
Stop or replace when repeated cycles show no meaningful benefit or the intervention produces unintended harm
Attach dollar estimates to each recommendation. If exact figures aren’t available, use ranges.
| Common finding | Management response | Illustrative budget implication |
|---|---|---|
| Representation improves at entry level but not in senior roles | Fund sponsorship, succession-planning review, promotion-process analysis, and leadership accountability | $50,000–$200,000 for diagnostic work and program design; recurring costs depend on scale |
| Promotion gap persists at one stage of the process | Audit criteria, calibration, interview panels, and manager training; test the revised process | $25,000–$100,000 for process redesign and evaluation |
| Pay gaps remain after controlling for job, level, tenure, and location | Conduct compensation review, correct inequities, and improve pay-setting governance | Correction costs may range from tens of thousands to millions depending on workforce size; legal and compensation review costs should be budgeted separately |
| Inclusion scores decline in a specific location or function | Conduct listening sessions, review manager practices, and provide targeted support | $10,000–$75,000 for diagnosis and intervention, excluding staffing changes |
| Complaint resolution is slow or uneven across groups | Add case-management capacity, service-level standards, investigator training, and escalation controls | $50,000–$250,000 annually depending on case volume and staffing |
| An intervention shows no measurable effect after multiple cycles | Redesign, pause, or reallocate resources to a better-supported approach | May reduce recurring program costs; reserve funds for transition and evaluation |
Judge budgets by incremental impact, not last year’s spend. That shift matters. A program with a long history and a big budget may still be the wrong answer, while a smaller fix at the right point in the process can move results more.
Policy reviews should be triggered by written thresholds, not by ad hoc judgment. Set those triggers in advance: a persistent subgroup gap across three reporting periods, a material decline, a large difference in process-stage conversion rates, a repeated complaint theme, or a wide gap between policy and lived experience. For each policy area - hiring, promotion, pay, flexible work, complaint handling, procurement, and leadership accountability - review both the written rule and how it works in practice.
Document each policy change with the finding, the options considered, the expected equity effect, the owner, the effective date, and the next review date. Legal review may also be needed, especially when policies touch employment decisions, protected characteristics, compensation, or data use [3].
Run the Cycle and Take Action
Launch the First Cycle and Manage Recurring Reviews
Once the reporting rules are in place, the work shifts from planning to execution. The goal is a review cycle teams can run again and again without changing the rules every quarter.
Start with the launch sequence. Confirm which DEI outcomes and decisions the system needs to support: recruiting investments, promotion-process changes, pay-equity reviews, retention interventions, or policy revisions. Then map the sources needed for those decisions. For each source, document the system of record, data steward, time span covered, update frequency, known exclusions, and permitted uses.
From there, build a metric dictionary. For every metric, define the numerator, denominator, scope, owner, and disaggregation rules. That step matters more than it may seem. Without it, teams can shift definitions between reporting periods and mistake a change in methodology for a change in the workplace.
Before launch, finish the operational checks in full: lock definitions, set privacy thresholds, test the dashboard, validate results, and approve escalation rules. Be specific about accountability. Define who receives each trigger, how fast they must respond, and when the issue comes back for review.
The recurring review cycle should follow the same pattern each time:
Refresh the data
Check data quality
Compare results against the baseline
Assign actions
Log results
Each log entry should record the issue, affected population, likely contributing factors, accountable owner, budget or policy action, due date, status, and next review date. If a promotion-rate gap appears, don't jump straight to a fix. Look at applicant pools, manager nominations, calibration outcomes, career-path access, and time in level before assigning an intervention. Then, in the next cycle, test whether that action changed the relevant leading and lagging indicators.
Review the Framework Annually and Document Changes
After the first cycle is running, use the annual review to check whether the framework still supports decisions. Review it once a year for decision value and comparability. Ask a plain question: does each metric still inform a real decision?
If a measure is consistently unreliable, redundant, or disconnected from any action the organization can take, retire it. But don't erase it. Preserve its historical values and document why it was retired. Add a new metric only when its definition, owner, source, collection method, privacy treatment, and quality checks are fully documented.
Comparability can slip away faster than teams expect. Keep a change log that records the old and new definition, effective date, reason, affected periods, comparability treatment, and approver. When possible, recast historical data under the new definition. If that can't be done, publish a clear series break and explain which comparisons still hold. Silently overwriting prior results is one of the most common ways longitudinal tracking loses credibility.
Key Takeaways and Where Council Fire Fits
Longitudinal DEI tracking works when it operates as a management cycle, not just a reporting task. Define metrics clearly, protect confidentiality, preserve comparability, report subgroup trends, and connect every material finding to a named owner, a decision, and a resource commitment. A dashboard without assigned actions and review dates may describe the organization, but it won't change it.
For organizations that need DEI measurement to support broader social-impact work, Council Fire can help connect measurement design to implementation. Council Fire can support outcome mapping, stakeholder engagement, implementation roadmaps, and governance routines that connect DEI findings to action. Internal ownership of sensitive personnel data, privacy controls, metric definitions, and accountability decisions should stay with the organization. An external partner can strengthen the operating model without taking the place of accountable leadership.
FAQs
How do we choose the right DEI metrics?
Choose DEI metrics with care. The goal isn’t to count activity for the sake of it. It’s to track whether your work is changing outcomes in ways that matter to your people, your mission, and your organization.
Start with a clear theory of change. If you don’t know how change is supposed to happen, your metrics can drift into noise - lots of data, not much meaning. A simple question helps here: What are we trying to change, for whom, and how will we know it’s working? That line of thinking keeps measurement tied to purpose.
From there, focus on indicators that are:
Relevant to your DEI goals
Reliable enough to trust over time
Feasible to collect without draining time or budget
Actionable so leaders can respond when the data points to a gap
Numbers matter, but they rarely tell the whole story on their own. Pair quantitative data with qualitative feedback to get a better read on people’s lived experience. Survey scores may show a pattern; comments, interviews, and listening sessions often explain why that pattern exists.
It also helps to disaggregate data by demographics. Looking only at averages can hide gaps in hiring, promotion, retention, pay, or belonging. When you break data out by group, you’re more likely to spot disparities that would otherwise stay buried.
What baseline period should we use?
Use a baseline that shows where your organization or program stands before the work begins. That starting point should match your program cycles and the way participants actually engage over time.
Some frameworks call for data collection right before launch. Others rely on periodic snapshots taken at set intervals. Either way, the goal is the same: get a clear picture of current conditions so later changes mean something.
Your baseline should cover core areas such as:
demographic representation
compensation equity
community impact metrics
If those pieces are missing at the start, it gets much harder to tell whether the program changed anything or just moved noise around.
How can we protect privacy in subgroup reporting?
Use ethical data practices from the start. That means getting informed consent, setting clear privacy safeguards, and making sure collection and analysis happen with care. Good governance matters here too. Privacy and security oversight help teams handle data accurately and responsibly, instead of treating those steps as an afterthought.
Keep data collection proportionate to the goal. If you don’t need it, don’t collect it. Document your sources, methods, and any limits in the data so others can understand how the work was done. When it’s time to share results, report them in aggregated form and use formats that fit the audience. The goal is simple: make findings useful without exposing sensitive identities.



FAQ