In This Article
Guide to building peer-comparison sustainability dashboards: choose peers, align data, show ranges, and assign funded actions.
Sustainability Dashboards: Peer Comparison Guide
I use peer comparisons to guide spending - not just show where we rank. I start with four to six peers, align metric definitions and reporting periods, and compare total impacts alongside per-unit measures.
In this guide, I explain how I turn those comparisons into decisions:
Choose the right peers: Keep competitors, companies with similar processes, and leaders we aim to learn from in separate groups.
Check the data: Match boundaries, units, and methods. Treat missing values as unknown, never zero.
Show the context: Display peer ranges, data-quality flags, and at least three comparable periods. Flag rankings with fewer than five compatible peers.
Fund the next step: Give each verified gap an owner, target, deadline, and funding decision.
My rule is simple: <u>check the comparison before acting on the gap</u>. Peer results inform our targets; they do not replace science, regulations, or stakeholder needs.
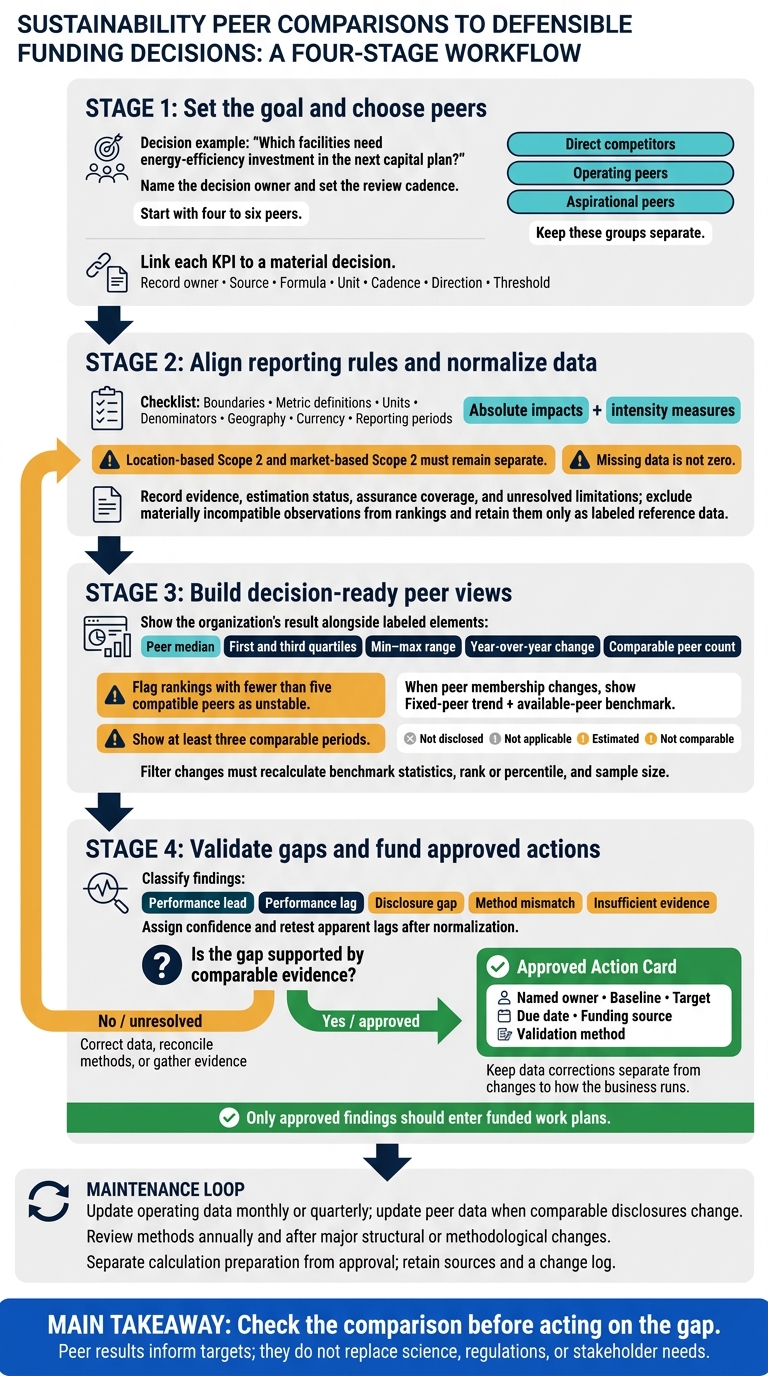
Sustainability Dashboards: From Peer Comparison to Funded Action
Step 1: Set the Goal and Choose Peers
Start with the decision the dashboard needs to support:
Which facilities need energy-efficiency investment in the next capital plan?
Name the decision owner, set the review cadence, and identify the stakeholder priorities that define the scope. Don’t let easy-to-measure metrics drive the work.[7][8] The decision question should guide both peer selection and KPI choice.
Separate Competitors, Operating Peers, and Aspirational Peers
Start with four to six peers.[6] Document your selection criteria, including product mix, processes, facility type, size, regions, ownership, and data availability.
Direct competitors sell similar products to similar customers. Operating peers run similar facilities or processes. Aspirational peers lead on practices or targets. Keep these groups separate in filters, charts, and summary statistics so the dashboard doesn’t mix unlike comparisons.
Smaller organizations should favor operating peers with similar processes over larger, diversified companies. Apply the screening rule before choosing peers, then review membership annually or after major acquisitions, divestitures, or strategy shifts.
Use a register to make peer selection auditable and repeatable.
Peer-register format - hypothetical entries only, not verified company data:
Company Peer type Industry segment Headquarters Operating regions Revenue Employees Reporting boundary Inclusion rationale Example Steel A Direct competitor Specialty steel United States North America and Europe $2.4 billion 8,500 Consolidated controlled operations Similar products, customers, and market Example Metals B Operating peer Recycled metals processing Canada North America $1.1 billion 3,200 Owned processing facilities Similar energy, water, and circularity processes Example Manufacturer C Aspirational peer Industrial equipment Germany Europe, Asia, and North America $9.8 billion 31,000 Global group, including subsidiaries Recognized for mature energy and supplier programs
For each actual entry, attach a source, publication date, reporting period, and data-quality status. Keep headquarters separate from operating regions. When converting revenue to U.S. dollars, record the exchange-rate date and method.
Use this register to build dashboard filters, summary statistics, and benchmark ranges. Once the peer set is fixed, connect each KPI to the decision it will support.
Link Each Metric to a Decision
Choose only KPIs that support a material decision:
Climate and energy: Use emissions intensity and energy per unit of output to guide decarbonization and equipment investment.
Water and circularity: Use basin-risk exposure to guide site controls and recycled-input share to guide procurement.
Workforce and safety: Use training completion to guide workforce programs and recordable incidents per 200,000 hours worked to guide safety controls.
Mark emissions intensity, energy intensity, basin-risk exposure, and injury rates as lower-is-better. Mark training completion and recycled content as higher-is-better.
For governance and disclosure, track oversight, assurance, and data completeness to show where controls fall short. Give every KPI an owner, source, formula, unit, cadence, direction, and threshold. Explain context-sensitive measures, such as turnover or water withdrawal, beside the chart. Don’t combine unrelated indicators into an unexplained score.
sbb-itb-8baf5f1
Step 2: Align Reporting Rules and Normalize Data
Once you’ve fixed the peer set, normalize the source data before benchmarking. Keep the source report, workbook, methodology note, and assurance statement with each data point. Store published and restated values separately, and flag unresolved differences. This prepares the data for peer ranges, filters, and gap flags.
Define Reporting Boundaries and KPI Methods
For each KPI, record the entities, facilities, and activities covered under the company’s consolidation approach, such as operational control, financial control, or equity share. Keep Scope 1, Scope 2, and each relevant Scope 3 category separate. Location-based Scope 2 and market-based Scope 2 must remain separate - do not rank them against each other.[9][11]
| Boundary-and-methodology field | What to record |
|---|---|
| Coverage | Company, reporting year, included entities, facilities, countries, and consolidation approach |
| Structural changes and exclusions | Treatment of joint ventures, leases, acquisitions, divestitures, franchises, outsourcing, and material exclusions |
| Method | Scope or category, formula, units, denominator, exclusions, source framework, emission factors, and factor vintage |
| Scope 2 details | Separate location-based and market-based results; electricity-market coverage, contractual instruments, and residual-mix factors |
| Data basis | Reported, estimated, or modeled; document estimation assumptions |
| Status | Reported, estimated, modeled, or missing; restated yes/no; provisional/final |
| Assurance and evidence | None, limited, or reasonable assurance; exact metrics covered; source document, page, and methodology link |
Recording these fields makes each benchmark auditable before comparison and helps prevent false rankings.
Account for Company Size and Location
Show absolute impacts beside intensity measures, not in place of them.[10] Match each denominator to the activity. Revenue intensity can fall simply because prices rise. Production intensity can change with product mix or outsourcing. Employee-based ratios depend on contractor coverage and whether headcount reflects an annual average or a year-end figure.
| Measure | Absolute value to retain | Denominator and intensity | Geographic context and remaining limits |
|---|---|---|---|
| Emissions per revenue | Metric tons of CO2e (tCO2e), with scope labeled | Revenue in $1 million; tCO2e per $1 million | Operating regions and grid mix; inflation, commodity prices, and business mix can distort results |
| Emissions per employee | tCO2e, with scope labeled | Defined employee count; tCO2e per employee | Workforce locations; contractors and automation affect comparisons |
| Output intensity | Energy in MWh; water withdrawal or consumption in cubic meters | Comparable output; energy or water per production unit | Grid, climate, regulation, and basin-level water stress; product definitions must match |
| Waste diversion | Total waste and diverted waste in metric tons | Diverted waste ÷ total waste × 100 | Local waste infrastructure |
Use consistent metric display units while preserving source units and conversion factors. Add U.S. gallons or square feet where useful, and never mix short tons with metric tons.
For revenue, record the exchange-rate source and period - usually an annual average. State whether figures are nominal or inflation-adjusted, and include the price year. Keep numerator and denominator boundaries aligned.
Match Reporting Periods and Flag Comparison Limits
Record each period’s start and end dates, fiscal- or calendar-year designation, publication date, upload date, and reporting lag. Label provisional, corrected, and restated releases separately.
If you compare a fiscal-year report with a calendar-year peer, label the mismatch. Avoid annualizing partial-year data unless the method accounts for seasonality, acquisitions, and changes in operations.
| Comparability check | Alignment required | If unresolved |
|---|---|---|
| Size and denominator | Comparable activity, output definition, and headcount method | Exclude materially mismatched intensity measures |
| Geography | Identify grid, climate, regulation, and basin water stress | Use regional groups or a visible caveat |
| Boundary | Align included operations, consolidation approach, and exclusions | Exclude materially incompatible coverage |
| Currency | Consistent conversion period and nominal or real-dollar basis | Recalculate before ranking |
| Period | Compare aligned periods; disclose start and end dates | Retain mismatched periods as labeled reference data |
| Metric definition | Match emissions scope, Scope 2 method, water measure, and waste treatment | Exclude incompatible definitions |
| Data quality and assurance | Identify estimates, uncertainty, assurance level, and assurance coverage | Flag limitations; exclude unreliable observations |
Keep excluded observations only as labeled reference data. Missing data is not zero. Use aligned periods and visible limitation flags when building dashboard peer ranges, so users don’t mistake reporting mismatches for trends.
Step 3: Build Peer Comparison Views
Once the data are aligned, build each page around one decision, such as where to prioritize emissions reductions. Place that decision above the chart, followed by the comparison basis, benchmark, and trend. Include a compact metadata panel covering the metric definition, denominator, unit, boundary, source, assurance level, estimation status, and limits. Link supporting documents through an evidence register.
Keep metric definitions and boundary labels consistent across the chart, table, and trend line.
Show Peer Results and Benchmark Ranges
Display the organization’s result alongside the peer median, first and third quartiles, min–max range, year-over-year change, and comparable peer count. For skewed data, use medians and quartiles as the main benchmark, with a dot plot or quartile band to show the distribution. Name the peer set, explain whether higher or lower values are better, and flag rankings based on fewer than five compatible peers as unstable.
Place a drill-down table below the chart. Make the denominator, assurance level, and estimation status clear rather than relying on a generic “assured” badge.
Hypothetical table structure; values are illustrative only.
Company Metric definition Absolute value Intensity value Units Reporting period Boundary Source Data-quality status Organization A Scope 1 and 2 market-based emissions 120,000 0.42 metric tons CO₂e; metric tons CO₂e per $1 million revenue FY2024 Operational control; consolidated operations Sustainability report, p. 84 Externally assured Peer B Scope 1 and 2 market-based emissions 95,000 0.38 metric tons CO₂e; metric tons CO₂e per $1 million revenue FY2024 Operational control; consolidated operations Sustainability report, p. 61 Limited assurance Peer C Scope 1 and 2 emissions; method not fully specified 140,000 Not disclosed metric tons CO₂e FY2023 Boundary unavailable Regulatory filing Company-reported; comparability limited
Follow the current benchmark with a view of how the metric has changed over time.
Show Trends, Filters, and Data Gaps
Show at least three comparable periods. When peer membership changes, display a fixed-peer trend alongside the available-peer benchmark so readers can separate changes in the sample from actual performance improvement. Annotate acquisitions, divestitures, facility closures, boundary changes, methodology changes, emission-factor updates, and restatements directly on the trend. Report changes in both units and percentages.
Hypothetical trend layout; intensity values are illustrative only, in metric tons CO₂e per $1 million revenue.
Reporting period Organization value Peer median Comparable peer count Data-availability note Change note FY2022 0.51 0.47 8 Complete Baseline FY2023 0.46 0.45 8 Peer D missing Renewable-energy procurement expanded FY2024 0.42 0.43 7 Peer C boundary unavailable Acquisition added; prior year restated
Provide filters for peer type, region, company size, reporting year, boundary, metric, assurance level, and data-availability status. Every filter change must recalculate benchmark statistics, rank or percentile, and sample size. Display active filters in the chart title and keep a reset option for the approved peer set.
Label not disclosed, not applicable, estimated, and not comparable separately. Break trend lines wherever values are missing, and report disclosure completeness separately from measured performance.
Step 4 and Conclusion: Assign Actions and Maintain Controls
Once the dashboard shows a gap supported by evidence, assign an owner, set a deadline, and make a funding decision.
Check Performance Gaps and Assign Actions
Classify each dashboard finding as a performance lead, performance lag, disclosure gap, method mismatch, or insufficient evidence. Assign a confidence level before setting priorities. Before labeling a finding as a lag, retest whether the gap holds after normalization. Gather employee, supplier, and community input to help set priorities - a ranking alone does not explain the cause.
Rank validated gaps by impact, alignment with business goals, stakeholder expectations, cost, feasibility, and implementation time. Give each priority a named owner, baseline, target, due date, funding source, and validation method. Keep data corrections separate from changes to how the business runs. Verify results using the same baseline and method shown in the dashboard.
Set Dashboard Ownership and Review Checks
Use a release checklist that covers KPI ownership, calculation review, source retention, publication approval, version history, and data that cannot be compared. Before approval, check unit conversions, denominators, treatment of missing values, period alignment, and statistical settings. Assign calculation preparation and approval to separate people; external assurance does not replace management controls.[10]
Update operating data monthly or quarterly, and update peer data when comparable disclosures change. Review methods annually and after acquisitions, divestitures, major facility changes, boundary revisions, or metric redesigns.[4][5] Keep a change log with the original and revised values, the reason for each change, its date, and the approver. Hold publication or lower confidence when a material source is missing or a peer’s methodology cannot be reconciled. Only approved findings should enter funded work plans.
Turn Findings Into Funded Work Plans
Build work plans that specify capital costs, operating costs, milestones, dependencies, and accountable leaders. Base funding decisions on relevant peers, aligned boundaries, careful normalization, and disclosed uncertainty. These checks should support stakeholder judgment, not replace it.
FAQs
What if I can’t find enough comparable peers?
When peer data is limited, focus on commonly reported metrics: Scope 1 and 2 emissions, safety records, and board diversity. If individual company reports fall short, use aggregated benchmarks from industry initiatives or associations.
Fill data gaps with estimates from CDP or ESG rating agency databases. Consider sharing your methodology, too, so others can benchmark against your organization and understand the basis for comparison.
How can I tell whether a peer gap is meaningful?
A peer gap matters only when metric definitions, reporting boundaries, and units match and the values have been checked - for example, by at least two people. Where appropriate, account for size differences with consistent intensity ratios.
Separate actual performance changes from changes in KPI definitions, units, or reporting boundaries. Log those changes and restate the data if they are material. Don't act on gaps caused by inconsistent data until the data is consistent [1][2][3].
How should I prioritize improvements on a tight budget?
Focus on materiality: score topics based on their impact on enterprise value and your ability to influence them. Begin with core climate and safety metrics, then add social or supply chain impacts as data quality improves.
Use an impact-effort matrix to find initiatives with high returns and low effort. Give priority to areas you directly control. These often produce faster, more measurable results while using fewer resources.




FAQ