
Aug 13, 2026
ESG Peer Benchmarking: Ultimate Guide
ESG Strategy
In This Article
Practical steps to build decision-ready ESG peer benchmarks: set objectives, choose peers, map metrics, ensure data quality, score, and assign actions.
ESG Peer Benchmarking: Ultimate Guide
If your ESG benchmark does not lead to a board decision, budget shift, or target change, it is just extra reporting. I’d sum up the article this way: define the decision first, pick peers with care, line up metrics across frameworks, clean the data, use a simple scoring model, and turn the results into named actions with deadlines.
Here’s the full article in one plain-language view:
Start with the purpose. I need one clear sentence for what the benchmark will support, such as board review, capital planning, risk management, or annual reporting.
Set ownership and controls early. One owner, a cross-functional review group, two-person checks, version control, and a yearly cycle with quarterly refreshes keep the work tight.
Limit the metrics. The article points to 15 to 30 metrics across E, S, and G, chosen from material topics like emissions, water, safety, labor, board independence, and supply chain risk.
Choose peers that match the job. Use filters such as sub-industry, geography, revenue range, business model, and disclosure quality. A common setup is 5 to 7 direct peers plus 5 to 10 context peers.
Map disclosures before scoring. I should use a master matrix to align SASB/ISSB, GRI, TCFD, CSRD/ESRS, CDP, and similar sources so I am not comparing mismatched definitions.
Check data quality. The article focuses on four checks: definition clarity, boundary alignment, unit consistency, and validation status.
Keep scoring readable. Use z-scores, percentile ranks, and pass/fail inputs, then roll them into a 0–100 scale with plain labels such as lagging, developing, strong, and leading.
Do not over-focus on weights. The article notes that 56% of ESG rating divergence comes from measurement differences, while only 6% comes from weighting.
Build outputs for decisions, not display. The board package should show peer median, top quartile, 3 to 5 headline metrics, trend lines across 3 to 5 cycles, and the few gaps that need action.
End with owners and deadlines. Every gap should tie to a person, timeline, milestones, and an investment range.
A quick contrast helps:
Item | External ESG ratings | Internal ESG peer benchmarking |
|---|---|---|
Main use | Market signal | Internal decisions |
Method | Proprietary | Company-defined |
Data | Public disclosures | Internal + external data |
Output | Score or rank | Gap list and action plan |
Bottom line: I would treat ESG peer benchmarking as a decision tool, not a branding exercise. The article’s main point is simple: the best benchmark is narrow, clean, comparable, and tied to action.
Set objectives, scope, and governance before comparing peers
Once the decision is clear, set the benchmark's scope, owner, and controls before you line up peer data. That early work decides which peers belong, which metrics matter, and what should stay out.
Choose the decisions the benchmark should support
The decision behind the benchmark shapes the whole model. A benchmark built for board reporting will not look the same as one built for capital allocation or transition planning.
Start with one plain-English objective sentence before you build anything. For example: "Support the board's annual ESG review by comparing our performance against five direct peers on our top 10 material topics." That single sentence does a lot of work. It cuts out extra metrics, keeps the project from sprawling, and gives the team a shared target.
For U.S. organizations, the five most common decision types are board oversight, transition planning, capital allocation, ERM, and annual sustainability reporting. Each one calls for a different output. You may need scenario analysis, risk heat maps, or board scorecards depending on the use case.
Assign ownership, cadence, and controls
Give one person clear accountability. In many U.S. companies, that sits with the CFO or Chief Sustainability Officer. The sustainability team usually handles data collection, peer selection, and scoring. A cross-functional steering group - Finance, Risk, Operations, HR, Legal, and Investor Relations - should meet quarterly or twice a year to review the method and check findings before anything reaches the board.
Use a two-person review for every data point before it enters the benchmark. Back that up with a data inventory that shows who collects each metric, where it lives, and how often someone checks it. If anyone later asks, “Where did this number come from?” you’ll have an answer on hand.
Run one full benchmark each year, timed to the sustainability report or annual report cycle. Refresh fast-moving metrics every quarter. Each cycle should cover data validation, method review, and sign-off. Keep version-controlled copies of your method documents, and archive peer disclosures - CDP responses, 10-Ks, and sustainability reports - with dates and source references tagged clearly.
Focus the analysis on material ESG topics
Too many KPIs blur the picture. Before comparing peers, narrow the field.
Start with SASB, GRI, or TCFD sector guidance, then screen those topics against your own risks and mission. Across industries, common high-priority topics include:
Scope 1–3 emissions
Water use intensity
Total recordable incident rates
Labor practices
Board independence
Supply chain risk
Community impact
Score each topic on two factors: how much it affects enterprise value or mission outcomes, and how much your organization can influence it. Topics that rank high on both should make the cut.
A good target is 15 to 30 metrics across E, S, and G. Many teams do better with a phased rollout. Phase 1 can cover core climate, safety, and governance metrics. Phase 2 can add supply chain and social impact metrics once data quality gets better. Only material topics should move forward into peer selection and metric mapping. That keeps the benchmark tight and sets up the next step cleanly.
Select the right peers and map the right metrics
Build a peer group that is comparable and decision-useful
Good benchmarking starts with peer selection. Get that part wrong, and everything that follows gets shaky. A weak peer set can create fake gaps, hide actual issues, and push boards, investors, and management teams toward bad target-setting decisions.
Use five concrete filters when building the group:
sub-industry classification, not broad sector labels
operating geography
revenue band
business model similarity
reporting quality
For most U.S. companies, keeping peers within one order of magnitude of your revenue helps limit size-related distortion [6][1].
A practical setup is to use 5 to 7 core direct peers for scoring, plus 5 to 10 regional or regulatory exemplars for context. The first group should drive scoring. The second should help interpret the results.
Peer Type | Relevance | Data Availability | Best Used For |
|---|---|---|---|
Direct Peers | High - same sub-industry and business model | Moderate - depends on public disclosure | Competitive positioning and performance gaps |
Regional Peers | Moderate - shared geography and regulatory context | High - local regulatory filings | Operational benchmarking and state-level policy context |
Regulatory Exemplars | High - subject to stricter mandates (e.g., CSRD) | High - mandated public reports | Stronger disclosure design and governance gaps |
Best-in-Class Leaders | Low to moderate - may differ in size or sector | High - detailed sustainability reporting | Long-term strategic ambition and innovation targets |
One simple reporting-quality screen can save a lot of pain later. Check whether each peer publishes quantitative metrics for at least two reporting years and cites a known framework such as GRI, SASB/ISSB, or TCFD. If a peer fails that test, the scoring model will likely be full of holes before you even begin.
With the peer set locked in, the next step is to standardize disclosures before scoring.
Map metrics across frameworks and reporting standards
Now comes the messy part: making unlike disclosures line up. Companies rarely report the same metric in the same way. One may report Scope 2 emissions using a market-based method, while another uses location-based. If you skip a mapping layer, you end up comparing apples to oranges.
The fix is a master disclosure matrix. Think of it as the control panel for your reporting work. Rows list your core ESG topics. Columns cover each framework or taxonomy you track: GRI, ISSB IFRS S1/S2, CSRD/ESRS, SASB, and selected rating methods such as CDP or MSCI. Each cell should show whether the disclosure is required, recommended, or optional, along with any differences in scope or definition [3][4].
A single metric like Scope 1 GHG emissions can map to GRI, ISSB IFRS S2, CSRD ESRS E1-6, CDP, and SASB [8][9]. Build that crosswalk once, and you won't have to rebuild it every reporting cycle. That saves time and keeps peer comparisons steady from one cycle to the next.
Tag each row with both a data owner and a source system. For example, Finance may own energy and emissions data, HR may own labor metrics, and Legal may own governance indicators. That makes accountability clear from day one [7][5]. It also helps to note which disclosures peers usually provide and where leading reporters go past the minimum. That gap can feed straight into your next round of priority-setting.
Once the crosswalk is in place, check each metric before scoring.
Improve data quality before scoring
Before calculating any peer score, run every metric through four checks: definition clarity, boundary alignment, unit consistency, and validation status [5][7].
Definition clarity means each metric has a written explanation of what is included, what is excluded, and how it is measured. Boundary alignment means your organizational scope is documented and applied the same way for each peer. Unit consistency means emissions are reported in metric tons CO₂e, energy in kWh or MWh, and financial figures in U.S. dollars. Validation status means each data point has gone through a two-person review before it enters the model. That extra set of eyes helps catch unit mix-ups and scope errors that one person can easily miss [2].
When peer data is missing or estimated, document the gap plainly. Don't quietly fill it and hope no one notices. If you use an estimate method, use it only for missing values and flag those cells in the matrix so reviewers can see where uncertainty is higher.
Version control matters here too. Track each matrix change with a timestamp, approver, and rationale [7][5]. That audit trail can make all the difference when a board member or external auditor asks why a figure changed from one cycle to the next.
Design a scoring model that makes peer comparisons usable
Internal ESG Peer Benchmarking vs. External ESG Ratings: Key Differences
After you map and check the metrics, the next job is to turn them into scores that boards and executives can scan in seconds. The trick is simple: keep the model easy to read without smoothing over gaps that matter.
Choose a normalization and weighting approach
Raw ESG metrics show up in different units - metric tons of CO₂e, injury rates per 200,000 work hours, and percentages of independent directors. You can’t compare peers in any clean way until those numbers sit on the same scale.
A practical setup is to use:
Z-scores for continuous metrics
Percentile ranks for peer position
Pass/fail scoring for policy indicators
From there, all three can roll into a single 0–100 scale for final presentation.
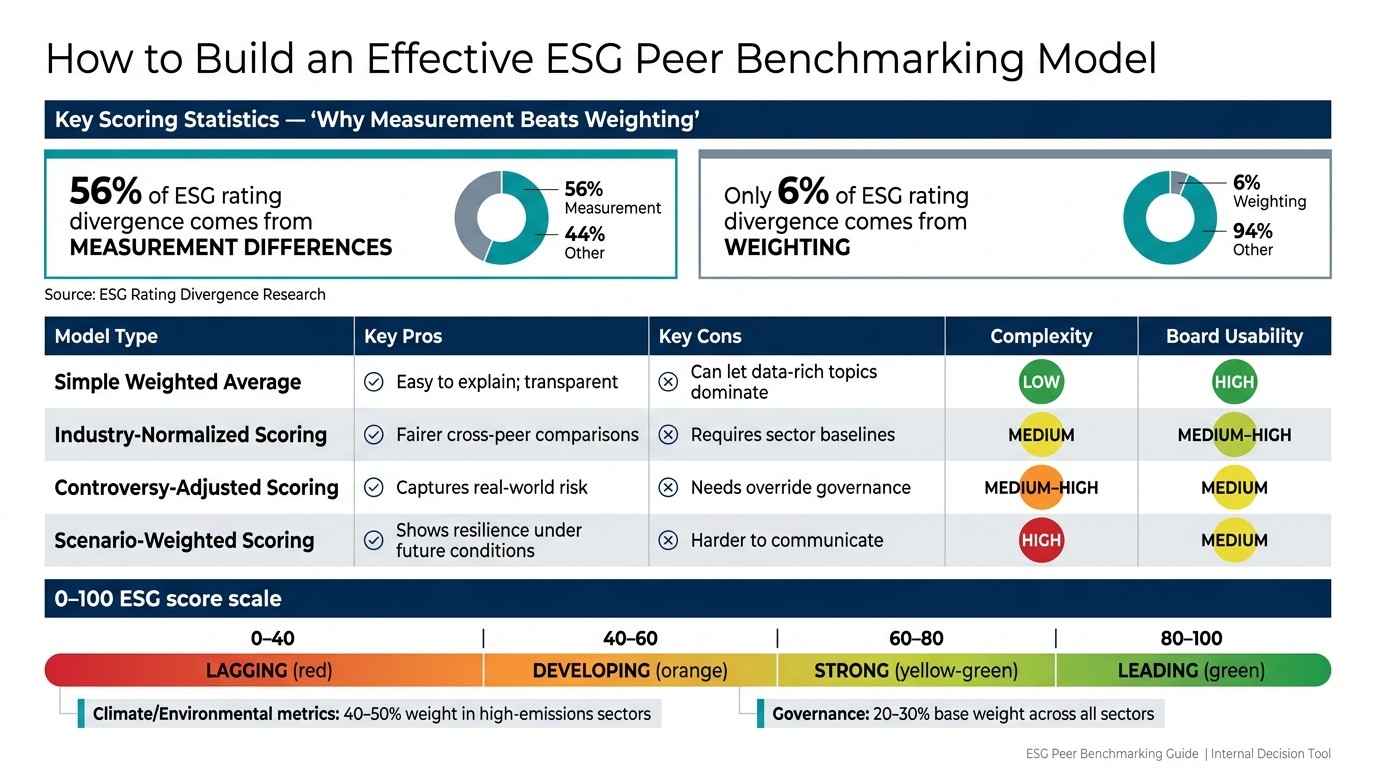
Weights should follow the same materiality ranking you already set. In high-emissions sectors like utilities or oil and gas, climate and other environmental metrics often make up 40%–50% of the total score. Governance usually carries a 20%–30% base weight across sectors. Research shows that measurement differences account for 56% of ESG rating divergence across providers, while weighting explains only 6% [11][10]. That’s a big clue. Indicator definitions and data treatment matter far more than tweaking the weight table by a few points.
Roll topic scores into E, S, G, and overall results
Roll each metric into topic scores, then into pillar scores, and then into one overall ESG result on a 0–100 scale. Clear labels help boards read the output fast: lagging (0–40), developing (40–60), strong (60–80), and leading (80–100).
Controversies can sit inside the model as score deductions or as a separate overlay. For example, MSCI applies controversy deductions ranging from 0 to –5.0 points from management scores based on severity [13][14]. That kind of adjustment helps the score reflect what’s happening outside the spreadsheet.
Some governance inputs are harder to measure with raw data alone. Leadership tone, board culture, or the credibility of transition plans often need a structured analyst rubric. A 1–5 scale works well here. You score the factor, convert it into a numeric value, and blend it into the governance topic score. If an analyst makes an override, log it in writing and review it on a fixed schedule. Otherwise, the model can drift, and no one will remember why.
Missing data needs the same discipline. You can treat it as a penalty, an estimate, or a reweighted exclusion, but the method should be stated plainly. Clarity AI, for instance, assigns missing high-relevance data a score at the 1st percentile of the industry distribution [12].
Compare simple and advanced internal scoring models
Model complexity should match the decision you’re trying to support. A board scorecard should be plain and fast to read. A capital-allocation model can carry more moving parts.
Model Type | Key Pros | Key Cons | Complexity | Board Usability |
|---|---|---|---|---|
Simple weighted average | Easy to explain; quick to implement; fully transparent | Less effective at handling sector differences; can let data-rich topics dominate; limited treatment of controversies | Low | High |
Industry-normalized scoring | Fairer cross-peer comparisons; reflects sector realities | Requires sector baselines and ongoing recalibration | Medium | Medium–High |
Controversy-adjusted scoring | Captures real-world risk; improves credibility with risk committees | Needs robust controversy categories and override governance | Medium–High | Medium |
Scenario-weighted scoring | Shows resilience under future conditions like carbon pricing or labor regulation | Requires modeling expertise; harder to communicate | High | Medium |
Use the least complex model that still does the job. If a simple weighted average gives leaders a clear view for target-setting, investment choices, or board oversight, start there. Add more layers only when they improve peer comparison or sharpen risk insight.
Turn benchmark results into board-ready outputs and action plans
Once scoring and normalization are done, the work shifts from analysis to decision-making. Benchmark results need to move fast from spreadsheet to boardroom. If leaders can't read the story in a few minutes, the model won't shape budgets, policy, or operating plans.
Build a board-ready ESG benchmarking package
The first deliverable should be a board package that makes peer comparison easy to scan. A strong package includes five parts: a one-page ESG dashboard, a peer gap summary, a material risks and opportunities section, a trend view, and a plain-language summary of budget, operating, and governance effects. Each page should answer the same four questions directors tend to ask: Where do we stand, is it improving, does it matter, and what should we do next?
The one-page dashboard should show the overall ESG score against the peer median and top quartile, along with 3 to 5 headline metrics tied straight to the business. It should also include color-coded pillar scores for Environment, Social, and Governance. Use U.S. number formatting - for example, 1.25 million metric tons of CO₂e. Traffic-light indicators and trend arrows across 3 to 5 reporting cycles help directors get oriented in under five minutes.
The peer gap summary should then turn the numbers into plain English. For example:
"We are in the top quartile for renewable energy procurement but bottom quartile for supplier ESG disclosure, with a peer median disclosure rate of 75% vs. our current rate of 42%."
Match the format to the decision at hand.
Format | Audience | Depth | Decision Use |
|---|---|---|---|
Dashboard summary | Board of directors, C-suite, and oversight committees | Highly aggregated KPIs | Rapid oversight, trend direction, decisions needed this quarter |
Detailed diagnostic report | ESG, sustainability, finance, risk, HR, supply chain, operations, and internal audit teams | Full metric breakdown | Root-cause analysis, program design, budget proposals |
Scenario-based decision brief | Board strategy committees, investment committees, and executives responsible for capital allocation | Selective but deep | Capital allocation, emissions pathway choices, governance reforms |
Board materials should stay tight. Focus on material variances, business impact, and the decisions that need approval. Skip the full KPI dump. Nobody wants to dig through 40 pages just to find the one issue that needs a vote.
Use benchmark gaps to set priorities and investments
Once the board can see the gaps, the next step is ownership. Each material gap should be tied to a named owner, a deadline, key milestones, and an investment range. That's how a benchmark turns into a work plan instead of a slide deck.
Typical actions may include:
Energy upgrades
Water reuse
Workforce programs
Supplier engagement
Governance changes
Comparison only changes behavior when someone owns the next move and there is a clear path to follow-through.
That closes the loop from comparison to execution.
Conclusion: The essentials of effective ESG peer benchmarking
Effective ESG peer benchmarking ends in action: clear owners, specific timelines, and a regular review cadence. The value comes from disciplined follow-through, not the comparison itself.
FAQs
How do I choose the right ESG peers?
Choose ESG peers based on your company’s material issues and reporting goals. Start with industry leaders and direct competitors. Look at what they disclose, which frameworks they use, and how far their reporting has developed.
Stick with peers in your sector that face similar operating pressures, like high energy use or a tangled supply chain. That keeps your benchmarking grounded in the day-to-day reality of your business and makes the results more useful for stakeholders.
What metrics should an ESG benchmark include?
Include metrics tied to your materiality assessment and your industry, with a clear focus on the ESG issues that matter most to your organization and stakeholders. That keeps reporting grounded in what people actually care about, instead of turning it into a data dump.
Common categories usually include:
Environmental: Scope 1, 2, and 3 emissions, energy use, water use, waste, and renewable energy
Social: headcount, demographics, diversity, safety, training, and labor audits
Governance: board oversight, pay alignment with ESG goals, and compliance
To make the numbers easier to compare across time periods, business units, or peers, use intensity ratios alongside absolute figures. Pair those metrics with relevant frameworks so readers can evaluate performance on a like-for-like basis.
How often should ESG peer benchmarks be updated?
ESG peer benchmarking works best as a regular discipline, not a one-and-done task. Industry standards shift. Macro trends move. Methodologies change. If you benchmark once and leave it on the shelf, the picture gets old fast.
For most organizations, the right cadence is to review peer benchmarks annually and check internal data and progress quarterly. That rhythm helps teams spot trends early, catch anomalies before they turn into bigger issues, and respond to changing stakeholder and regulatory expectations with better timing.
Related Blog Posts
Latest Articles
©2025

Narrative Change and Power Building: The Missing Half of Advocacy
Narrative change is the process of disrupting dominant narratives that normalize inequity and advancing new narratives from historically marginalized communities.

Funding Resilience Without Federal Grants
BRIC is unreliable and FEMA is shrinking. Here's how cities fund climate resilience with dedicated revenue, blended finance, and a coordinating authority.

The ESG Blind Spot: How AI Is Finding Risks in Companies Nobody Else Is Watching
Norway's sovereign wealth fund uses AI to screen 7,200 portfolio companies for forced labor and corruption within 24 hours. The real story is the emerging-market coverage gap that traditional ESG data vendors miss — and what it means for any company with a global supply chain.
Narrative Change and Power Building: The Missing Half of Advocacy
Narrative change is the process of disrupting dominant narratives that normalize inequity and advancing new narratives from historically marginalized communities.
Funding Resilience Without Federal Grants
BRIC is unreliable and FEMA is shrinking. Here's how cities fund climate resilience with dedicated revenue, blended finance, and a coordinating authority.
The ESG Blind Spot: How AI Is Finding Risks in Companies Nobody Else Is Watching
Norway's sovereign wealth fund uses AI to screen 7,200 portfolio companies for forced labor and corruption within 24 hours. The real story is the emerging-market coverage gap that traditional ESG data vendors miss — and what it means for any company with a global supply chain.
FAQ
01
What does it really mean to “redefine profit”?
02
What makes Council Fire different?
03
Who does Council Fire work with?
04
What does working with Council Fire actually look like?
05
How does Council Fire help organizations turn big goals into action?
06
How does Council Fire define and measure success?
Aug 13, 2026
ESG Peer Benchmarking: Ultimate Guide
ESG Strategy
In This Article
Practical steps to build decision-ready ESG peer benchmarks: set objectives, choose peers, map metrics, ensure data quality, score, and assign actions.
ESG Peer Benchmarking: Ultimate Guide
If your ESG benchmark does not lead to a board decision, budget shift, or target change, it is just extra reporting. I’d sum up the article this way: define the decision first, pick peers with care, line up metrics across frameworks, clean the data, use a simple scoring model, and turn the results into named actions with deadlines.
Here’s the full article in one plain-language view:
Start with the purpose. I need one clear sentence for what the benchmark will support, such as board review, capital planning, risk management, or annual reporting.
Set ownership and controls early. One owner, a cross-functional review group, two-person checks, version control, and a yearly cycle with quarterly refreshes keep the work tight.
Limit the metrics. The article points to 15 to 30 metrics across E, S, and G, chosen from material topics like emissions, water, safety, labor, board independence, and supply chain risk.
Choose peers that match the job. Use filters such as sub-industry, geography, revenue range, business model, and disclosure quality. A common setup is 5 to 7 direct peers plus 5 to 10 context peers.
Map disclosures before scoring. I should use a master matrix to align SASB/ISSB, GRI, TCFD, CSRD/ESRS, CDP, and similar sources so I am not comparing mismatched definitions.
Check data quality. The article focuses on four checks: definition clarity, boundary alignment, unit consistency, and validation status.
Keep scoring readable. Use z-scores, percentile ranks, and pass/fail inputs, then roll them into a 0–100 scale with plain labels such as lagging, developing, strong, and leading.
Do not over-focus on weights. The article notes that 56% of ESG rating divergence comes from measurement differences, while only 6% comes from weighting.
Build outputs for decisions, not display. The board package should show peer median, top quartile, 3 to 5 headline metrics, trend lines across 3 to 5 cycles, and the few gaps that need action.
End with owners and deadlines. Every gap should tie to a person, timeline, milestones, and an investment range.
A quick contrast helps:
Item | External ESG ratings | Internal ESG peer benchmarking |
|---|---|---|
Main use | Market signal | Internal decisions |
Method | Proprietary | Company-defined |
Data | Public disclosures | Internal + external data |
Output | Score or rank | Gap list and action plan |
Bottom line: I would treat ESG peer benchmarking as a decision tool, not a branding exercise. The article’s main point is simple: the best benchmark is narrow, clean, comparable, and tied to action.
Set objectives, scope, and governance before comparing peers
Once the decision is clear, set the benchmark's scope, owner, and controls before you line up peer data. That early work decides which peers belong, which metrics matter, and what should stay out.
Choose the decisions the benchmark should support
The decision behind the benchmark shapes the whole model. A benchmark built for board reporting will not look the same as one built for capital allocation or transition planning.
Start with one plain-English objective sentence before you build anything. For example: "Support the board's annual ESG review by comparing our performance against five direct peers on our top 10 material topics." That single sentence does a lot of work. It cuts out extra metrics, keeps the project from sprawling, and gives the team a shared target.
For U.S. organizations, the five most common decision types are board oversight, transition planning, capital allocation, ERM, and annual sustainability reporting. Each one calls for a different output. You may need scenario analysis, risk heat maps, or board scorecards depending on the use case.
Assign ownership, cadence, and controls
Give one person clear accountability. In many U.S. companies, that sits with the CFO or Chief Sustainability Officer. The sustainability team usually handles data collection, peer selection, and scoring. A cross-functional steering group - Finance, Risk, Operations, HR, Legal, and Investor Relations - should meet quarterly or twice a year to review the method and check findings before anything reaches the board.
Use a two-person review for every data point before it enters the benchmark. Back that up with a data inventory that shows who collects each metric, where it lives, and how often someone checks it. If anyone later asks, “Where did this number come from?” you’ll have an answer on hand.
Run one full benchmark each year, timed to the sustainability report or annual report cycle. Refresh fast-moving metrics every quarter. Each cycle should cover data validation, method review, and sign-off. Keep version-controlled copies of your method documents, and archive peer disclosures - CDP responses, 10-Ks, and sustainability reports - with dates and source references tagged clearly.
Focus the analysis on material ESG topics
Too many KPIs blur the picture. Before comparing peers, narrow the field.
Start with SASB, GRI, or TCFD sector guidance, then screen those topics against your own risks and mission. Across industries, common high-priority topics include:
Scope 1–3 emissions
Water use intensity
Total recordable incident rates
Labor practices
Board independence
Supply chain risk
Community impact
Score each topic on two factors: how much it affects enterprise value or mission outcomes, and how much your organization can influence it. Topics that rank high on both should make the cut.
A good target is 15 to 30 metrics across E, S, and G. Many teams do better with a phased rollout. Phase 1 can cover core climate, safety, and governance metrics. Phase 2 can add supply chain and social impact metrics once data quality gets better. Only material topics should move forward into peer selection and metric mapping. That keeps the benchmark tight and sets up the next step cleanly.
Select the right peers and map the right metrics
Build a peer group that is comparable and decision-useful
Good benchmarking starts with peer selection. Get that part wrong, and everything that follows gets shaky. A weak peer set can create fake gaps, hide actual issues, and push boards, investors, and management teams toward bad target-setting decisions.
Use five concrete filters when building the group:
sub-industry classification, not broad sector labels
operating geography
revenue band
business model similarity
reporting quality
For most U.S. companies, keeping peers within one order of magnitude of your revenue helps limit size-related distortion [6][1].
A practical setup is to use 5 to 7 core direct peers for scoring, plus 5 to 10 regional or regulatory exemplars for context. The first group should drive scoring. The second should help interpret the results.
Peer Type | Relevance | Data Availability | Best Used For |
|---|---|---|---|
Direct Peers | High - same sub-industry and business model | Moderate - depends on public disclosure | Competitive positioning and performance gaps |
Regional Peers | Moderate - shared geography and regulatory context | High - local regulatory filings | Operational benchmarking and state-level policy context |
Regulatory Exemplars | High - subject to stricter mandates (e.g., CSRD) | High - mandated public reports | Stronger disclosure design and governance gaps |
Best-in-Class Leaders | Low to moderate - may differ in size or sector | High - detailed sustainability reporting | Long-term strategic ambition and innovation targets |
One simple reporting-quality screen can save a lot of pain later. Check whether each peer publishes quantitative metrics for at least two reporting years and cites a known framework such as GRI, SASB/ISSB, or TCFD. If a peer fails that test, the scoring model will likely be full of holes before you even begin.
With the peer set locked in, the next step is to standardize disclosures before scoring.
Map metrics across frameworks and reporting standards
Now comes the messy part: making unlike disclosures line up. Companies rarely report the same metric in the same way. One may report Scope 2 emissions using a market-based method, while another uses location-based. If you skip a mapping layer, you end up comparing apples to oranges.
The fix is a master disclosure matrix. Think of it as the control panel for your reporting work. Rows list your core ESG topics. Columns cover each framework or taxonomy you track: GRI, ISSB IFRS S1/S2, CSRD/ESRS, SASB, and selected rating methods such as CDP or MSCI. Each cell should show whether the disclosure is required, recommended, or optional, along with any differences in scope or definition [3][4].
A single metric like Scope 1 GHG emissions can map to GRI, ISSB IFRS S2, CSRD ESRS E1-6, CDP, and SASB [8][9]. Build that crosswalk once, and you won't have to rebuild it every reporting cycle. That saves time and keeps peer comparisons steady from one cycle to the next.
Tag each row with both a data owner and a source system. For example, Finance may own energy and emissions data, HR may own labor metrics, and Legal may own governance indicators. That makes accountability clear from day one [7][5]. It also helps to note which disclosures peers usually provide and where leading reporters go past the minimum. That gap can feed straight into your next round of priority-setting.
Once the crosswalk is in place, check each metric before scoring.
Improve data quality before scoring
Before calculating any peer score, run every metric through four checks: definition clarity, boundary alignment, unit consistency, and validation status [5][7].
Definition clarity means each metric has a written explanation of what is included, what is excluded, and how it is measured. Boundary alignment means your organizational scope is documented and applied the same way for each peer. Unit consistency means emissions are reported in metric tons CO₂e, energy in kWh or MWh, and financial figures in U.S. dollars. Validation status means each data point has gone through a two-person review before it enters the model. That extra set of eyes helps catch unit mix-ups and scope errors that one person can easily miss [2].
When peer data is missing or estimated, document the gap plainly. Don't quietly fill it and hope no one notices. If you use an estimate method, use it only for missing values and flag those cells in the matrix so reviewers can see where uncertainty is higher.
Version control matters here too. Track each matrix change with a timestamp, approver, and rationale [7][5]. That audit trail can make all the difference when a board member or external auditor asks why a figure changed from one cycle to the next.
Design a scoring model that makes peer comparisons usable
Internal ESG Peer Benchmarking vs. External ESG Ratings: Key Differences
After you map and check the metrics, the next job is to turn them into scores that boards and executives can scan in seconds. The trick is simple: keep the model easy to read without smoothing over gaps that matter.
Choose a normalization and weighting approach
Raw ESG metrics show up in different units - metric tons of CO₂e, injury rates per 200,000 work hours, and percentages of independent directors. You can’t compare peers in any clean way until those numbers sit on the same scale.
A practical setup is to use:
Z-scores for continuous metrics
Percentile ranks for peer position
Pass/fail scoring for policy indicators
From there, all three can roll into a single 0–100 scale for final presentation.
Weights should follow the same materiality ranking you already set. In high-emissions sectors like utilities or oil and gas, climate and other environmental metrics often make up 40%–50% of the total score. Governance usually carries a 20%–30% base weight across sectors. Research shows that measurement differences account for 56% of ESG rating divergence across providers, while weighting explains only 6% [11][10]. That’s a big clue. Indicator definitions and data treatment matter far more than tweaking the weight table by a few points.
Roll topic scores into E, S, G, and overall results
Roll each metric into topic scores, then into pillar scores, and then into one overall ESG result on a 0–100 scale. Clear labels help boards read the output fast: lagging (0–40), developing (40–60), strong (60–80), and leading (80–100).
Controversies can sit inside the model as score deductions or as a separate overlay. For example, MSCI applies controversy deductions ranging from 0 to –5.0 points from management scores based on severity [13][14]. That kind of adjustment helps the score reflect what’s happening outside the spreadsheet.
Some governance inputs are harder to measure with raw data alone. Leadership tone, board culture, or the credibility of transition plans often need a structured analyst rubric. A 1–5 scale works well here. You score the factor, convert it into a numeric value, and blend it into the governance topic score. If an analyst makes an override, log it in writing and review it on a fixed schedule. Otherwise, the model can drift, and no one will remember why.
Missing data needs the same discipline. You can treat it as a penalty, an estimate, or a reweighted exclusion, but the method should be stated plainly. Clarity AI, for instance, assigns missing high-relevance data a score at the 1st percentile of the industry distribution [12].
Compare simple and advanced internal scoring models
Model complexity should match the decision you’re trying to support. A board scorecard should be plain and fast to read. A capital-allocation model can carry more moving parts.
Model Type | Key Pros | Key Cons | Complexity | Board Usability |
|---|---|---|---|---|
Simple weighted average | Easy to explain; quick to implement; fully transparent | Less effective at handling sector differences; can let data-rich topics dominate; limited treatment of controversies | Low | High |
Industry-normalized scoring | Fairer cross-peer comparisons; reflects sector realities | Requires sector baselines and ongoing recalibration | Medium | Medium–High |
Controversy-adjusted scoring | Captures real-world risk; improves credibility with risk committees | Needs robust controversy categories and override governance | Medium–High | Medium |
Scenario-weighted scoring | Shows resilience under future conditions like carbon pricing or labor regulation | Requires modeling expertise; harder to communicate | High | Medium |
Use the least complex model that still does the job. If a simple weighted average gives leaders a clear view for target-setting, investment choices, or board oversight, start there. Add more layers only when they improve peer comparison or sharpen risk insight.
Turn benchmark results into board-ready outputs and action plans
Once scoring and normalization are done, the work shifts from analysis to decision-making. Benchmark results need to move fast from spreadsheet to boardroom. If leaders can't read the story in a few minutes, the model won't shape budgets, policy, or operating plans.
Build a board-ready ESG benchmarking package
The first deliverable should be a board package that makes peer comparison easy to scan. A strong package includes five parts: a one-page ESG dashboard, a peer gap summary, a material risks and opportunities section, a trend view, and a plain-language summary of budget, operating, and governance effects. Each page should answer the same four questions directors tend to ask: Where do we stand, is it improving, does it matter, and what should we do next?
The one-page dashboard should show the overall ESG score against the peer median and top quartile, along with 3 to 5 headline metrics tied straight to the business. It should also include color-coded pillar scores for Environment, Social, and Governance. Use U.S. number formatting - for example, 1.25 million metric tons of CO₂e. Traffic-light indicators and trend arrows across 3 to 5 reporting cycles help directors get oriented in under five minutes.
The peer gap summary should then turn the numbers into plain English. For example:
"We are in the top quartile for renewable energy procurement but bottom quartile for supplier ESG disclosure, with a peer median disclosure rate of 75% vs. our current rate of 42%."
Match the format to the decision at hand.
Format | Audience | Depth | Decision Use |
|---|---|---|---|
Dashboard summary | Board of directors, C-suite, and oversight committees | Highly aggregated KPIs | Rapid oversight, trend direction, decisions needed this quarter |
Detailed diagnostic report | ESG, sustainability, finance, risk, HR, supply chain, operations, and internal audit teams | Full metric breakdown | Root-cause analysis, program design, budget proposals |
Scenario-based decision brief | Board strategy committees, investment committees, and executives responsible for capital allocation | Selective but deep | Capital allocation, emissions pathway choices, governance reforms |
Board materials should stay tight. Focus on material variances, business impact, and the decisions that need approval. Skip the full KPI dump. Nobody wants to dig through 40 pages just to find the one issue that needs a vote.
Use benchmark gaps to set priorities and investments
Once the board can see the gaps, the next step is ownership. Each material gap should be tied to a named owner, a deadline, key milestones, and an investment range. That's how a benchmark turns into a work plan instead of a slide deck.
Typical actions may include:
Energy upgrades
Water reuse
Workforce programs
Supplier engagement
Governance changes
Comparison only changes behavior when someone owns the next move and there is a clear path to follow-through.
That closes the loop from comparison to execution.
Conclusion: The essentials of effective ESG peer benchmarking
Effective ESG peer benchmarking ends in action: clear owners, specific timelines, and a regular review cadence. The value comes from disciplined follow-through, not the comparison itself.
FAQs
How do I choose the right ESG peers?
Choose ESG peers based on your company’s material issues and reporting goals. Start with industry leaders and direct competitors. Look at what they disclose, which frameworks they use, and how far their reporting has developed.
Stick with peers in your sector that face similar operating pressures, like high energy use or a tangled supply chain. That keeps your benchmarking grounded in the day-to-day reality of your business and makes the results more useful for stakeholders.
What metrics should an ESG benchmark include?
Include metrics tied to your materiality assessment and your industry, with a clear focus on the ESG issues that matter most to your organization and stakeholders. That keeps reporting grounded in what people actually care about, instead of turning it into a data dump.
Common categories usually include:
Environmental: Scope 1, 2, and 3 emissions, energy use, water use, waste, and renewable energy
Social: headcount, demographics, diversity, safety, training, and labor audits
Governance: board oversight, pay alignment with ESG goals, and compliance
To make the numbers easier to compare across time periods, business units, or peers, use intensity ratios alongside absolute figures. Pair those metrics with relevant frameworks so readers can evaluate performance on a like-for-like basis.
How often should ESG peer benchmarks be updated?
ESG peer benchmarking works best as a regular discipline, not a one-and-done task. Industry standards shift. Macro trends move. Methodologies change. If you benchmark once and leave it on the shelf, the picture gets old fast.
For most organizations, the right cadence is to review peer benchmarks annually and check internal data and progress quarterly. That rhythm helps teams spot trends early, catch anomalies before they turn into bigger issues, and respond to changing stakeholder and regulatory expectations with better timing.
Related Blog Posts
Latest Articles
©2025
Narrative Change and Power Building: The Missing Half of Advocacy
Narrative change is the process of disrupting dominant narratives that normalize inequity and advancing new narratives from historically marginalized communities.
Funding Resilience Without Federal Grants
BRIC is unreliable and FEMA is shrinking. Here's how cities fund climate resilience with dedicated revenue, blended finance, and a coordinating authority.
The ESG Blind Spot: How AI Is Finding Risks in Companies Nobody Else Is Watching
Norway's sovereign wealth fund uses AI to screen 7,200 portfolio companies for forced labor and corruption within 24 hours. The real story is the emerging-market coverage gap that traditional ESG data vendors miss — and what it means for any company with a global supply chain.
FAQ
01
What does it really mean to “redefine profit”?
02
What makes Council Fire different?
03
Who does Council Fire work with?
04
What does working with Council Fire actually look like?
05
How does Council Fire help organizations turn big goals into action?
06
How does Council Fire define and measure success?
Aug 13, 2026
ESG Peer Benchmarking: Ultimate Guide
ESG Strategy
In This Article
Practical steps to build decision-ready ESG peer benchmarks: set objectives, choose peers, map metrics, ensure data quality, score, and assign actions.
ESG Peer Benchmarking: Ultimate Guide
If your ESG benchmark does not lead to a board decision, budget shift, or target change, it is just extra reporting. I’d sum up the article this way: define the decision first, pick peers with care, line up metrics across frameworks, clean the data, use a simple scoring model, and turn the results into named actions with deadlines.
Here’s the full article in one plain-language view:
Start with the purpose. I need one clear sentence for what the benchmark will support, such as board review, capital planning, risk management, or annual reporting.
Set ownership and controls early. One owner, a cross-functional review group, two-person checks, version control, and a yearly cycle with quarterly refreshes keep the work tight.
Limit the metrics. The article points to 15 to 30 metrics across E, S, and G, chosen from material topics like emissions, water, safety, labor, board independence, and supply chain risk.
Choose peers that match the job. Use filters such as sub-industry, geography, revenue range, business model, and disclosure quality. A common setup is 5 to 7 direct peers plus 5 to 10 context peers.
Map disclosures before scoring. I should use a master matrix to align SASB/ISSB, GRI, TCFD, CSRD/ESRS, CDP, and similar sources so I am not comparing mismatched definitions.
Check data quality. The article focuses on four checks: definition clarity, boundary alignment, unit consistency, and validation status.
Keep scoring readable. Use z-scores, percentile ranks, and pass/fail inputs, then roll them into a 0–100 scale with plain labels such as lagging, developing, strong, and leading.
Do not over-focus on weights. The article notes that 56% of ESG rating divergence comes from measurement differences, while only 6% comes from weighting.
Build outputs for decisions, not display. The board package should show peer median, top quartile, 3 to 5 headline metrics, trend lines across 3 to 5 cycles, and the few gaps that need action.
End with owners and deadlines. Every gap should tie to a person, timeline, milestones, and an investment range.
A quick contrast helps:
Item | External ESG ratings | Internal ESG peer benchmarking |
|---|---|---|
Main use | Market signal | Internal decisions |
Method | Proprietary | Company-defined |
Data | Public disclosures | Internal + external data |
Output | Score or rank | Gap list and action plan |
Bottom line: I would treat ESG peer benchmarking as a decision tool, not a branding exercise. The article’s main point is simple: the best benchmark is narrow, clean, comparable, and tied to action.
Set objectives, scope, and governance before comparing peers
Once the decision is clear, set the benchmark's scope, owner, and controls before you line up peer data. That early work decides which peers belong, which metrics matter, and what should stay out.
Choose the decisions the benchmark should support
The decision behind the benchmark shapes the whole model. A benchmark built for board reporting will not look the same as one built for capital allocation or transition planning.
Start with one plain-English objective sentence before you build anything. For example: "Support the board's annual ESG review by comparing our performance against five direct peers on our top 10 material topics." That single sentence does a lot of work. It cuts out extra metrics, keeps the project from sprawling, and gives the team a shared target.
For U.S. organizations, the five most common decision types are board oversight, transition planning, capital allocation, ERM, and annual sustainability reporting. Each one calls for a different output. You may need scenario analysis, risk heat maps, or board scorecards depending on the use case.
Assign ownership, cadence, and controls
Give one person clear accountability. In many U.S. companies, that sits with the CFO or Chief Sustainability Officer. The sustainability team usually handles data collection, peer selection, and scoring. A cross-functional steering group - Finance, Risk, Operations, HR, Legal, and Investor Relations - should meet quarterly or twice a year to review the method and check findings before anything reaches the board.
Use a two-person review for every data point before it enters the benchmark. Back that up with a data inventory that shows who collects each metric, where it lives, and how often someone checks it. If anyone later asks, “Where did this number come from?” you’ll have an answer on hand.
Run one full benchmark each year, timed to the sustainability report or annual report cycle. Refresh fast-moving metrics every quarter. Each cycle should cover data validation, method review, and sign-off. Keep version-controlled copies of your method documents, and archive peer disclosures - CDP responses, 10-Ks, and sustainability reports - with dates and source references tagged clearly.
Focus the analysis on material ESG topics
Too many KPIs blur the picture. Before comparing peers, narrow the field.
Start with SASB, GRI, or TCFD sector guidance, then screen those topics against your own risks and mission. Across industries, common high-priority topics include:
Scope 1–3 emissions
Water use intensity
Total recordable incident rates
Labor practices
Board independence
Supply chain risk
Community impact
Score each topic on two factors: how much it affects enterprise value or mission outcomes, and how much your organization can influence it. Topics that rank high on both should make the cut.
A good target is 15 to 30 metrics across E, S, and G. Many teams do better with a phased rollout. Phase 1 can cover core climate, safety, and governance metrics. Phase 2 can add supply chain and social impact metrics once data quality gets better. Only material topics should move forward into peer selection and metric mapping. That keeps the benchmark tight and sets up the next step cleanly.
Select the right peers and map the right metrics
Build a peer group that is comparable and decision-useful
Good benchmarking starts with peer selection. Get that part wrong, and everything that follows gets shaky. A weak peer set can create fake gaps, hide actual issues, and push boards, investors, and management teams toward bad target-setting decisions.
Use five concrete filters when building the group:
sub-industry classification, not broad sector labels
operating geography
revenue band
business model similarity
reporting quality
For most U.S. companies, keeping peers within one order of magnitude of your revenue helps limit size-related distortion [6][1].
A practical setup is to use 5 to 7 core direct peers for scoring, plus 5 to 10 regional or regulatory exemplars for context. The first group should drive scoring. The second should help interpret the results.
Peer Type | Relevance | Data Availability | Best Used For |
|---|---|---|---|
Direct Peers | High - same sub-industry and business model | Moderate - depends on public disclosure | Competitive positioning and performance gaps |
Regional Peers | Moderate - shared geography and regulatory context | High - local regulatory filings | Operational benchmarking and state-level policy context |
Regulatory Exemplars | High - subject to stricter mandates (e.g., CSRD) | High - mandated public reports | Stronger disclosure design and governance gaps |
Best-in-Class Leaders | Low to moderate - may differ in size or sector | High - detailed sustainability reporting | Long-term strategic ambition and innovation targets |
One simple reporting-quality screen can save a lot of pain later. Check whether each peer publishes quantitative metrics for at least two reporting years and cites a known framework such as GRI, SASB/ISSB, or TCFD. If a peer fails that test, the scoring model will likely be full of holes before you even begin.
With the peer set locked in, the next step is to standardize disclosures before scoring.
Map metrics across frameworks and reporting standards
Now comes the messy part: making unlike disclosures line up. Companies rarely report the same metric in the same way. One may report Scope 2 emissions using a market-based method, while another uses location-based. If you skip a mapping layer, you end up comparing apples to oranges.
The fix is a master disclosure matrix. Think of it as the control panel for your reporting work. Rows list your core ESG topics. Columns cover each framework or taxonomy you track: GRI, ISSB IFRS S1/S2, CSRD/ESRS, SASB, and selected rating methods such as CDP or MSCI. Each cell should show whether the disclosure is required, recommended, or optional, along with any differences in scope or definition [3][4].
A single metric like Scope 1 GHG emissions can map to GRI, ISSB IFRS S2, CSRD ESRS E1-6, CDP, and SASB [8][9]. Build that crosswalk once, and you won't have to rebuild it every reporting cycle. That saves time and keeps peer comparisons steady from one cycle to the next.
Tag each row with both a data owner and a source system. For example, Finance may own energy and emissions data, HR may own labor metrics, and Legal may own governance indicators. That makes accountability clear from day one [7][5]. It also helps to note which disclosures peers usually provide and where leading reporters go past the minimum. That gap can feed straight into your next round of priority-setting.
Once the crosswalk is in place, check each metric before scoring.
Improve data quality before scoring
Before calculating any peer score, run every metric through four checks: definition clarity, boundary alignment, unit consistency, and validation status [5][7].
Definition clarity means each metric has a written explanation of what is included, what is excluded, and how it is measured. Boundary alignment means your organizational scope is documented and applied the same way for each peer. Unit consistency means emissions are reported in metric tons CO₂e, energy in kWh or MWh, and financial figures in U.S. dollars. Validation status means each data point has gone through a two-person review before it enters the model. That extra set of eyes helps catch unit mix-ups and scope errors that one person can easily miss [2].
When peer data is missing or estimated, document the gap plainly. Don't quietly fill it and hope no one notices. If you use an estimate method, use it only for missing values and flag those cells in the matrix so reviewers can see where uncertainty is higher.
Version control matters here too. Track each matrix change with a timestamp, approver, and rationale [7][5]. That audit trail can make all the difference when a board member or external auditor asks why a figure changed from one cycle to the next.
Design a scoring model that makes peer comparisons usable
Internal ESG Peer Benchmarking vs. External ESG Ratings: Key Differences
After you map and check the metrics, the next job is to turn them into scores that boards and executives can scan in seconds. The trick is simple: keep the model easy to read without smoothing over gaps that matter.
Choose a normalization and weighting approach
Raw ESG metrics show up in different units - metric tons of CO₂e, injury rates per 200,000 work hours, and percentages of independent directors. You can’t compare peers in any clean way until those numbers sit on the same scale.
A practical setup is to use:
Z-scores for continuous metrics
Percentile ranks for peer position
Pass/fail scoring for policy indicators
From there, all three can roll into a single 0–100 scale for final presentation.
Weights should follow the same materiality ranking you already set. In high-emissions sectors like utilities or oil and gas, climate and other environmental metrics often make up 40%–50% of the total score. Governance usually carries a 20%–30% base weight across sectors. Research shows that measurement differences account for 56% of ESG rating divergence across providers, while weighting explains only 6% [11][10]. That’s a big clue. Indicator definitions and data treatment matter far more than tweaking the weight table by a few points.
Roll topic scores into E, S, G, and overall results
Roll each metric into topic scores, then into pillar scores, and then into one overall ESG result on a 0–100 scale. Clear labels help boards read the output fast: lagging (0–40), developing (40–60), strong (60–80), and leading (80–100).
Controversies can sit inside the model as score deductions or as a separate overlay. For example, MSCI applies controversy deductions ranging from 0 to –5.0 points from management scores based on severity [13][14]. That kind of adjustment helps the score reflect what’s happening outside the spreadsheet.
Some governance inputs are harder to measure with raw data alone. Leadership tone, board culture, or the credibility of transition plans often need a structured analyst rubric. A 1–5 scale works well here. You score the factor, convert it into a numeric value, and blend it into the governance topic score. If an analyst makes an override, log it in writing and review it on a fixed schedule. Otherwise, the model can drift, and no one will remember why.
Missing data needs the same discipline. You can treat it as a penalty, an estimate, or a reweighted exclusion, but the method should be stated plainly. Clarity AI, for instance, assigns missing high-relevance data a score at the 1st percentile of the industry distribution [12].
Compare simple and advanced internal scoring models
Model complexity should match the decision you’re trying to support. A board scorecard should be plain and fast to read. A capital-allocation model can carry more moving parts.
Model Type | Key Pros | Key Cons | Complexity | Board Usability |
|---|---|---|---|---|
Simple weighted average | Easy to explain; quick to implement; fully transparent | Less effective at handling sector differences; can let data-rich topics dominate; limited treatment of controversies | Low | High |
Industry-normalized scoring | Fairer cross-peer comparisons; reflects sector realities | Requires sector baselines and ongoing recalibration | Medium | Medium–High |
Controversy-adjusted scoring | Captures real-world risk; improves credibility with risk committees | Needs robust controversy categories and override governance | Medium–High | Medium |
Scenario-weighted scoring | Shows resilience under future conditions like carbon pricing or labor regulation | Requires modeling expertise; harder to communicate | High | Medium |
Use the least complex model that still does the job. If a simple weighted average gives leaders a clear view for target-setting, investment choices, or board oversight, start there. Add more layers only when they improve peer comparison or sharpen risk insight.
Turn benchmark results into board-ready outputs and action plans
Once scoring and normalization are done, the work shifts from analysis to decision-making. Benchmark results need to move fast from spreadsheet to boardroom. If leaders can't read the story in a few minutes, the model won't shape budgets, policy, or operating plans.
Build a board-ready ESG benchmarking package
The first deliverable should be a board package that makes peer comparison easy to scan. A strong package includes five parts: a one-page ESG dashboard, a peer gap summary, a material risks and opportunities section, a trend view, and a plain-language summary of budget, operating, and governance effects. Each page should answer the same four questions directors tend to ask: Where do we stand, is it improving, does it matter, and what should we do next?
The one-page dashboard should show the overall ESG score against the peer median and top quartile, along with 3 to 5 headline metrics tied straight to the business. It should also include color-coded pillar scores for Environment, Social, and Governance. Use U.S. number formatting - for example, 1.25 million metric tons of CO₂e. Traffic-light indicators and trend arrows across 3 to 5 reporting cycles help directors get oriented in under five minutes.
The peer gap summary should then turn the numbers into plain English. For example:
"We are in the top quartile for renewable energy procurement but bottom quartile for supplier ESG disclosure, with a peer median disclosure rate of 75% vs. our current rate of 42%."
Match the format to the decision at hand.
Format | Audience | Depth | Decision Use |
|---|---|---|---|
Dashboard summary | Board of directors, C-suite, and oversight committees | Highly aggregated KPIs | Rapid oversight, trend direction, decisions needed this quarter |
Detailed diagnostic report | ESG, sustainability, finance, risk, HR, supply chain, operations, and internal audit teams | Full metric breakdown | Root-cause analysis, program design, budget proposals |
Scenario-based decision brief | Board strategy committees, investment committees, and executives responsible for capital allocation | Selective but deep | Capital allocation, emissions pathway choices, governance reforms |
Board materials should stay tight. Focus on material variances, business impact, and the decisions that need approval. Skip the full KPI dump. Nobody wants to dig through 40 pages just to find the one issue that needs a vote.
Use benchmark gaps to set priorities and investments
Once the board can see the gaps, the next step is ownership. Each material gap should be tied to a named owner, a deadline, key milestones, and an investment range. That's how a benchmark turns into a work plan instead of a slide deck.
Typical actions may include:
Energy upgrades
Water reuse
Workforce programs
Supplier engagement
Governance changes
Comparison only changes behavior when someone owns the next move and there is a clear path to follow-through.
That closes the loop from comparison to execution.
Conclusion: The essentials of effective ESG peer benchmarking
Effective ESG peer benchmarking ends in action: clear owners, specific timelines, and a regular review cadence. The value comes from disciplined follow-through, not the comparison itself.
FAQs
How do I choose the right ESG peers?
Choose ESG peers based on your company’s material issues and reporting goals. Start with industry leaders and direct competitors. Look at what they disclose, which frameworks they use, and how far their reporting has developed.
Stick with peers in your sector that face similar operating pressures, like high energy use or a tangled supply chain. That keeps your benchmarking grounded in the day-to-day reality of your business and makes the results more useful for stakeholders.
What metrics should an ESG benchmark include?
Include metrics tied to your materiality assessment and your industry, with a clear focus on the ESG issues that matter most to your organization and stakeholders. That keeps reporting grounded in what people actually care about, instead of turning it into a data dump.
Common categories usually include:
Environmental: Scope 1, 2, and 3 emissions, energy use, water use, waste, and renewable energy
Social: headcount, demographics, diversity, safety, training, and labor audits
Governance: board oversight, pay alignment with ESG goals, and compliance
To make the numbers easier to compare across time periods, business units, or peers, use intensity ratios alongside absolute figures. Pair those metrics with relevant frameworks so readers can evaluate performance on a like-for-like basis.
How often should ESG peer benchmarks be updated?
ESG peer benchmarking works best as a regular discipline, not a one-and-done task. Industry standards shift. Macro trends move. Methodologies change. If you benchmark once and leave it on the shelf, the picture gets old fast.
For most organizations, the right cadence is to review peer benchmarks annually and check internal data and progress quarterly. That rhythm helps teams spot trends early, catch anomalies before they turn into bigger issues, and respond to changing stakeholder and regulatory expectations with better timing.
Related Blog Posts
Latest Articles
©2025
Narrative Change and Power Building: The Missing Half of Advocacy
Narrative change is the process of disrupting dominant narratives that normalize inequity and advancing new narratives from historically marginalized communities.
Funding Resilience Without Federal Grants
BRIC is unreliable and FEMA is shrinking. Here's how cities fund climate resilience with dedicated revenue, blended finance, and a coordinating authority.
The ESG Blind Spot: How AI Is Finding Risks in Companies Nobody Else Is Watching
Norway's sovereign wealth fund uses AI to screen 7,200 portfolio companies for forced labor and corruption within 24 hours. The real story is the emerging-market coverage gap that traditional ESG data vendors miss — and what it means for any company with a global supply chain.
FAQ
What does it really mean to “redefine profit”?
What makes Council Fire different?
Who does Council Fire work with?
What does working with Council Fire actually look like?
How does Council Fire help organizations turn big goals into action?
How does Council Fire define and measure success?