In This Article
Five dashboard views to convert supplier emissions into procurement decisions: coverage, hotspots, scorecards, action plans, and carbon-cost.
On this page
- Carbon Footprint KPI Dashboard in Excel
- Establish Comparable Supplier Data Before Using the Views
- 1. Portfolio Coverage Dashboard
- 2. Supplier Hotspot and Ranking Dashboard
- 3. Supplier Carbon Scorecard
- 4. Reduction Commitments and Action-Plan Dashboard
- 5. Sourcing Scenario and Carbon-Cost Dashboard
- Match Each View to the Right Procurement Question
- Conclusion: Turn Supplier Carbon Data Into Measurable Action
- FAQs
Supplier Carbon Dashboard Examples
I use five supplier carbon dashboard views to turn emissions data into procurement decisions. Start by matching emissions to your purchases, labeling estimates, and checking that reporting periods and boundaries match - not by ranking suppliers on spend alone.
Each view answers a different question:
Portfolio coverage: Where is data missing, and which suppliers need a request?
Hotspot and ranking: Which suppliers account for the most emissions?
Supplier carbon scorecard: How do emissions, measured reductions, data quality, and targets compare?
Reduction commitments and action plans: Who owns each action, when is it due, and what records confirm completion?
Sourcing scenarios and carbon-cost: How do bids compare on price, emissions, and cost per metric ton of CO2e avoided?
I would start outreach with suppliers representing 80% of known emissions or spend, then assign each follow-up an owner and deadline. Across all five views, I keep projected savings separate from <u>measured reductions</u> so a pledge - or a change in calculation - doesn’t pass for progress.
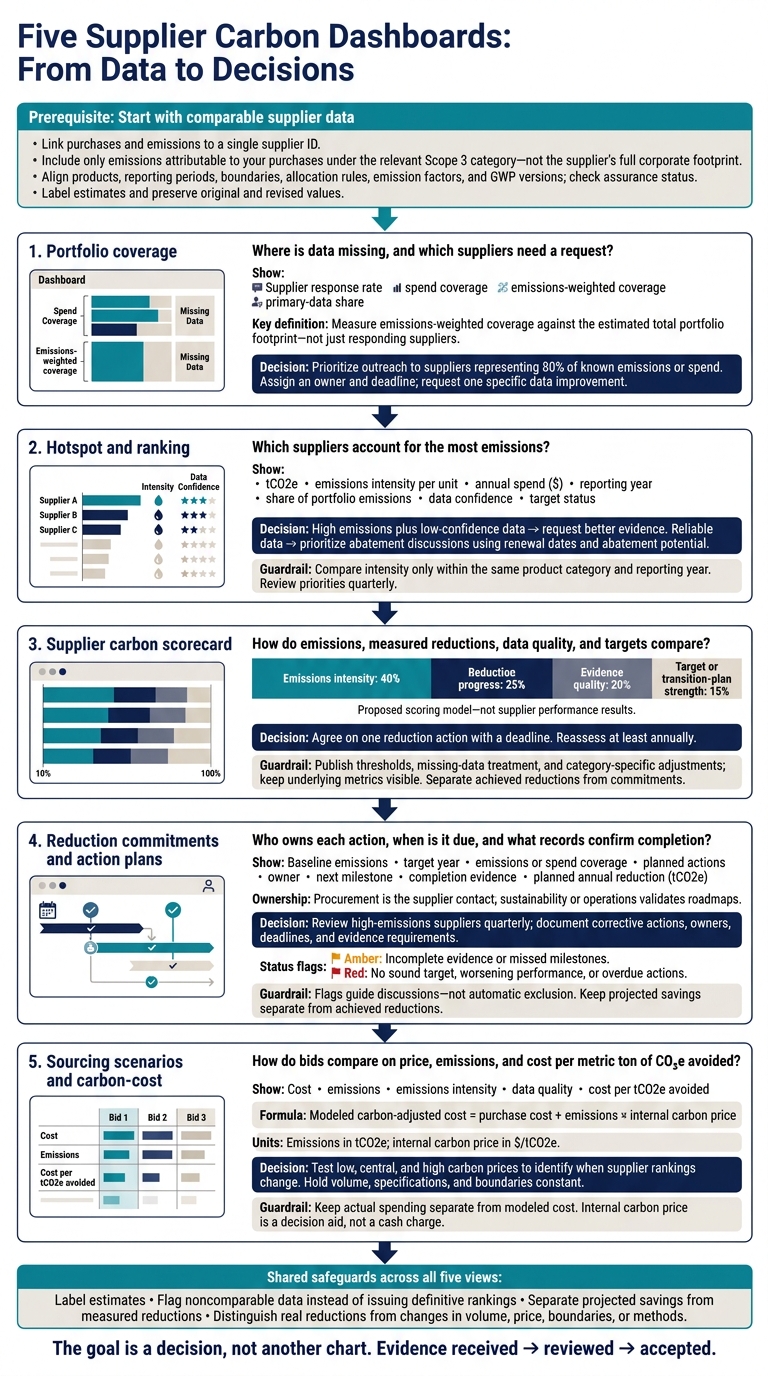
Five Supplier Carbon Dashboards: From Data to Decisions
Carbon Footprint KPI Dashboard in Excel
sbb-itb-8baf5f1
Establish Comparable Supplier Data Before Using the Views
Standardize supplier data before using the dashboards. Without that step, the views below can misstate coverage, hotspots, and rankings.
Build a single supplier master record with a supplier ID, legal entity name, parent company, subsidiaries, facilities, operating country, and product or service categories. Give each supplier its own ID. Link every purchase order, invoice, contract, and emissions submission to it. Match spend and quantities to the same supplier, product, facility, and reporting period.[4][5]
Include only emissions tied to your purchases under the relevant Scope 3 category - not the supplier’s full corporate footprint. This keeps portfolio, hotspot, and scorecard comparisons on the same basis. Record how emissions are allocated, such as by purchased mass or production output. State whether each figure covers facility Scope 1 and Scope 2 emissions or a cradle-to-gate product boundary. Map purchases to the applicable Scope 3 category, such as Category 1, Purchased Goods and Services, or Category 4, Upstream Transportation and Distribution.[4][3][5]
Require the reporting year and exact reporting period. Record the buyer’s fiscal year separately, and flag mismatched periods or carried-forward data. For every value, show the calculation method, data source, assurance status, estimation label, emission factor, and global-warming-potential (GWP) version.[3]
Report totals in metric tons of carbon dioxide equivalent (tCO2e), spend in dollars, dates in the format November 7, 2026, and intensity in kg CO2e per defined product unit. Before ranking suppliers, check that products, reporting periods, boundaries, Scope 3 categories, allocation rules, emission factors, GWP versions, and assurance status are comparable. If they aren’t, show a warning instead of a definitive ranking.
Preserve original submissions and retain both original and revised values. Log every revision with its version, date, reason, approver, and affected dashboard view. Before publishing, check for missing units, duplicate records, unusual intensities, and missing boundary information. Flag revised or carried-forward data.
1. Portfolio Coverage Dashboard
With standardized supplier records in place, use the first dashboard to show where data is complete - and where gaps remain.
Start with data coverage, not reductions. Add KPI cards for supplier response rate, spend coverage, emissions-weighted coverage, and primary-data share. A high response rate can still leave the largest emitters out of the picture.
Use a stacked bar chart to show coverage by category and region, broken down by data type. Measure emissions-weighted coverage against the estimated total portfolio footprint, not just the footprint of suppliers that responded.
Add a “top uncovered suppliers” table showing spend, estimated emissions, missing fields, and the next action. This gives procurement a clear follow-up plan. Prioritize suppliers representing 80% of known emissions or spend.[2] Request one specific data improvement in each discussion, and track whether the next action replaces an estimate.
Once those gaps are visible, the next view should show which suppliers drive the most emissions.
2. Supplier Hotspot and Ranking Dashboard
Once coverage gaps are visible, rank suppliers to focus attention where it matters most.
Rank suppliers by emissions, then prioritize action. Use a supplier bar chart with a cumulative share line. For each supplier, show tCO2e, emissions intensity per unit, annual spend ($), reporting year, share of portfolio emissions, data confidence, and target status. This view helps teams decide who needs a data request and who is ready for an abatement discussion.
Compare emissions intensity only within the same product category and reporting year. In the data-confidence column, clearly separate estimates from supplier-reported data.[1]
For high-emitting suppliers with low-confidence data, request facility-level emissions data, methods, boundaries, and verification. For suppliers with reliable data, use contract renewal dates and abatement potential to prioritize discussions about renewables or process efficiency. Assign an owner and due date, and review priorities quarterly.
Feed these rankings into the scorecard to track targets and progress over time.
3. Supplier Carbon Scorecard
Use the ranking view to turn emissions hotspots into a repeatable supplier review scorecard - and give procurement teams a clear basis for sourcing and renewal decisions.
Separate achieved reductions from commitments. Build a one-page scorecard that includes supplier Scope 1 and 2 emissions, relevant Scope 3 or product-carbon data, emissions intensity, reporting year, boundary, share of category emissions, progress against target, renewable electricity use, and assurance status. Keep commitments separate from results already achieved. Label each metric as verified product data, supplier-reported data, allocated corporate data, or a secondary estimate.
Make the scoring model transparent. Weight emissions intensity at 40%, reduction progress at 25%, evidence quality at 20%, and target or transition-plan strength at 15%. Publish the weights, thresholds, treatment of missing data, and any category-specific adjustments. Keep the underlying metrics visible so reviewers can see what drives each score.
Use the scorecard to guide procurement conversations. During supplier reviews, request missing product-level data, discuss the largest emissions sources, confirm the boundary, and agree on one reduction action with a deadline. Reassess at least annually and document methodology changes so better measurement isn't mistaken for actual emissions reductions.
4. Reduction Commitments and Action-Plan Dashboard
Once the scorecard identifies priority suppliers, use this dashboard to turn commitments into tracked action plans.
Use one row per supplier to record baseline emissions, target year, emissions or spend coverage, planned actions, owner, next milestone, completion evidence, and planned annual reduction (tCO2e). Keep projected savings separate from achieved reductions.
Make procurement the supplier contact, with sustainability or operations responsible for validating roadmaps.
Review high-emissions suppliers quarterly, focusing on overdue milestones and weak or missing targets. Ask what’s blocking delivery and agree on the buyer support needed. Record each corrective action, its owner, deadline, and evidence requirement.
Use color flags to guide supplier discussions - not to trigger automatic exclusion:
Amber: Incomplete evidence or missed milestones.
Red: No sound target, worsening performance, or overdue actions.
The next view tests how sourcing changes affect carbon and cost.
5. Sourcing Scenario and Carbon-Cost Dashboard
Use this view to test carbon-cost tradeoffs when awarding contracts, renewing agreements, or changing specifications.
Compare bids on cost and tCO2e - not price alone. Show cost, emissions, emissions intensity, and data quality side by side. Hold volume, specifications, and boundaries constant, and include cost per tCO2e avoided.
Keep actual spending separate from the modeled figure:
Modeled carbon-adjusted cost = purchase cost + emissions × internal carbon price
Use emissions in tCO2e and a carbon price in $/tCO2e.[6][7] Test low, central, and high carbon prices to see when supplier rankings change. The internal carbon price is a decision aid, not a cash charge.[6][8]
Label estimated data, request verified product footprints, and align assumptions before comparing options. Bring that evidence to supplier review to choose the lower-carbon bid or negotiate a lower-carbon specification.
Match Each View to the Right Procurement Question
Give each dashboard view one decision purpose. Once you’ve defined the five views, connect each to the procurement decision it supports. Use this matrix to identify who uses each view, what data they need, and which questions to bring to suppliers.
| Dashboard view | Primary user | Decision stage | Required data | Recommended supplier conversation |
|---|---|---|---|---|
| Portfolio coverage | Procurement sustainability lead, category managers | Outreach planning and data-quality improvement | Supplier list, spend, reporting status, data source, reporting year, organizational and operational boundaries | Which priority suppliers are missing data, and what deadline or support will close the gap? |
| Hotspot and ranking | Category managers, sourcing managers | Prioritization | Attributable emissions, spend, category, supplier, emissions intensity, data quality, calculation method, reduction potential | Which reduction opportunity should we address first? |
| Supplier carbon scorecard | Buyer, supplier relationship manager, supplier executive | Individual supplier review, qualification, or performance review | Emissions trends, intensity, targets, assurance, renewable-energy share, product mix, reporting completeness, data method | Do your targets, verified performance, and product-level emissions meet our sourcing requirements? |
| Reduction commitments and action plan | Procurement program manager, supplier account team | Follow-through and governance | Baseline, target year, interim milestones, owners, actions, expected reductions, status, evidence, deadlines | What happens next, who owns it, and what evidence confirms completion? |
| Sourcing scenario and carbon-cost | Strategic sourcing, finance, operations, product teams | Bid evaluation, award, and sourcing decisions | Unit cost, volume, spend, product emissions, supplier-specific factors, logistics, scenario assumptions, internal carbon price | What are the cost, emissions, and execution trade-offs? |
Use tCO2e for portfolio impact, intensity for like-for-like comparisons, spend for commercial leverage, and product-level emissions for sourcing choices.
Flag differences in boundaries, reporting years, allocation rules, or calculation methods. Keep original values beside normalized figures, and separate actual emissions reductions from changes caused by volume, price, boundaries, or methods.
Conclusion: Turn Supplier Carbon Data Into Measurable Action
These dashboards turn supplier carbon data into procurement decisions. Use the five views as a single workflow: close data gaps, rank suppliers, review performance, track action plans, and test sourcing tradeoffs. The goal is a decision, not another chart.
Track whether evidence has been received, reviewed, and accepted so progress can be audited - not just reported. A commitment alone doesn’t prove emissions have fallen. That takes verified project records and measured results.
Council Fire turns sustainability strategy into measurable action by connecting data to what buyers and suppliers can deliver together. Use that verified progress to guide the next procurement decision.
FAQs
How do I handle suppliers that won’t share emissions data?
Don’t let missing data hold up your work. Start with spend-based estimates, such as EPA supply chain emission factors. Focus primary data collection on your top 20 to 100 suppliers by spend or emissions contribution. For the rest, use sector-specific averages and proxy data.
Replace estimates with verified primary data over time. Document your estimation methods, flag unverified figures, and make data handling transparent so others can track how figures were produced and who is accountable.
How can I verify that supplier reductions are real?
Require independently verifiable evidence, such as audit reports and energy usage records - not just supplier claims. Label emissions data as measured, modeled, or estimated, and keep an audit trail that links each figure to its source data, calculation methods, and version-controlled documentation.
Check supplier disclosures against public filings or independent ratings. Use automated range checks and variance analyses to flag reporting errors and unexplained year-over-year changes.
How do I choose an internal carbon price?
Procurement teams typically set an internal carbon price of $50 to $100 per metric ton of CO2e. Include this price in total cost of ownership analysis to compare sourcing options and factor in emissions costs.
This approach can favor low-carbon suppliers, even when their upfront prices are higher. It helps your team quantify carbon risk, weigh long-term value against short-term price, and guide supplier selection and capital planning.




FAQ