
Jul 30, 2026
Social Impact Frameworks vs Cost-Benefit in Urban Policy
Sustainability Strategy
In This Article
When to use cost-benefit analysis versus social impact frameworks in city projects, plus a practical 3-step workflow for decisions.
Social Impact Frameworks vs Cost-Benefit in Urban Policy
If I had to boil this down to one line: use cost-benefit analysis to ask “Is this project worth the money?” and use social impact frameworks to ask “Who wins, who loses, and where?”
For city decisions tied to $10 million to $100 million+ projects and 10- to 30-year timelines, one tool is rarely enough. A transit line can post a strong benefit-cost ratio, while still leaving a low-access area behind. A housing plan can add supply, but also increase displacement pressure. And in U.S. planning, equity still gets less than 10% of project scoring in many MPOs.
Here’s the short version:
Cost-benefit analysis (CBA) turns costs and gains into dollars.
Social impact frameworks track effects that do not fit neatly into dollar values.
CBA is strongest for efficiency, ranking, and budget choices.
Social frameworks are strongest for distribution, public input, and neighborhood effects.
The main comparison points are purpose, data, time frame, public input, and decision output.
The best path for many city teams is a 3-step flow:
Run CBA first
Run a social or equity review second
Use multi-criteria analysis if tradeoffs still remain
A few facts from the article make the split clear:
In hazard mitigation, every $1 invested saves about $6 in later disaster costs.
Mexico City’s Metrobús Line 3 showed a BCR of 1.54 and $90.6 million in NPV.
That same case also showed 78% of benefits going to income quintiles 1 through 3.
Quick Comparison
Criteria | Cost-Benefit Analysis | Social Impact Frameworks |
|---|---|---|
Main question | Is the project worth the cost? | Who is affected, and how? |
Output | NPV, BCR, IRR | Scorecards, narratives, group-by-group findings |
Main data | Costs, travel time, tax effects, safety, emissions | Census, ACS, evictions, GIS, surveys, interviews |
Time view | Discounts future effects | Looks across short-, medium-, and long-term effects |
Public input | Usually limited | Built into the process |
Best fit | Transit, infrastructure, fiscal review | Housing, displacement, access, neighborhood change |
Main gap | Can miss uneven harm across groups | Harder to standardize and takes more staff time |
So if you are choosing between the two, I would not treat this as an either-or call. CBA tells you whether a project adds net value. Social impact frameworks show whether that value is shared well or shifted onto people with the least room to absorb the cost.
Social Cost/Benefit Analysis - How does it work?
Cost-benefit analysis in urban policy
Cost-benefit analysis (CBA) turns a policy’s costs and benefits into dollar terms to test whether it creates net social value.[2][3] That makes it a solid tool for comparing options side by side. But once equity, voice, or local lived experience enters the picture, CBA starts to show its limits.
Purpose and core metrics
The main output is net present value (NPV): discounted benefits minus discounted costs over the life of the project.[2] Analysts also look at the benefit-cost ratio (BCR), which shows how much value a project returns for each dollar spent. If NPV is positive, discounted benefits are greater than discounted costs.
Discounting is what makes long-range comparison possible. A dollar received years from now is worth less than a dollar in hand today, so CBA applies a discount rate to future costs and benefits and converts them into present-value terms.[2] In plain English, the discount rate shapes how much weight long-term benefits receive.
Data, discounting, and common blind spots
A standard urban CBA usually draws on data such as capital costs, operating costs, travel time savings, safety effects like avoided crashes, emissions and other externalities, and property tax effects.[2] In hazard mitigation, the math can be striking: every $1 invested in mitigation saves an average of $6 in future disaster-related costs.[1]
The tougher issue is what CBA struggles to price. Social cohesion, displacement risk, and informal networks rarely come with clean market prices, so they’re often left out or squeezed into proxy measures that people can argue about for years.[3] That matters in practice. An infrastructure project may post a strong BCR and still add to climate gentrification, with higher property values putting more pressure on renters and on communities that have long received less public investment.
Where CBA works best in housing, transit, and land use
CBA works best when impacts can be measured with some confidence and the comparison is fairly direct. It fits transit appraisals, major infrastructure investments, and land-use planning cases where fiscal returns and avoided damages can be quantified.[2]
It works less well when distribution matters just as much as efficiency. A land-use change can look like a clear win on NPV while pushing displacement pressure into lower-income neighborhoods. CBA tends to capture gains more easily than distributional losses, which is why social impact frameworks are often used alongside it.
Social impact frameworks in urban policy
Social impact frameworks turn equity questions into a structured way to assess who gains, who carries the costs, and how policy shifts daily life. That matters because cost-benefit analysis often misses distribution, lived experience, and fairness. These frameworks help city teams track nonmarket effects such as displacement risk, neighborhood cohesion, perceived safety, access to opportunity, and community trust.
Purpose and main framework types
Social impact frameworks are methods used to identify, assess, and manage the social outcomes of policy and investment decisions.[7] In urban policy, four frameworks show up again and again:
Framework | Main purpose | Best use in urban policy |
|---|---|---|
Social Impact Assessment (SIA) | Identify and manage social effects before decisions are made | Housing, transit, land use, redevelopment[7] |
Multi-Criteria Analysis (MCA) | Compare options across equity, safety, access, and other non-monetary criteria | |
Social Return on Investment (SROI) | Estimate social value created relative to dollars invested | Programs with mixed social outcomes and funder reporting[9] |
Equity frameworks | Evaluate who benefits and who bears costs across racial, income, and geographic lines |
What makes these tools useful is simple: they combine data with public input.
Cities often pair SIA with equity screening. They may also use MCA criteria to reflect what residents care about most, especially when a clean dollar figure can't tell the whole story.
Data sources and the role of public input
Social frameworks rely on mixed evidence. Cities often combine Census and ACS data with eviction filings, transit ridership, 311 patterns, and GIS layers for sidewalks, parks, stops, and lighting.
Numbers only go so far. Qualitative data helps fill the gap. Community surveys, interviews, focus groups, and participatory mapping sessions bring in lived experience and surface distributional concerns that administrative records can miss. OECD guidance says stakeholder participation surfaces impacts from different perspectives and makes policy assumptions visible.[5] In strong social frameworks, public input is not a one-and-done public hearing. It is built into the full decision cycle, from co-defining the problem to reviewing options and tracking outcomes after implementation.[6]
That blend of evidence makes these frameworks useful for comparing options, not just listing impacts.
Where social frameworks add value in city decisions
In housing, social frameworks can assess displacement risk by tracking rent burdens, eviction rates, proximity to new infrastructure, and demographic shifts tied to gentrification pressure.[4][8] HUD's Affirmatively Furthering Fair Housing process, for example, explicitly requires analysis of racial and ethnic segregation, racially and ethnically concentrated areas of poverty, and neighborhood disparities in access to community assets.[4]
In transit, a social framework can show whether a proposed route improves job access for low-income riders within a 30- to 45-minute commute. For land use decisions, these tools assess walkability, park access, urban heat exposure, and the preservation of cultural landmarks. IAIA treats impact equity as a fair share of benefits and burdens.[7] That idea is tough to turn into a single benefit-cost ratio.
For city teams, the goal is not to pick one framework and use it for everything. The better move is to match the tool to the policy question. That is where these frameworks earn their place: they turn distributional questions into structured inputs for comparing policy options.
The next section shows how these tools differ from cost-benefit analysis in purpose, data, time horizon, and decision output.
Social impact frameworks vs. cost-benefit analysis: key differences
Building on the two tools above, the main difference isn’t whether they work. It’s what each one lets you see.
CBA turns project effects into a single dollar figure. Social impact frameworks keep benefits and burdens in view across groups, places, and time. Effects that are hard to price often get left out of CBA or handled through rough proxies. In social frameworks, those same effects sit near the center of the analysis.
Purpose, data, and decision outputs
CBA converts almost everything into dollars. Travel time savings, property value changes, and lower vehicle operating costs all receive a monetary value and then get rolled into one figure, usually a net present value (NPV) or benefit-cost ratio (BCR) [12][13]. That makes project ranking and spending decisions easier.
Social impact frameworks lead to a different kind of output. Instead of one number, they produce a scorecard, a narrative, or a distributional breakdown that shows how a project affects different groups. A social impact assessment might show that a transit project improves access for one neighborhood while leaving another with little change in job access. In a single ratio, that kind of gap can vanish.
Criteria | Cost-Benefit Analysis | Social Impact Frameworks |
|---|---|---|
Key outputs | NPV, BCR, internal rate of return | Scorecards, narratives, distributional findings |
Equity focus | Usually secondary or absent | Central to the analysis |
Public input | Limited; expert-led | Built into the process; participatory |
Strengths | Clear project comparison; standardized | Captures lived experience; surfaces distributional harms |
Limitations | Can justify projects that harm marginalized groups | Resource-intensive; harder to standardize |
Time horizon, equity, and public participation
CBA heavily discounts future impacts, which can push down the weight given to slow-building harms like environmental degradation, long-term displacement pressure, and the loss of neighborhood cohesion [10][11].
Social frameworks do not formally discount the future. They can lay out impacts across several time frames: construction disruption now, neighborhood change over the next decade, and the shape of opportunity for children growing up in affected communities later on. That makes them a better fit for decisions where long-run and intergenerational effects carry the most weight [15].
Public participation shows the split just as clearly. CBA is usually prepared by economists or consultants and then handed to decision-makers. Residents may speak at a public hearing, but their input seldom changes the model’s core assumptions. Social impact frameworks are built differently. They bring people in earlier through workshops, participatory mapping, and focus groups, then use what they hear to define impact categories and read the findings [14][17].
How each method shapes housing, transit, and land use decisions
Take a transit project such as a rapid bus extension or rail line. A CBA might show a strong BCR because of large total travel time savings and ridership gains. A social impact framework, though, might show that the project skips a low-access neighborhood, leaving some areas with little gain in job access [16].
Housing brings the same tension into view. CBA can support new supply, while social frameworks can flag displacement risk and uneven neighborhood effects.
Land use decisions follow the same pattern. A CBA might support upzoning a neighborhood because it is projected to increase taxable property values. A social impact framework would ask who lives there now, what displacement risk looks like, and whether local anchors would make it through the shift. Evidence from Chicago's public housing demolitions found that aggregate household welfare barely changed, but effects were unevenly distributed across demographic groups [18]. That’s the kind of tradeoff a net-benefit calculation on its own can miss.
That’s why many city teams need both tools before choosing a path. Used together, they separate efficiency from equity before a final decision is made.
Using both methods together: a closing comparison
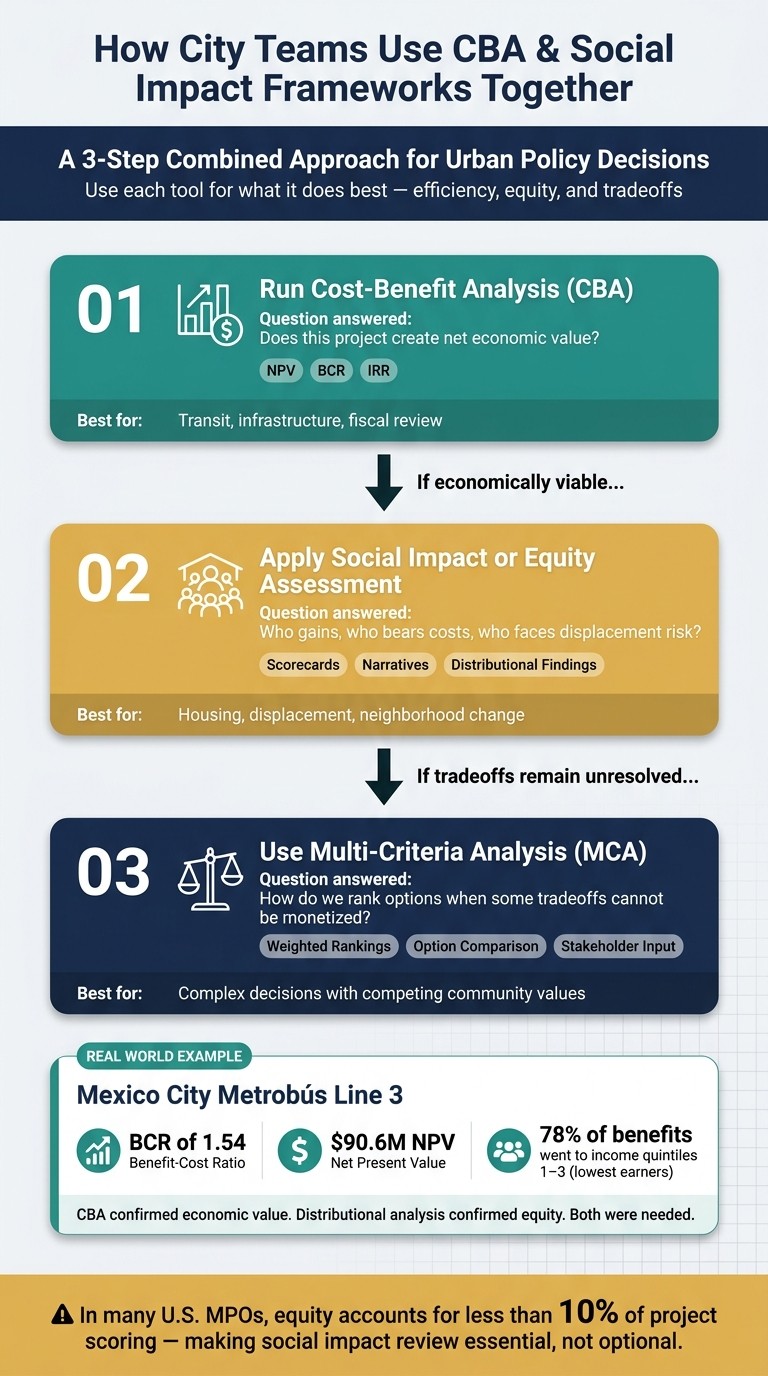
CBA vs Social Impact Frameworks: 3-Step Decision Workflow for City Teams
Once you put the two tools side by side, the next step is pretty practical: how do city teams use them in the same project? The answer is to use each one for what it does best. CBA tests economic value. Social impact frameworks test who wins, who pays, and where harm may fall. Together, they give city staff a more complete view of a decision.
A practical combined approach for city teams
A simple workflow helps keep the methods in the right sequence:
Run CBA first to test feasibility.
Apply a social impact or equity assessment second to examine who gains, who bears costs, and who faces displacement risk.
Use multi-criteria analysis (MCA) third when tradeoffs cannot be monetized.
Each step answers a different question. CBA asks whether the project creates economic value. Social impact review looks at distributional effects. MCA helps rank options when some tradeoffs do not fit neatly into dollar terms.
You can see this layered approach in actual city work. Mexico City's Metrobús Line 3 is a clear example. The CBA found a BCR of 1.54 and an NPV of $90.6 million, while the distributional analysis found that 78% of benefits went to income quintiles 1 through 3 [19].
That matters because urban decisions rarely touch just one issue. A transit line, zoning change, or housing plan can shape jobs, rent pressure, and climate exposure all at once.
Key takeaways for decision-makers
Use CBA to test efficiency. Use social impact frameworks to test equity. Use both when the stakes are high, especially in housing, transit, and land-use decisions. In many U.S. MPOs, equity still counts for less than 10% of project scoring [20], which means social impacts need explicit weight.
FAQs
When should a city use both CBA and a social impact review?
Cities should use both when they need a fuller review of a policy or project’s financial accountability and its public value.
CBA is useful for measuring fiscal efficiency, but it can miss effects such as community health, social equity, and resilience. That gap matters. In infrastructure and climate resilience projects, the dollars may tell only part of the story. A seawall, cooling center, transit upgrade, or stormwater system might not show its full worth through direct financial returns alone, even though residents feel the impact for years.
Using both approaches gives city leaders a better read on what a project costs, what it returns, and who gains from it.
How do discount rates affect long-term urban policy decisions?
Discount rates shape long-term urban policy because they change how we value future costs and benefits in the present. That matters a lot in sustainability projects, where many of the gains may not show up for decades.
With standard cost-benefit analysis, natural capital can be undervalued once the timeline stretches past 20–25 years. In plain terms, the farther those benefits sit in the future, the easier they are to shrink on paper today. To deal with that, policymakers may choose lower discount rates - such as the EPA’s 2% rate - to give long-term impacts more weight and keep decisions in line with policy goals.
What data is needed to measure displacement and equity impacts?
Use both quantitative and qualitative data. The numbers matter, but they don’t tell the whole story on their own. Break quantitative data out by income, race, age, and location so you can see where gaps and disparities show up instead of letting them blur into a citywide average.
Key inputs include:
Housing cost burdens
Eviction filings
Demographic shifts
Utility shutoffs
Social vulnerability indices
Qualitative data adds the human side of the picture. Surveys, focus groups, and interviews help surface residents’ lived experiences, their feelings of safety, and the effects on community stability.
Related Blog Posts
Latest Articles
©2025

Narrative Change and Power Building: The Missing Half of Advocacy
Narrative change is the process of disrupting dominant narratives that normalize inequity and advancing new narratives from historically marginalized communities.

Funding Resilience Without Federal Grants
BRIC is unreliable and FEMA is shrinking. Here's how cities fund climate resilience with dedicated revenue, blended finance, and a coordinating authority.

The ESG Blind Spot: How AI Is Finding Risks in Companies Nobody Else Is Watching
Norway's sovereign wealth fund uses AI to screen 7,200 portfolio companies for forced labor and corruption within 24 hours. The real story is the emerging-market coverage gap that traditional ESG data vendors miss — and what it means for any company with a global supply chain.
Narrative Change and Power Building: The Missing Half of Advocacy
Narrative change is the process of disrupting dominant narratives that normalize inequity and advancing new narratives from historically marginalized communities.
Funding Resilience Without Federal Grants
BRIC is unreliable and FEMA is shrinking. Here's how cities fund climate resilience with dedicated revenue, blended finance, and a coordinating authority.
The ESG Blind Spot: How AI Is Finding Risks in Companies Nobody Else Is Watching
Norway's sovereign wealth fund uses AI to screen 7,200 portfolio companies for forced labor and corruption within 24 hours. The real story is the emerging-market coverage gap that traditional ESG data vendors miss — and what it means for any company with a global supply chain.
FAQ
01
What does it really mean to “redefine profit”?
02
What makes Council Fire different?
03
Who does Council Fire work with?
04
What does working with Council Fire actually look like?
05
How does Council Fire help organizations turn big goals into action?
06
How does Council Fire define and measure success?
Jul 30, 2026
Social Impact Frameworks vs Cost-Benefit in Urban Policy
Sustainability Strategy
In This Article
When to use cost-benefit analysis versus social impact frameworks in city projects, plus a practical 3-step workflow for decisions.
Social Impact Frameworks vs Cost-Benefit in Urban Policy
If I had to boil this down to one line: use cost-benefit analysis to ask “Is this project worth the money?” and use social impact frameworks to ask “Who wins, who loses, and where?”
For city decisions tied to $10 million to $100 million+ projects and 10- to 30-year timelines, one tool is rarely enough. A transit line can post a strong benefit-cost ratio, while still leaving a low-access area behind. A housing plan can add supply, but also increase displacement pressure. And in U.S. planning, equity still gets less than 10% of project scoring in many MPOs.
Here’s the short version:
Cost-benefit analysis (CBA) turns costs and gains into dollars.
Social impact frameworks track effects that do not fit neatly into dollar values.
CBA is strongest for efficiency, ranking, and budget choices.
Social frameworks are strongest for distribution, public input, and neighborhood effects.
The main comparison points are purpose, data, time frame, public input, and decision output.
The best path for many city teams is a 3-step flow:
Run CBA first
Run a social or equity review second
Use multi-criteria analysis if tradeoffs still remain
A few facts from the article make the split clear:
In hazard mitigation, every $1 invested saves about $6 in later disaster costs.
Mexico City’s Metrobús Line 3 showed a BCR of 1.54 and $90.6 million in NPV.
That same case also showed 78% of benefits going to income quintiles 1 through 3.
Quick Comparison
Criteria | Cost-Benefit Analysis | Social Impact Frameworks |
|---|---|---|
Main question | Is the project worth the cost? | Who is affected, and how? |
Output | NPV, BCR, IRR | Scorecards, narratives, group-by-group findings |
Main data | Costs, travel time, tax effects, safety, emissions | Census, ACS, evictions, GIS, surveys, interviews |
Time view | Discounts future effects | Looks across short-, medium-, and long-term effects |
Public input | Usually limited | Built into the process |
Best fit | Transit, infrastructure, fiscal review | Housing, displacement, access, neighborhood change |
Main gap | Can miss uneven harm across groups | Harder to standardize and takes more staff time |
So if you are choosing between the two, I would not treat this as an either-or call. CBA tells you whether a project adds net value. Social impact frameworks show whether that value is shared well or shifted onto people with the least room to absorb the cost.
Social Cost/Benefit Analysis - How does it work?
Cost-benefit analysis in urban policy
Cost-benefit analysis (CBA) turns a policy’s costs and benefits into dollar terms to test whether it creates net social value.[2][3] That makes it a solid tool for comparing options side by side. But once equity, voice, or local lived experience enters the picture, CBA starts to show its limits.
Purpose and core metrics
The main output is net present value (NPV): discounted benefits minus discounted costs over the life of the project.[2] Analysts also look at the benefit-cost ratio (BCR), which shows how much value a project returns for each dollar spent. If NPV is positive, discounted benefits are greater than discounted costs.
Discounting is what makes long-range comparison possible. A dollar received years from now is worth less than a dollar in hand today, so CBA applies a discount rate to future costs and benefits and converts them into present-value terms.[2] In plain English, the discount rate shapes how much weight long-term benefits receive.
Data, discounting, and common blind spots
A standard urban CBA usually draws on data such as capital costs, operating costs, travel time savings, safety effects like avoided crashes, emissions and other externalities, and property tax effects.[2] In hazard mitigation, the math can be striking: every $1 invested in mitigation saves an average of $6 in future disaster-related costs.[1]
The tougher issue is what CBA struggles to price. Social cohesion, displacement risk, and informal networks rarely come with clean market prices, so they’re often left out or squeezed into proxy measures that people can argue about for years.[3] That matters in practice. An infrastructure project may post a strong BCR and still add to climate gentrification, with higher property values putting more pressure on renters and on communities that have long received less public investment.
Where CBA works best in housing, transit, and land use
CBA works best when impacts can be measured with some confidence and the comparison is fairly direct. It fits transit appraisals, major infrastructure investments, and land-use planning cases where fiscal returns and avoided damages can be quantified.[2]
It works less well when distribution matters just as much as efficiency. A land-use change can look like a clear win on NPV while pushing displacement pressure into lower-income neighborhoods. CBA tends to capture gains more easily than distributional losses, which is why social impact frameworks are often used alongside it.
Social impact frameworks in urban policy
Social impact frameworks turn equity questions into a structured way to assess who gains, who carries the costs, and how policy shifts daily life. That matters because cost-benefit analysis often misses distribution, lived experience, and fairness. These frameworks help city teams track nonmarket effects such as displacement risk, neighborhood cohesion, perceived safety, access to opportunity, and community trust.
Purpose and main framework types
Social impact frameworks are methods used to identify, assess, and manage the social outcomes of policy and investment decisions.[7] In urban policy, four frameworks show up again and again:
Framework | Main purpose | Best use in urban policy |
|---|---|---|
Social Impact Assessment (SIA) | Identify and manage social effects before decisions are made | Housing, transit, land use, redevelopment[7] |
Multi-Criteria Analysis (MCA) | Compare options across equity, safety, access, and other non-monetary criteria | |
Social Return on Investment (SROI) | Estimate social value created relative to dollars invested | Programs with mixed social outcomes and funder reporting[9] |
Equity frameworks | Evaluate who benefits and who bears costs across racial, income, and geographic lines |
What makes these tools useful is simple: they combine data with public input.
Cities often pair SIA with equity screening. They may also use MCA criteria to reflect what residents care about most, especially when a clean dollar figure can't tell the whole story.
Data sources and the role of public input
Social frameworks rely on mixed evidence. Cities often combine Census and ACS data with eviction filings, transit ridership, 311 patterns, and GIS layers for sidewalks, parks, stops, and lighting.
Numbers only go so far. Qualitative data helps fill the gap. Community surveys, interviews, focus groups, and participatory mapping sessions bring in lived experience and surface distributional concerns that administrative records can miss. OECD guidance says stakeholder participation surfaces impacts from different perspectives and makes policy assumptions visible.[5] In strong social frameworks, public input is not a one-and-done public hearing. It is built into the full decision cycle, from co-defining the problem to reviewing options and tracking outcomes after implementation.[6]
That blend of evidence makes these frameworks useful for comparing options, not just listing impacts.
Where social frameworks add value in city decisions
In housing, social frameworks can assess displacement risk by tracking rent burdens, eviction rates, proximity to new infrastructure, and demographic shifts tied to gentrification pressure.[4][8] HUD's Affirmatively Furthering Fair Housing process, for example, explicitly requires analysis of racial and ethnic segregation, racially and ethnically concentrated areas of poverty, and neighborhood disparities in access to community assets.[4]
In transit, a social framework can show whether a proposed route improves job access for low-income riders within a 30- to 45-minute commute. For land use decisions, these tools assess walkability, park access, urban heat exposure, and the preservation of cultural landmarks. IAIA treats impact equity as a fair share of benefits and burdens.[7] That idea is tough to turn into a single benefit-cost ratio.
For city teams, the goal is not to pick one framework and use it for everything. The better move is to match the tool to the policy question. That is where these frameworks earn their place: they turn distributional questions into structured inputs for comparing policy options.
The next section shows how these tools differ from cost-benefit analysis in purpose, data, time horizon, and decision output.
Social impact frameworks vs. cost-benefit analysis: key differences
Building on the two tools above, the main difference isn’t whether they work. It’s what each one lets you see.
CBA turns project effects into a single dollar figure. Social impact frameworks keep benefits and burdens in view across groups, places, and time. Effects that are hard to price often get left out of CBA or handled through rough proxies. In social frameworks, those same effects sit near the center of the analysis.
Purpose, data, and decision outputs
CBA converts almost everything into dollars. Travel time savings, property value changes, and lower vehicle operating costs all receive a monetary value and then get rolled into one figure, usually a net present value (NPV) or benefit-cost ratio (BCR) [12][13]. That makes project ranking and spending decisions easier.
Social impact frameworks lead to a different kind of output. Instead of one number, they produce a scorecard, a narrative, or a distributional breakdown that shows how a project affects different groups. A social impact assessment might show that a transit project improves access for one neighborhood while leaving another with little change in job access. In a single ratio, that kind of gap can vanish.
Criteria | Cost-Benefit Analysis | Social Impact Frameworks |
|---|---|---|
Key outputs | NPV, BCR, internal rate of return | Scorecards, narratives, distributional findings |
Equity focus | Usually secondary or absent | Central to the analysis |
Public input | Limited; expert-led | Built into the process; participatory |
Strengths | Clear project comparison; standardized | Captures lived experience; surfaces distributional harms |
Limitations | Can justify projects that harm marginalized groups | Resource-intensive; harder to standardize |
Time horizon, equity, and public participation
CBA heavily discounts future impacts, which can push down the weight given to slow-building harms like environmental degradation, long-term displacement pressure, and the loss of neighborhood cohesion [10][11].
Social frameworks do not formally discount the future. They can lay out impacts across several time frames: construction disruption now, neighborhood change over the next decade, and the shape of opportunity for children growing up in affected communities later on. That makes them a better fit for decisions where long-run and intergenerational effects carry the most weight [15].
Public participation shows the split just as clearly. CBA is usually prepared by economists or consultants and then handed to decision-makers. Residents may speak at a public hearing, but their input seldom changes the model’s core assumptions. Social impact frameworks are built differently. They bring people in earlier through workshops, participatory mapping, and focus groups, then use what they hear to define impact categories and read the findings [14][17].
How each method shapes housing, transit, and land use decisions
Take a transit project such as a rapid bus extension or rail line. A CBA might show a strong BCR because of large total travel time savings and ridership gains. A social impact framework, though, might show that the project skips a low-access neighborhood, leaving some areas with little gain in job access [16].
Housing brings the same tension into view. CBA can support new supply, while social frameworks can flag displacement risk and uneven neighborhood effects.
Land use decisions follow the same pattern. A CBA might support upzoning a neighborhood because it is projected to increase taxable property values. A social impact framework would ask who lives there now, what displacement risk looks like, and whether local anchors would make it through the shift. Evidence from Chicago's public housing demolitions found that aggregate household welfare barely changed, but effects were unevenly distributed across demographic groups [18]. That’s the kind of tradeoff a net-benefit calculation on its own can miss.
That’s why many city teams need both tools before choosing a path. Used together, they separate efficiency from equity before a final decision is made.
Using both methods together: a closing comparison
CBA vs Social Impact Frameworks: 3-Step Decision Workflow for City Teams
Once you put the two tools side by side, the next step is pretty practical: how do city teams use them in the same project? The answer is to use each one for what it does best. CBA tests economic value. Social impact frameworks test who wins, who pays, and where harm may fall. Together, they give city staff a more complete view of a decision.
A practical combined approach for city teams
A simple workflow helps keep the methods in the right sequence:
Run CBA first to test feasibility.
Apply a social impact or equity assessment second to examine who gains, who bears costs, and who faces displacement risk.
Use multi-criteria analysis (MCA) third when tradeoffs cannot be monetized.
Each step answers a different question. CBA asks whether the project creates economic value. Social impact review looks at distributional effects. MCA helps rank options when some tradeoffs do not fit neatly into dollar terms.
You can see this layered approach in actual city work. Mexico City's Metrobús Line 3 is a clear example. The CBA found a BCR of 1.54 and an NPV of $90.6 million, while the distributional analysis found that 78% of benefits went to income quintiles 1 through 3 [19].
That matters because urban decisions rarely touch just one issue. A transit line, zoning change, or housing plan can shape jobs, rent pressure, and climate exposure all at once.
Key takeaways for decision-makers
Use CBA to test efficiency. Use social impact frameworks to test equity. Use both when the stakes are high, especially in housing, transit, and land-use decisions. In many U.S. MPOs, equity still counts for less than 10% of project scoring [20], which means social impacts need explicit weight.
FAQs
When should a city use both CBA and a social impact review?
Cities should use both when they need a fuller review of a policy or project’s financial accountability and its public value.
CBA is useful for measuring fiscal efficiency, but it can miss effects such as community health, social equity, and resilience. That gap matters. In infrastructure and climate resilience projects, the dollars may tell only part of the story. A seawall, cooling center, transit upgrade, or stormwater system might not show its full worth through direct financial returns alone, even though residents feel the impact for years.
Using both approaches gives city leaders a better read on what a project costs, what it returns, and who gains from it.
How do discount rates affect long-term urban policy decisions?
Discount rates shape long-term urban policy because they change how we value future costs and benefits in the present. That matters a lot in sustainability projects, where many of the gains may not show up for decades.
With standard cost-benefit analysis, natural capital can be undervalued once the timeline stretches past 20–25 years. In plain terms, the farther those benefits sit in the future, the easier they are to shrink on paper today. To deal with that, policymakers may choose lower discount rates - such as the EPA’s 2% rate - to give long-term impacts more weight and keep decisions in line with policy goals.
What data is needed to measure displacement and equity impacts?
Use both quantitative and qualitative data. The numbers matter, but they don’t tell the whole story on their own. Break quantitative data out by income, race, age, and location so you can see where gaps and disparities show up instead of letting them blur into a citywide average.
Key inputs include:
Housing cost burdens
Eviction filings
Demographic shifts
Utility shutoffs
Social vulnerability indices
Qualitative data adds the human side of the picture. Surveys, focus groups, and interviews help surface residents’ lived experiences, their feelings of safety, and the effects on community stability.
Related Blog Posts
Latest Articles
©2025
Narrative Change and Power Building: The Missing Half of Advocacy
Narrative change is the process of disrupting dominant narratives that normalize inequity and advancing new narratives from historically marginalized communities.
Funding Resilience Without Federal Grants
BRIC is unreliable and FEMA is shrinking. Here's how cities fund climate resilience with dedicated revenue, blended finance, and a coordinating authority.
The ESG Blind Spot: How AI Is Finding Risks in Companies Nobody Else Is Watching
Norway's sovereign wealth fund uses AI to screen 7,200 portfolio companies for forced labor and corruption within 24 hours. The real story is the emerging-market coverage gap that traditional ESG data vendors miss — and what it means for any company with a global supply chain.
FAQ
01
What does it really mean to “redefine profit”?
02
What makes Council Fire different?
03
Who does Council Fire work with?
04
What does working with Council Fire actually look like?
05
How does Council Fire help organizations turn big goals into action?
06
How does Council Fire define and measure success?
Jul 30, 2026
Social Impact Frameworks vs Cost-Benefit in Urban Policy
Sustainability Strategy
In This Article
When to use cost-benefit analysis versus social impact frameworks in city projects, plus a practical 3-step workflow for decisions.
Social Impact Frameworks vs Cost-Benefit in Urban Policy
If I had to boil this down to one line: use cost-benefit analysis to ask “Is this project worth the money?” and use social impact frameworks to ask “Who wins, who loses, and where?”
For city decisions tied to $10 million to $100 million+ projects and 10- to 30-year timelines, one tool is rarely enough. A transit line can post a strong benefit-cost ratio, while still leaving a low-access area behind. A housing plan can add supply, but also increase displacement pressure. And in U.S. planning, equity still gets less than 10% of project scoring in many MPOs.
Here’s the short version:
Cost-benefit analysis (CBA) turns costs and gains into dollars.
Social impact frameworks track effects that do not fit neatly into dollar values.
CBA is strongest for efficiency, ranking, and budget choices.
Social frameworks are strongest for distribution, public input, and neighborhood effects.
The main comparison points are purpose, data, time frame, public input, and decision output.
The best path for many city teams is a 3-step flow:
Run CBA first
Run a social or equity review second
Use multi-criteria analysis if tradeoffs still remain
A few facts from the article make the split clear:
In hazard mitigation, every $1 invested saves about $6 in later disaster costs.
Mexico City’s Metrobús Line 3 showed a BCR of 1.54 and $90.6 million in NPV.
That same case also showed 78% of benefits going to income quintiles 1 through 3.
Quick Comparison
Criteria | Cost-Benefit Analysis | Social Impact Frameworks |
|---|---|---|
Main question | Is the project worth the cost? | Who is affected, and how? |
Output | NPV, BCR, IRR | Scorecards, narratives, group-by-group findings |
Main data | Costs, travel time, tax effects, safety, emissions | Census, ACS, evictions, GIS, surveys, interviews |
Time view | Discounts future effects | Looks across short-, medium-, and long-term effects |
Public input | Usually limited | Built into the process |
Best fit | Transit, infrastructure, fiscal review | Housing, displacement, access, neighborhood change |
Main gap | Can miss uneven harm across groups | Harder to standardize and takes more staff time |
So if you are choosing between the two, I would not treat this as an either-or call. CBA tells you whether a project adds net value. Social impact frameworks show whether that value is shared well or shifted onto people with the least room to absorb the cost.
Social Cost/Benefit Analysis - How does it work?
Cost-benefit analysis in urban policy
Cost-benefit analysis (CBA) turns a policy’s costs and benefits into dollar terms to test whether it creates net social value.[2][3] That makes it a solid tool for comparing options side by side. But once equity, voice, or local lived experience enters the picture, CBA starts to show its limits.
Purpose and core metrics
The main output is net present value (NPV): discounted benefits minus discounted costs over the life of the project.[2] Analysts also look at the benefit-cost ratio (BCR), which shows how much value a project returns for each dollar spent. If NPV is positive, discounted benefits are greater than discounted costs.
Discounting is what makes long-range comparison possible. A dollar received years from now is worth less than a dollar in hand today, so CBA applies a discount rate to future costs and benefits and converts them into present-value terms.[2] In plain English, the discount rate shapes how much weight long-term benefits receive.
Data, discounting, and common blind spots
A standard urban CBA usually draws on data such as capital costs, operating costs, travel time savings, safety effects like avoided crashes, emissions and other externalities, and property tax effects.[2] In hazard mitigation, the math can be striking: every $1 invested in mitigation saves an average of $6 in future disaster-related costs.[1]
The tougher issue is what CBA struggles to price. Social cohesion, displacement risk, and informal networks rarely come with clean market prices, so they’re often left out or squeezed into proxy measures that people can argue about for years.[3] That matters in practice. An infrastructure project may post a strong BCR and still add to climate gentrification, with higher property values putting more pressure on renters and on communities that have long received less public investment.
Where CBA works best in housing, transit, and land use
CBA works best when impacts can be measured with some confidence and the comparison is fairly direct. It fits transit appraisals, major infrastructure investments, and land-use planning cases where fiscal returns and avoided damages can be quantified.[2]
It works less well when distribution matters just as much as efficiency. A land-use change can look like a clear win on NPV while pushing displacement pressure into lower-income neighborhoods. CBA tends to capture gains more easily than distributional losses, which is why social impact frameworks are often used alongside it.
Social impact frameworks in urban policy
Social impact frameworks turn equity questions into a structured way to assess who gains, who carries the costs, and how policy shifts daily life. That matters because cost-benefit analysis often misses distribution, lived experience, and fairness. These frameworks help city teams track nonmarket effects such as displacement risk, neighborhood cohesion, perceived safety, access to opportunity, and community trust.
Purpose and main framework types
Social impact frameworks are methods used to identify, assess, and manage the social outcomes of policy and investment decisions.[7] In urban policy, four frameworks show up again and again:
Framework | Main purpose | Best use in urban policy |
|---|---|---|
Social Impact Assessment (SIA) | Identify and manage social effects before decisions are made | Housing, transit, land use, redevelopment[7] |
Multi-Criteria Analysis (MCA) | Compare options across equity, safety, access, and other non-monetary criteria | |
Social Return on Investment (SROI) | Estimate social value created relative to dollars invested | Programs with mixed social outcomes and funder reporting[9] |
Equity frameworks | Evaluate who benefits and who bears costs across racial, income, and geographic lines |
What makes these tools useful is simple: they combine data with public input.
Cities often pair SIA with equity screening. They may also use MCA criteria to reflect what residents care about most, especially when a clean dollar figure can't tell the whole story.
Data sources and the role of public input
Social frameworks rely on mixed evidence. Cities often combine Census and ACS data with eviction filings, transit ridership, 311 patterns, and GIS layers for sidewalks, parks, stops, and lighting.
Numbers only go so far. Qualitative data helps fill the gap. Community surveys, interviews, focus groups, and participatory mapping sessions bring in lived experience and surface distributional concerns that administrative records can miss. OECD guidance says stakeholder participation surfaces impacts from different perspectives and makes policy assumptions visible.[5] In strong social frameworks, public input is not a one-and-done public hearing. It is built into the full decision cycle, from co-defining the problem to reviewing options and tracking outcomes after implementation.[6]
That blend of evidence makes these frameworks useful for comparing options, not just listing impacts.
Where social frameworks add value in city decisions
In housing, social frameworks can assess displacement risk by tracking rent burdens, eviction rates, proximity to new infrastructure, and demographic shifts tied to gentrification pressure.[4][8] HUD's Affirmatively Furthering Fair Housing process, for example, explicitly requires analysis of racial and ethnic segregation, racially and ethnically concentrated areas of poverty, and neighborhood disparities in access to community assets.[4]
In transit, a social framework can show whether a proposed route improves job access for low-income riders within a 30- to 45-minute commute. For land use decisions, these tools assess walkability, park access, urban heat exposure, and the preservation of cultural landmarks. IAIA treats impact equity as a fair share of benefits and burdens.[7] That idea is tough to turn into a single benefit-cost ratio.
For city teams, the goal is not to pick one framework and use it for everything. The better move is to match the tool to the policy question. That is where these frameworks earn their place: they turn distributional questions into structured inputs for comparing policy options.
The next section shows how these tools differ from cost-benefit analysis in purpose, data, time horizon, and decision output.
Social impact frameworks vs. cost-benefit analysis: key differences
Building on the two tools above, the main difference isn’t whether they work. It’s what each one lets you see.
CBA turns project effects into a single dollar figure. Social impact frameworks keep benefits and burdens in view across groups, places, and time. Effects that are hard to price often get left out of CBA or handled through rough proxies. In social frameworks, those same effects sit near the center of the analysis.
Purpose, data, and decision outputs
CBA converts almost everything into dollars. Travel time savings, property value changes, and lower vehicle operating costs all receive a monetary value and then get rolled into one figure, usually a net present value (NPV) or benefit-cost ratio (BCR) [12][13]. That makes project ranking and spending decisions easier.
Social impact frameworks lead to a different kind of output. Instead of one number, they produce a scorecard, a narrative, or a distributional breakdown that shows how a project affects different groups. A social impact assessment might show that a transit project improves access for one neighborhood while leaving another with little change in job access. In a single ratio, that kind of gap can vanish.
Criteria | Cost-Benefit Analysis | Social Impact Frameworks |
|---|---|---|
Key outputs | NPV, BCR, internal rate of return | Scorecards, narratives, distributional findings |
Equity focus | Usually secondary or absent | Central to the analysis |
Public input | Limited; expert-led | Built into the process; participatory |
Strengths | Clear project comparison; standardized | Captures lived experience; surfaces distributional harms |
Limitations | Can justify projects that harm marginalized groups | Resource-intensive; harder to standardize |
Time horizon, equity, and public participation
CBA heavily discounts future impacts, which can push down the weight given to slow-building harms like environmental degradation, long-term displacement pressure, and the loss of neighborhood cohesion [10][11].
Social frameworks do not formally discount the future. They can lay out impacts across several time frames: construction disruption now, neighborhood change over the next decade, and the shape of opportunity for children growing up in affected communities later on. That makes them a better fit for decisions where long-run and intergenerational effects carry the most weight [15].
Public participation shows the split just as clearly. CBA is usually prepared by economists or consultants and then handed to decision-makers. Residents may speak at a public hearing, but their input seldom changes the model’s core assumptions. Social impact frameworks are built differently. They bring people in earlier through workshops, participatory mapping, and focus groups, then use what they hear to define impact categories and read the findings [14][17].
How each method shapes housing, transit, and land use decisions
Take a transit project such as a rapid bus extension or rail line. A CBA might show a strong BCR because of large total travel time savings and ridership gains. A social impact framework, though, might show that the project skips a low-access neighborhood, leaving some areas with little gain in job access [16].
Housing brings the same tension into view. CBA can support new supply, while social frameworks can flag displacement risk and uneven neighborhood effects.
Land use decisions follow the same pattern. A CBA might support upzoning a neighborhood because it is projected to increase taxable property values. A social impact framework would ask who lives there now, what displacement risk looks like, and whether local anchors would make it through the shift. Evidence from Chicago's public housing demolitions found that aggregate household welfare barely changed, but effects were unevenly distributed across demographic groups [18]. That’s the kind of tradeoff a net-benefit calculation on its own can miss.
That’s why many city teams need both tools before choosing a path. Used together, they separate efficiency from equity before a final decision is made.
Using both methods together: a closing comparison
CBA vs Social Impact Frameworks: 3-Step Decision Workflow for City Teams
Once you put the two tools side by side, the next step is pretty practical: how do city teams use them in the same project? The answer is to use each one for what it does best. CBA tests economic value. Social impact frameworks test who wins, who pays, and where harm may fall. Together, they give city staff a more complete view of a decision.
A practical combined approach for city teams
A simple workflow helps keep the methods in the right sequence:
Run CBA first to test feasibility.
Apply a social impact or equity assessment second to examine who gains, who bears costs, and who faces displacement risk.
Use multi-criteria analysis (MCA) third when tradeoffs cannot be monetized.
Each step answers a different question. CBA asks whether the project creates economic value. Social impact review looks at distributional effects. MCA helps rank options when some tradeoffs do not fit neatly into dollar terms.
You can see this layered approach in actual city work. Mexico City's Metrobús Line 3 is a clear example. The CBA found a BCR of 1.54 and an NPV of $90.6 million, while the distributional analysis found that 78% of benefits went to income quintiles 1 through 3 [19].
That matters because urban decisions rarely touch just one issue. A transit line, zoning change, or housing plan can shape jobs, rent pressure, and climate exposure all at once.
Key takeaways for decision-makers
Use CBA to test efficiency. Use social impact frameworks to test equity. Use both when the stakes are high, especially in housing, transit, and land-use decisions. In many U.S. MPOs, equity still counts for less than 10% of project scoring [20], which means social impacts need explicit weight.
FAQs
When should a city use both CBA and a social impact review?
Cities should use both when they need a fuller review of a policy or project’s financial accountability and its public value.
CBA is useful for measuring fiscal efficiency, but it can miss effects such as community health, social equity, and resilience. That gap matters. In infrastructure and climate resilience projects, the dollars may tell only part of the story. A seawall, cooling center, transit upgrade, or stormwater system might not show its full worth through direct financial returns alone, even though residents feel the impact for years.
Using both approaches gives city leaders a better read on what a project costs, what it returns, and who gains from it.
How do discount rates affect long-term urban policy decisions?
Discount rates shape long-term urban policy because they change how we value future costs and benefits in the present. That matters a lot in sustainability projects, where many of the gains may not show up for decades.
With standard cost-benefit analysis, natural capital can be undervalued once the timeline stretches past 20–25 years. In plain terms, the farther those benefits sit in the future, the easier they are to shrink on paper today. To deal with that, policymakers may choose lower discount rates - such as the EPA’s 2% rate - to give long-term impacts more weight and keep decisions in line with policy goals.
What data is needed to measure displacement and equity impacts?
Use both quantitative and qualitative data. The numbers matter, but they don’t tell the whole story on their own. Break quantitative data out by income, race, age, and location so you can see where gaps and disparities show up instead of letting them blur into a citywide average.
Key inputs include:
Housing cost burdens
Eviction filings
Demographic shifts
Utility shutoffs
Social vulnerability indices
Qualitative data adds the human side of the picture. Surveys, focus groups, and interviews help surface residents’ lived experiences, their feelings of safety, and the effects on community stability.
Related Blog Posts
Latest Articles
©2025
Narrative Change and Power Building: The Missing Half of Advocacy
Narrative change is the process of disrupting dominant narratives that normalize inequity and advancing new narratives from historically marginalized communities.
Funding Resilience Without Federal Grants
BRIC is unreliable and FEMA is shrinking. Here's how cities fund climate resilience with dedicated revenue, blended finance, and a coordinating authority.
The ESG Blind Spot: How AI Is Finding Risks in Companies Nobody Else Is Watching
Norway's sovereign wealth fund uses AI to screen 7,200 portfolio companies for forced labor and corruption within 24 hours. The real story is the emerging-market coverage gap that traditional ESG data vendors miss — and what it means for any company with a global supply chain.
FAQ
What does it really mean to “redefine profit”?
What makes Council Fire different?
Who does Council Fire work with?
What does working with Council Fire actually look like?
How does Council Fire help organizations turn big goals into action?
How does Council Fire define and measure success?