
Sep 29, 2026 · 12 min read
Sustainability Strategy
In This Article
A controlled workbook and checklist for collecting, validating, and tracing Scope 1, 2, and 3 emissions data.
On this page
- How To Measure Scope 1, 2, and 3 Emissions - The Three Categories of Carbon Emissions of a Company
- Set up the control sheet and reporting boundaries
- Build the data-entry tabs for Scope 1, Scope 2, and Scope 3
- Add supplier inputs, emission factors, and conversion controls
- Run the pre-calculation review and finalize the file
- FAQs
Scope 1 2 3 Emissions Data Template
Most emissions files fail before the math starts. In my view, a good template is a controlled workbook that tracks who entered what, for which site, in which period, with which unit, source file, factor ID, and review status.
If I were setting this up for FY2026, I would keep it simple: collect raw activity data first, keep original units like kWh, therms, gallons, and ton-miles, do conversions in a separate sheet, and report final results in mtCO2e. I would also split the workbook into clear tabs for instructions, boundaries, Scope 1, Scope 2, Scope 3, supplier inputs, factors, conversions, review checks, and approved outputs.
Here’s the short version of what the template needs to do:
Set rules first: consolidation approach, base year, reporting standard, version, approver, and change log
Define boundaries: list each entity, site, fleet, project, or supplier with stable IDs and include/exclude decisions
Use one row per activity: one source, meter, vehicle group, shipment, supplier line, or bill per row
Keep raw data separate from math: activity data in entry tabs, factors in one sheet, conversions in another
Track proof: every row needs an owner, reviewer, source document, status, and notes
Handle all three scopes: direct fuel and refrigerants, purchased electricity and energy, and value-chain rows across the 15 Scope 3 categories that apply
Check before calculation: units, dates, duplicates, gaps, allocation methods, factor matches, and double counting
Lock the file down: protect formulas, control edits, keep version history, and store evidence in one place
A few details matter more than people think. Dates should use MM/DD/YYYY. Numbers should use commas for thousands and periods for decimals, like 12,500.75. Currency should be written as USD, not just $. If source data comes in short tons, I would convert it before final reporting.
Bottom line: the template should leave a clear trail from source record to final total, so a reviewer can test any number without guessing how it was built.
This article lays out the worksheet structure, control fields, row design, supplier inputs, factor setup, conversion steps, and pre-calculation checks I would use to build that file.
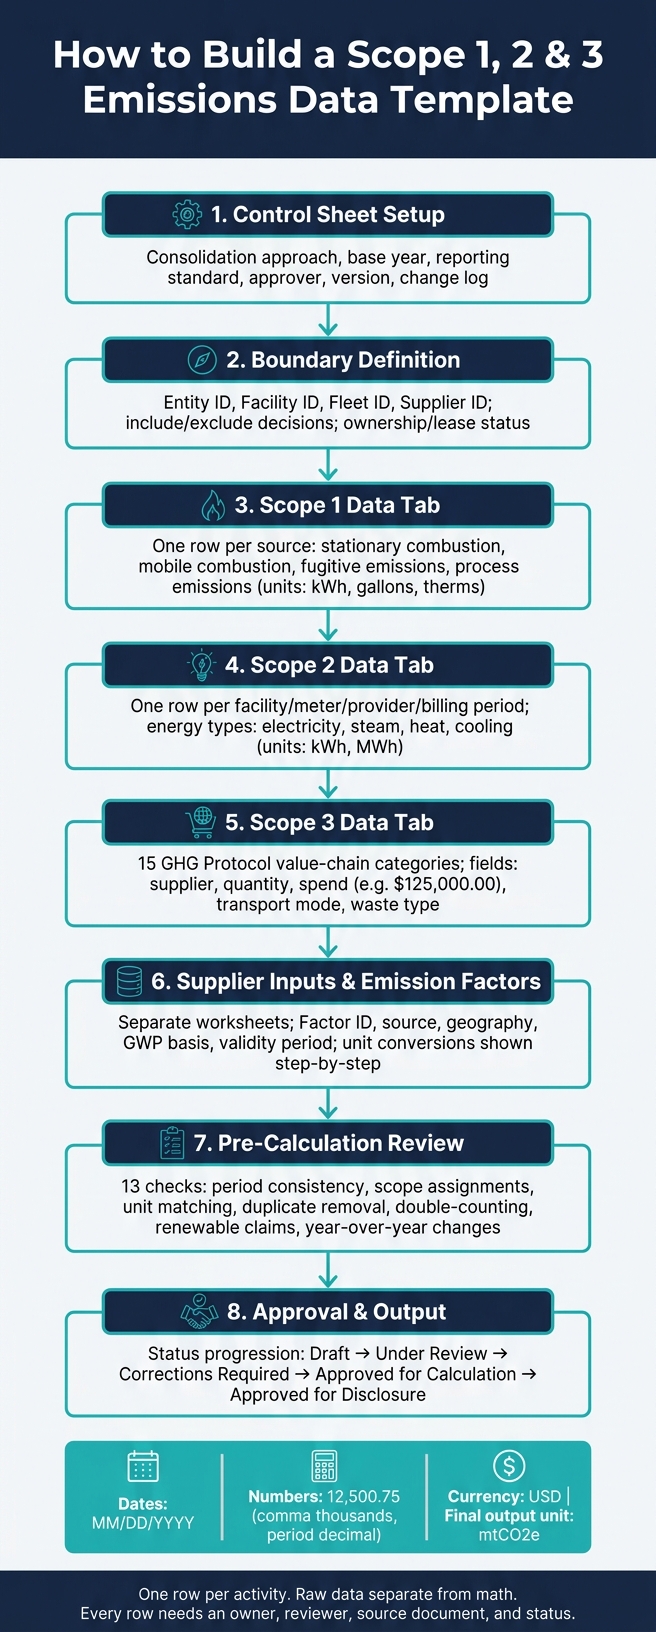
Scope 1 2 3 Emissions Template: Workbook Structure & Data Flow
How To Measure Scope 1, 2, and 3 Emissions - The Three Categories of Carbon Emissions of a Company
sbb-itb-8baf5f1
Set up the control sheet and reporting boundaries
Set the inventory rules in the control sheet before anyone starts entering data. Think of this sheet as the workbook’s rulebook: if the control fields aren’t set here first, the tabs that follow tend to drift. Just as important, these controls should match the column names used across every data-entry tab.
At the top of the master control sheet, record only the fields tied to governance: consolidation approach, base year, reporting standard, approver, version number, and change log.
Boundary and ownership fields to include
Record whether the inventory uses equity share, financial control, or operational control as its consolidation approach, along with an approval note.
For the operational boundary, note which source categories are included or excluded. That includes leased assets, purchased energy, refrigerants, company vehicles, travel, purchased goods, and downstream activities.
List every facility, fleet, business unit, and project as a separate row using stable identifiers such as Entity ID, Facility ID, Fleet ID, or Supplier ID. Include the site address, city, state, and country. Add the ownership or lease status, plus an include/exclude decision for each asset.
For each row, capture these control fields:
Named data owner and reviewer
Inclusion or exclusion decision and exclusion reason
Materiality rationale
Estimation method and assumptions
Source document reference
Approval reference
Data-quality or confidence rating
Collection frequency: monthly, quarterly, or annual
Use fixed values only for status:
| Status | Meaning |
|---|---|
| Not started | Collection has not begun |
| Requested | Data has been requested from the owner or supplier |
| Received | Raw data arrived but has not been checked |
| Validated | Basic completeness and plausibility checks passed |
| Estimated | A documented estimation method was used |
| Approved | The reviewer accepted the record for calculation |
Maintain a boundary decision log with the date, decision, affected entity or asset, consolidation approach, rationale, approver, and supporting evidence. The control sheet should also record the source of emission factors and the data-quality criteria used later in the workbook.
U.S. formatting, units, and naming rules
Use MM/DD/YYYY for all dates. If source records are in short tons, add a conversion field so the unit difference is resolved before final totals are reported in mtCO2e.
Once the boundary controls are in place, populate the Scope 1, Scope 2, and Scope 3 tabs using the same IDs, owners, and status fields.
Build the data-entry tabs for Scope 1, Scope 2, and Scope 3
With the control sheet locked in, the next job is to build the three data-entry tabs. One rule matters more than anything else: use one row for each source, meter, vehicle group, supplier line item, or activity. That setup makes the data easy to filter, trace, and reconcile during review. Keep raw activity data separate from calculated emissions, and never replace a source value with a formula output.
Bring the control-sheet IDs, owners, statuses, and evidence fields into every tab. Then add only the columns each scope needs. Shared dropdowns should cover scope, category, unit, measurement source, data-quality rating, and review status. Add those common fields once, then place the scope-specific fields after them.
Scope 1 direct emissions rows
Scope 1 rows should include direct sources only. The Scope 1 Data tab should cover every direct emission from sources your organization owns or controls. Build rows around six source types: stationary combustion, mobile combustion, process emissions, fugitive emissions, on-site waste treatment, and on-site power generation.
For stationary combustion, record the fuel type - natural gas, diesel, propane, or fuel oil - along with quantity, unit, equipment ID, and measurement source, such as meter read, tank gauge, or purchase record. For mobile combustion, log the vehicle group, fuel type, and quantity. Fugitive emission rows should include the refrigerant type, quantity added during servicing, and either a maintenance log or recharge invoice as evidence. In every case, mark whether the quantity is measured, purchased, or estimated.
Scope 2 purchased energy rows
The Scope 2 Data tab should use one row per facility, meter, provider, and billing period. Use a single annual row only when the source record itself is annual. Capture the energy type - electricity, steam, heat, or cooling - plus utility provider, account number, meter ID, billing dates, consumption quantity, unit (kWh, MWh, therms, or ton-hours), and grid region or balancing authority. When available, also include the supplier-specific emission factor, its source, and vintage, along with any location-based or market-based factor fields required by your reporting framework.
A few fields are easy to skip, but they matter a lot:
Flag any missing bills, plus any billing-period gap or overlap
For renewable energy instruments, record instrument type, quantity, certificate ID, market, and retirement status; if even one of these five fields is missing, trigger a validation warning
If a meter serves multiple tenants or business units, include the shared-meter allocation method and the allocated percentage
Scope 3 value-chain rows
Scope 3 uses the same row structure, but each line maps to a value-chain activity. The Scope 3 Data tab should organize rows by category, activity, supplier or source, quantity, unit, evidence, and quality rating. The GHG Protocol identifies 15 value-chain categories; include only the ones that apply to your organization. Mark excluded categories as not applicable, not material, or not yet assessed. [1]
The fields change based on the activity type:
Purchased goods and services: supplier name, product description, quantity or spend ($125,000.00), purchase-order or invoice reference, and, when available, supplier-specific emissions data, geography, and allocation basis
Upstream transportation: shipment weight, distance, origin and destination, transportation mode, and carrier
Waste generated in operations: waste material type, quantity, treatment method (landfill, recycling, composting, or incineration), waste contractor, and a manifest or contractor report reference
Business travel: travel mode, passenger-miles, origin and destination, travel class, hotel nights where needed, booking provider, and a travel-expense or agency report reference
For each Scope 3 row, record the category number and name, calculation method, geography, allocation basis, evidence reference, and data-quality rating: High for supplier-specific measured data, Medium for company records with a representative factor, and Low for spend-based or proxy data.
Add supplier inputs, emission factors, and conversion controls
Once your data-entry tabs are in place, give supplier responses, factor libraries, and unit conversions their own worksheets. If you fold all of that into the activity tabs, tracing a number gets messy fast. You want to see where it came from, who checked it, and whether it was measured, calculated, estimated, or missing.
Supplier input request fields
Set up a Supplier Inputs worksheet with one row for each supplier–product or supplier–service record. It helps to group the fields by function so the sheet stays easy to scan.
Identity
Supplier legal name and ID
Contact person, email, and date received
Activity
Product or service description
Scope 3 category and reporting period
Quantity supplied and unit
Purchase value in USD
Emissions and method
Supplier Scope 1 and Scope 2 emissions where relevant
Supplier-reported emissions
Calculation methodology
Organizational boundary and allocation basis
Gases included, GWP basis, factor source, and boundary type (cradle-to-gate, facility-only, or other)
Verification status and renewable-energy or other claims
Evidence
Supporting-document link or file name
Include allocation method and organizational boundary for every supplier-reported emissions value
Each row should keep the original response, the normalized value, and the reviewer trail. Also link every supplier row to one factor ID and one conversion row. That one-to-one trace makes review much cleaner.
Emission factors and unit conversion worksheet
Keep factors and conversions apart so each activity row points back to one source. Build a separate Emission Factors worksheet. For each factor, store the factor ID, source, geography, publication year, and validity period. Each row should also include factor name, activity category, factor value, factor unit, gases covered, GWP basis and assessment report version, technology or fuel type, source organization, and applicability notes.
For unit conversions, use separate columns instead of burying all the logic in one cell. Show each step on its own:
Original quantity
Conversion factor
Converted quantity
Emission factor
Result in kgCO2e
Result in mtCO2e
Lock the factor-library cells, and use data validation for units so blank or incompatible entries get flagged before the math runs.
Data quality method comparison
Use this table to pick one method per row before calculation.
| Method | Required inputs | Strengths | Limitations | Review requirements |
|---|---|---|---|---|
| Supplier-specific data | Supplier activity or product emissions data, methodology, reporting period, boundary, verification status | Can be more representative of actual emissions and supplier performance | Often incomplete, inconsistent, or hard to verify across suppliers | Check methodology, boundary, reporting year, allocation approach, and evidence quality |
| Activity data plus emission factor | Internal quantity data such as fuel, electricity, distance, mass, or volume, plus a matched emission factor | Usually more transparent and easier to audit than spend-based estimates | Depends on accurate units, source coverage, and correct factor selection | Confirm unit-to-factor alignment, factor source, geography, and conversion logic |
| Spend-based or average-factor estimate | Spend amount or category average values, plus an appropriate economic or average factor | Useful when primary activity data is unavailable and for broad screening | Less precise and may miss supplier or product differences | Document why primary data was unavailable, confirm category fit, and flag as estimated |
Run the pre-calculation review and finalize the file
With the data, factors, and conversions in place, pause before you calculate anything. This is the last quality check, and it’s the point where small errors can still be fixed before they turn into bad totals.
Review checks to complete before calculation
Add a dedicated Pre-Calculation Review worksheet with one row for each control. Each row should confirm one clear item. The table below covers the checks that matter most before calculation runs.
| Check | What to confirm |
|---|---|
| Reporting period and boundaries are consistent across all tabs | Every record uses the same start and end dates; included entities, facilities, leased assets, and operating sites are listed; exclusions have written justifications |
| All relevant sources are covered | Facilities, vehicles, equipment, purchased energy, and Scope 3 categories are included or formally excluded |
| Scope and category assignments are correct | Company-controlled fuel combustion and process sources are Scope 1; purchased electricity or energy is Scope 2; value-chain emissions are Scope 3 |
| Every record has a quantity and unit | No blank or unclear unit fields remain |
| Supplier allocation method is documented | Allocation basis, denominator, and any allocation percentage are recorded for each supplier submission |
| Emission factors match activity units | Factor geography, year, gas coverage, and global warming potential basis align with each record |
| Duplicate records have been removed | Utility bills, fuel logs, and supplier submissions have been checked for overlapping entries |
| Intercompany transactions are resolved | Internal fuel, electricity, and transport records are not also counted as external value-chain activity |
| Estimates are labeled | Each estimated value has a method or proxy and a planned replacement date |
| Renewable electricity claims are documented | Certificate or contract identifier, vintage, quantity, market, and retirement or cancellation evidence are recorded |
| Double counting across scopes has been reviewed | No activity appears in both Scope 1 and Scope 3, or in multiple Scope 3 categories without documentation |
| Year-over-year changes have explanations | Material increases or decreases are tied to operational causes, not silent methodology shifts |
| Exclusions and missing data are disclosed | Every gap has a label - "not available", "not applicable", or "excluded" - with a reason |
Review log columns and approval trail
The review worksheet needs more than a simple pass/fail field. Each row should include Check ID, Check, Scope/category, Pass / Fail / N/A, Owner, Reviewer, Evidence reference, Issue, Priority, Corrective action, Due date, Resolution status, Resolution evidence, Approval date, and Approver.
Use one file-naming pattern for evidence so people can find source files without digging through folders. For example: FY2026_Scope2_Utility_CA_Site01_2026-09-29_v01.pdf.
That kind of naming may feel a bit strict, but it saves time when review picks up speed.
A few file controls matter here too:
Lock calculation cells
Restrict edit access to designated owners
Preserve version history
Retain source documents in a controlled repository
Do not calculate or share totals until all critical checks are resolved. If you allow conditional approval, document the issue, the impact, the owner, and the remediation date.
What the finished template should deliver
The finished template should deliver a traceable inventory that is ready for calculation and review. Recommended final status fields are Draft, Under review, Corrections required, Approved for calculation, and Approved for disclosure.
Only then should the workbook move to approval for calculation.
FAQs
What’s the easiest way to start this template?
Start with a gap analysis. Put your internal KPIs side by side with reporting requirements, then look for what doesn’t line up: missing data, mismatched definitions, and the gaps that matter most.
After that, lock in a core data set. This should cover items like total energy use. Standardize units too - use kWh for electricity and metric tons of CO2e for emissions - so your reporting stays consistent from one cycle to the next.
How do I handle missing or estimated emissions data?
Prioritize transparency and steady improvement, not perfection. For Scope 3, it’s fine to use sector averages, proxy calculations, or conservative estimates when data gaps show up. If primary data isn’t available yet, start with spend-based methods and improve the data as you go.
Write down every assumption, method, and data source so you have an audit-ready trail. Keep your attention on the categories that matter most, and use the same methodology year over year.
Which Scope 3 categories should I include?
Screen all 15 GHG Protocol Scope 3 categories to see which ones matter for your business. You don’t need detailed math for every category, but you do need to record why any category was left out.
Put your attention on categories that stand out based on:
size
influence
risk
stakeholder interest
outsourcing patterns
A simple rule of thumb helps here: categories that make up more than 5% of your total Scope 3 estimate are usually treated as material.



FAQ