
Jul 19, 2026
ESG Data Collection: Step-by-Step Guide
ESG Strategy
In This Article
Treat ESG reporting like a financial close: collect source records, assign owners, enforce controls, and validate every metric.
ESG Data Collection: Step-by-Step Guide
If your ESG data is not tied to source records, named owners, and review steps, it is not ready for reporting. I’d boil the process down to four moves: define what must be reported, assign ownership, collect raw data from source systems, and validate every figure before disclosure.
Here’s the short version:
Start with reporting needs. Map each disclosure requirement to a field, unit, source, and owner.
Pick the KPIs that matter most. Link each topic to a formula, unit, and reporting boundary.
Set control rules early. Separate who prepares, reviews, and approves the data.
Collect raw inputs, not final metrics. For example, gather kWh, therms, gallons, hours worked, and headcount first.
Check data before roll-up. Look for missing values, duplicates, and unusual swings.
Build an evidence file for each number. Save invoices, exports, logs, factor references, and sign-offs.
A few points stand out. The article frames ESG data like a financial close, which is the right model for teams facing SEC, California, ISSB, GRI, or CDP reporting pressure. It also stresses that Scope 1, Scope 2, workforce, safety, and governance figures need fixed units, clear boundaries, and a record of any changes in method. That matters because assurance work is getting tighter, and weak documentation can slow reporting fast.
I also like the article’s core message: do not start with calculations. Start with source data, standard intake, and review steps. From there, turn raw inputs into reportable metrics with the same rules each year.
If I had to sum it up in one line, it’s this: good ESG reporting depends less on collecting more data and more on controlling the data you already have.
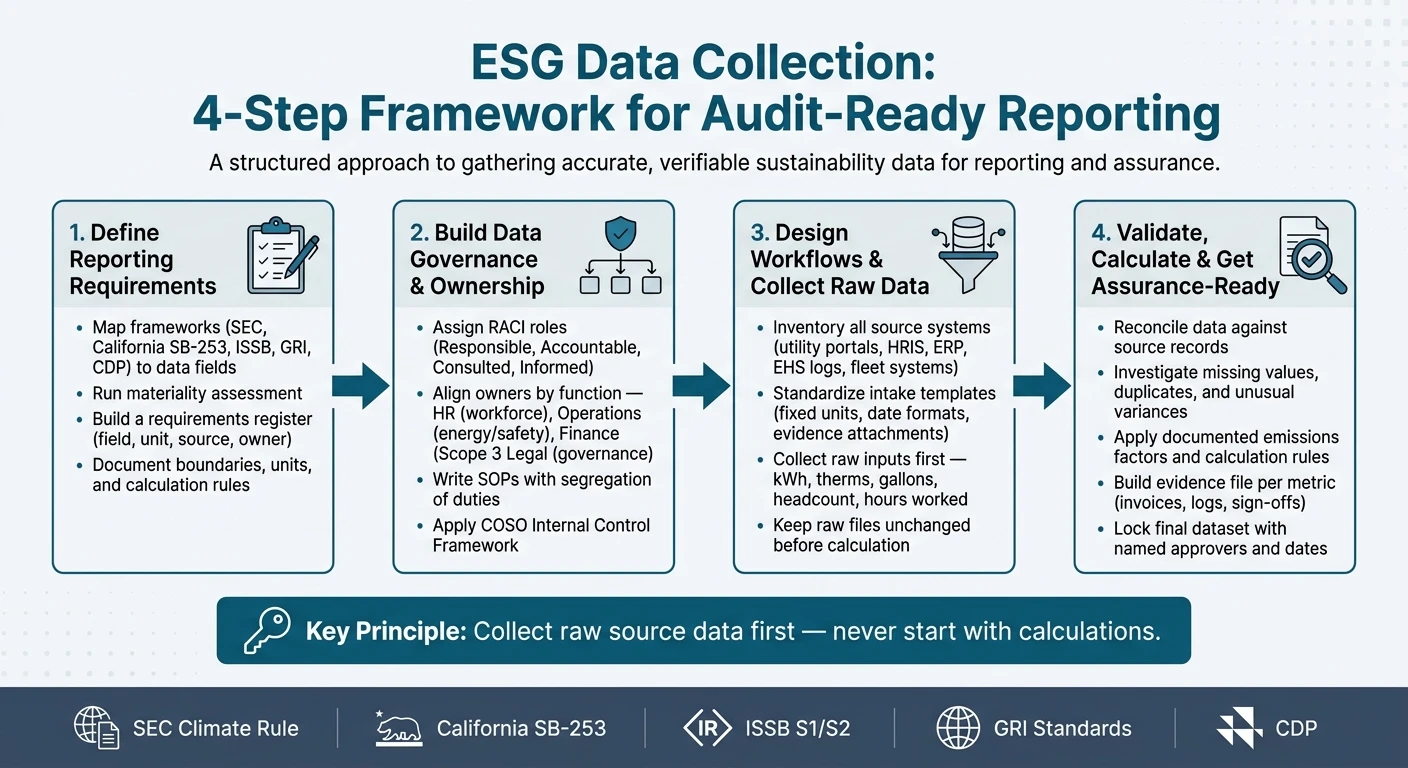
ESG Data Collection Process: 4-Step Framework for Audit-Ready Reporting
Simplifying ESG Data Management: A Practical Approach
1. Define Reporting Requirements, Material Topics, and Metrics
Before your team pulls even one data point, get clear on what you need to report and why it matters. That sounds obvious, but this is where many reporting efforts go sideways. If a disclosure asks for one thing and your systems store another, you're stuck fixing gaps later. The better move is to translate each requirement into exact data fields, units, and named owners from the start.
Map Frameworks and Regulatory Expectations to Data Needs
Most companies face overlap across frameworks, so the goal is not to collect everything under the sun. It's to collect the disclosures that apply to your business.
The SEC's 2024 climate disclosure rule requires large accelerated filers to disclose material Scope 1 and/or Scope 2 GHG emissions in aggregate CO₂e, reported gross of offsets.[4] California's SB-253 requires Scope 1, 2, and 3 emissions for companies with more than $1 billion in annual revenue doing business in California.[7] ISSB's IFRS S1 and S2 set a global baseline for sustainability and climate disclosure, building on TCFD's four pillars and SASB's industry-specific metrics, with effective periods beginning January 1, 2024.[5][6] GRI focuses on impact-based disclosures, including community impacts, human rights, and detailed environmental data. CDP adds more detailed climate, water, and forests questionnaires for companies answering investor and customer requests.
A practical way to manage this is to build a requirements register. Think of it as the master sheet for your reporting program. For each disclosure item, log:
the required field
the unit of measure
the source system
the owner
That level of detail saves time later. For example, the SEC requirement to disclose Scope 2 emissions turns into two separate data fields: location-based CO₂e and market-based CO₂e. Those fields may pull from utility bills measured in kWh, renewable energy certificate (REC) records, and the EPA eGRID emissions factor database.[3]
Framework / Rule | Key Data Points |
|---|---|
SEC Climate Rule | Scope 1 & 2 emissions (CO₂e), climate-related capital expenditures, financial impacts |
Scope 1, 2, & 3 emissions (third-party verified) | |
ISSB S1 / S2 | Industry-specific KPIs (SASB), climate risk metrics, Scope 1, 2, and relevant Scope 3 emissions |
GRI Standards | Workforce diversity, water stress, waste, health & safety (TRIR) |
CDP | Water scarcity risk, carbon pricing, forest-related impacts |
Once those fields are locked in, assign owners and set the approval path. If nobody owns a metric, it usually doesn't get delivered on time.
Run a Materiality Assessment and Select Priority KPIs
A materiality assessment helps answer one plain question: which ESG topics matter enough to track and report? Not every topic deserves the same attention, and trying to track too much can bury your team in noise.
This usually means talking with investors, employees, customers, regulators, and suppliers, then scoring each topic based on business impact and stakeholder importance. Topics that score high on both land in the top-right quadrant of the materiality matrix. Those become your reporting priorities.
From there, build your KPI set and data dictionary around that short list. Each material topic should connect to a KPI that is specific, measurable, and tied to a clear formula and unit.
For climate, that often includes Scope 1 emissions, meaning direct emissions from owned or controlled sources, measured in metric tons CO₂e. It also includes Scope 2 emissions from purchased electricity, steam, heat, or cooling, measured in metric tons CO₂e using both location-based and market-based methods. Depending on the business, you may also need relevant Scope 3 categories such as business travel or purchased goods and services.
For workforce topics, companies often track demographics by gender, race/ethnicity, job level, and location. For safety, use OSHA definitions. Total Recordable Incident Rate (TRIR) should be calculated from OSHA-recordable incidents and total hours worked. Governance KPIs may include the percentage of independent directors and the percentage of employees trained on anti-bribery policies.
The point is simple: a topic is not report-ready until it has a KPI, a formula, a unit, and a clear owner.
Document Boundaries, Units, and Calculation Rules
Boundary decisions shape everything that follows. They determine which entities and operations count, and which do not. If those lines are fuzzy, your numbers will be too.
For GHG emissions, many organizations use an operational control approach under the GHG Protocol. That means covering all facilities where the company has authority to implement operating policies. Your boundary documentation should list every included legal entity, facility, and value-chain segment, including offices, plants, warehouses, and data centers. It should also explain any exclusions in plain language.
Units matter just as much. Before data intake starts, confirm that source systems use the same units. One team may report electricity in kWh, another in MWh. One site may log fuel in gallons, another in liters. If you don't standardize up front, your team ends up cleaning a mess later.
Document these rules in a data dictionary and methodology manual. That should cover factor sources, GWP version, estimation rules, and restatement policy.[2][6] Material changes to those rules should go through formal approval by governance bodies such as the audit committee or sustainability steering committee before each reporting cycle.
With scope, metrics, and calculation rules in place, the next step is to set owners and controls before data collection begins.
2. Build ESG Data Governance, Ownership, and Controls
Once metrics, boundaries, and calculation rules are set, governance is what turns ESG reporting into a controlled process. At that point, the issue is simple: who owns each number, who checks it, and what keeps mistakes from getting through? If ownership is fuzzy and controls are weak, ESG data tends to show up late, clash across teams, and fall apart under scrutiny.
Assign Data Owners and Approval Roles
A RACI matrix is a standard way to assign ESG responsibilities. For every ESG metric in your data register, define who is Responsible for collecting and entering the data, who is Accountable for data quality and sign-off, who is Consulted on methodology, and who is Informed when updates happen.
Ownership should sit with the function closest to the source data:
HR - workforce metrics such as headcount, turnover, training hours, and DEI demographics; accountable owner: CHRO
Operations - energy, fuel, water, waste, and safety incidents; accountable owner: COO or regional operations director
Finance - spend-based inputs for Scope 3 estimation, such as purchased goods and services
Legal and Compliance - board composition, policy metrics, and anti-corruption training completion; accountable owner: General Counsel or Chief Compliance Officer
Each metric should also be logged in an ESG data catalogue with its source, formula, owner, approval path, and reporting destination. That record becomes the working map for the whole process. After owners are in place, the next job is to spell out how data gets reviewed, approved, and stored.
Set Policies, Procedures, and Quality Controls
Written SOPs keep governance steady when deadlines get tight. Each SOP should spell out data collection frequency, approved source systems, aggregation rules, review steps, evidence retention rules, escalation paths for missing or unusual data, and how exceptions are logged, investigated, resolved, and approved before reporting.
Two controls matter more than the rest.
First, segregation of duties. The person entering data should not also approve it, and neither role should sit with the person who set the methodology. That separation cuts the chance of unchecked errors and makes review more than a rubber stamp.
Second, change logs. Any update to a metric definition, emissions factor, or boundary decision should be recorded with the date, reason, owner, and downstream effect on reported figures. During external assurance, those logs are not paperwork for paperwork’s sake. They are part of the evidence trail.
Use a Controls Framework for Sustainability Reporting
The COSO Internal Control–Integrated Framework is the most widely referenced structure for building internal controls over sustainability reporting (ICSR), and it maps cleanly onto ESG data.[8][1][11] Its five components fit the work in a direct, practical way:
COSO Component | What It Means for ESG Data |
|---|---|
Control Environment | Board oversight of ESG, ESG commitments in the Code of Conduct, executive accountability tied to sustainability performance |
Risk Assessment | Treat ESG misstatement and greenwashing as explicit risks; assess data-quality vulnerabilities by metric and source system |
Control Activities | Preventive controls such as standardized templates and unit validation, detective controls such as variance analysis and range checks, and multi-level approval workflows |
Information & Communication | Every reported figure should be traceable to its source, with clear guidance and deadlines communicated to all data owners |
Monitoring | Periodic internal audits of ESG data processes, with corrective actions tracked and closed before the next reporting cycle |
The Institute of Internal Auditors treats greenwashing as a fraud risk.[9][10] That’s the right lens. If a company applies strict controls to financial reporting but treats ESG data as informal, it leaves a gap that can turn into a reporting problem fast.
Once ownership and controls are in place, data collection can move into standardized source-system workflows.
3. Design Data Workflows and Collect ESG Information
Once governance is set, the next job is building the intake workflow: where the data lives, how people submit it, and where it sits before any calculations happen.
Inventory Source Systems and Standardize Data Intake
Begin with a plain, complete list of every system that holds ESG-related data. For many U.S.-based organizations, that means utility invoices and online utility portals, fleet management systems, travel and expense platforms, ERP and finance systems, HRIS, EHS or safety logs, waste hauler reports, supplier questionnaires, and building management systems. Put each source into a register that tracks the system name, the ESG topics it covers, the data owner, and the evidence type.
That step sounds basic, but it saves a lot of pain later. If you don't know where the data starts, you end up chasing numbers at the end of the reporting cycle.
After the sources are mapped, standardize how data enters the process. Intake templates should use fixed units and fixed date formats. Each template should require:
A reporting period in MM/DD/YYYY format
A facility or entity ID
Quantities in the stated units
A required evidence attachment, such as a PDF invoice, meter photo, or HRIS export
This kind of standard intake cuts down on cleanup later and makes source validation much faster in the next step.
Collect Environmental, Social, and Governance Data by Topic
The key rule here is simple: collect raw activity data first, then calculate metrics later.
Don't ask teams to submit "Scope 1 emissions." Ask for the source data behind it: gallons of diesel used per vehicle, therms of natural gas per meter, and kWh of electricity per site. Then calculate emissions in a separate step using documented factors and methods.
In practice, the data usually falls into a few clear buckets:
Environmental data: meter-level electricity in kWh, fleet fuel in gallons, natural gas in therms, water in gallons, and waste volumes in tons by stream
Social data: headcount by site and employment type, turnover counts, EEOC-aligned demographics, training hours per employee, and OSHA-recordable incidents with total hours worked
Governance data: board composition, ethics training completion rates, code of conduct acknowledgments, and compliance incidents with investigation outcomes
That separation matters. Raw data tells you what happened. Calculated metrics tell you what it means. Mixing the two too early makes review harder and can create avoidable errors.
Keep the raw files unchanged so validation and aggregation stay separate.
Choose the Right Collection Method for Scale and Auditability
Use the simplest system that can handle role-based access, evidence capture, and audit trails at your current scale. In other words, don't build a giant machine if a controlled process will do the job.
Keep intake tight with named preparers, locked templates, validation checks, and attached source evidence. Once collection is standardized, the next move is validating source data before aggregation.
4. Validate Data, Prepare for Reporting, and Get Assurance-Ready
Once intake is done, validation turns raw source records into ESG data you can actually report.
Validate Source Data and Resolve Errors Before Aggregation
Validation starts at the record level, before anything gets rolled up. Reconcile electricity use against utility invoices and meter readings. Match headcount and turnover to payroll and HR systems. Check safety metrics against incident logs and case management records. Then look for missing values, duplicates, and unusual month-over-month swings.
When a variance shows up, start with the plainest explanation: did operations change? A plant shutdown, acquisition, weather event, or methodology update may explain the shift. If there’s no business reason, trace the metric back to the source records and compare the current period with prior periods for the same facility, business unit, or process. Document the variance, the evidence reviewed, the approver, and the correction decision.
After exceptions are cleared, those same source records can move into calculation. Don’t swap in rebuilt summaries if you can avoid it.
Use layered controls so one weak check doesn’t sink the whole process.
Control Type | Example | Reliability | Effort & Cost |
|---|---|---|---|
Preventive / Manual | Approvals and workflow sign-offs before submission | Useful for judgment-based checks | Can be slow and scales poorly |
Preventive / Automated | Required fields, format validation, unit checks in intake templates | Strong for rule-based errors | Fast and consistent once designed well |
Detective / Manual | Variance reviews and exception analysis by data owners | Flexible for business-context issues | Time-intensive at scale |
Detective / Automated | Outlier alerts, reconciliation scripts, duplicate detection | Consistent across large datasets | Depends on well-designed rules and system integration |
Transform Raw Data Into Reportable ESG Metrics
Use the same source files and calculation rules defined earlier. Don’t rebuild metrics from summaries. That shortcut usually comes back to bite you.
Standardize units before calculation. Convert fuels as needed, keep electricity in kWh, and use one workforce basis, such as headcount or FTE. Apply your documented emissions factors and stick with the same calculation rules each period.
Work from the original source files, not cleaned summaries, so every metric stays traceable from reported output back to the record that fed it.
If data is missing, use a documented estimation method. Common options include:
Extrapolating from prior periods
Applying an engineering estimate
Using a proxy value from a comparable facility
Be clear about where estimates were used, why they were needed, and what limits they place on comparability. Version-control each calculation file so the assumptions used in the reported period stay traceable later.
A disclosure matrix helps connect each source file to the metric and disclosure it supports. Energy consumption, emissions, and transition-risk data may feed ISSB and TCFD-related disclosures. This data is critical for organizations looking to build climate resilience and long-term economic success. Workforce health and safety, diversity, and turnover data may support SASB and GRI topics. Emissions, water, and governance metrics may also matter for CDP questionnaires. When the matrix is built well, it cuts duplicate work and shows where boundary or measurement-period differences need separate handling.
Prepare Evidence Files and Check Assurance Readiness
Assurance readiness means you can explain, reproduce, and support every material figure without scrambling at the last minute.
Before public reporting, confirm that:
Each metric has a named owner
Source documents are saved and linked to the reported number
Calculation workpapers show the formula and factor references
Management sign-off includes dates and approver names
The final dataset is locked so post-approval changes are tracked
Limited assurance involves lighter testing. Reasonable assurance goes deeper. Even if you only need limited assurance today, build controls and documentation that can scale to reasonable assurance in the next two to three years. It’s far easier to build the system now than patch it together later under deadline pressure.
With the package locked, the reporting review can begin.
Conclusion: Turn ESG Data Collection Into a Repeatable Process
Once validation and evidence are done, the job changes. It’s no longer about finishing one report. It’s about building a cycle you can run again each reporting period, with ESG data that stays consistent and easy to trace back to the source.
That kind of repeatability doesn’t happen by accident. ESG data has to be managed like a controlled business process, with the same discipline companies bring to financial reporting. Assurance demands are getting tighter, and the bar keeps moving up.
The upside goes well beyond compliance. When ESG metrics are timely and consistent, they lead to better capital allocation, sharper risk management, and stronger operating decisions. Why? Because the data is standardized, validated, and traceable to where it started.
For complex portfolios, Council Fire helps turn sustainability strategy into repeatable, data-backed action.
The aim is simple: build a process that gets better with each cycle.
FAQs
What counts as source evidence for ESG data?
Source evidence is the original record or system output behind each reported ESG number. It shows where the figure came from and creates a clear audit trail.
This evidence can include utility invoices, meter readings, building management reports, fleet telematics, ERP data, HRIS reports, board records, policy documents, procurement and logistics reports, and supplier questionnaires. When a figure is estimated, the source evidence should also include the documented method, assumptions, and emission factors used to calculate it.
How do we handle missing or estimated ESG data?
Handle missing ESG data with clear disclosure and a sound method. When primary data isn’t available, use reasonable estimates like sector averages, proxy calculations, or conservative assumptions.
Spell out the method, the reason behind it, and how sensitive the results are to those choices. Keep a clear audit trail, and be open about any gaps that remain and how you plan to fix them.
What should an ESG data dictionary include?
An ESG data dictionary is a core reference point for consistent, transparent reporting. It gives each metric a clear home and ties it back to the source system, whether that’s an ERP platform, a utility invoice, or an HRIS record.
Just as important, it spells out how the metric is calculated, who owns the data, and which reporting framework it supports. It should also record validation rules and explain how evidence will be retained for future assurance. Without that level of detail, reporting can turn into guesswork fast.
Related Blog Posts
Latest Articles
©2026

Narrative Change and Power Building: The Missing Half of Advocacy
Narrative change is the process of disrupting dominant narratives that normalize inequity and advancing new narratives from historically marginalized communities.

Funding Resilience Without Federal Grants
BRIC is unreliable and FEMA is shrinking. Here's how cities fund climate resilience with dedicated revenue, blended finance, and a coordinating authority.

The ESG Blind Spot: How AI Is Finding Risks in Companies Nobody Else Is Watching
Norway's sovereign wealth fund uses AI to screen 7,200 portfolio companies for forced labor and corruption within 24 hours. The real story is the emerging-market coverage gap that traditional ESG data vendors miss — and what it means for any company with a global supply chain.
Narrative Change and Power Building: The Missing Half of Advocacy
Narrative change is the process of disrupting dominant narratives that normalize inequity and advancing new narratives from historically marginalized communities.
Funding Resilience Without Federal Grants
BRIC is unreliable and FEMA is shrinking. Here's how cities fund climate resilience with dedicated revenue, blended finance, and a coordinating authority.
The ESG Blind Spot: How AI Is Finding Risks in Companies Nobody Else Is Watching
Norway's sovereign wealth fund uses AI to screen 7,200 portfolio companies for forced labor and corruption within 24 hours. The real story is the emerging-market coverage gap that traditional ESG data vendors miss — and what it means for any company with a global supply chain.
FAQ
01
What does it really mean to “redefine profit”?
02
What makes Council Fire different?
03
Who does Council Fire work with?
04
What does working with Council Fire actually look like?
05
How does Council Fire help organizations turn big goals into action?
06
How does Council Fire define and measure success?
07
How does technology fit into Council Fire’s work?
Jul 19, 2026
ESG Data Collection: Step-by-Step Guide
ESG Strategy
In This Article
Treat ESG reporting like a financial close: collect source records, assign owners, enforce controls, and validate every metric.
ESG Data Collection: Step-by-Step Guide
If your ESG data is not tied to source records, named owners, and review steps, it is not ready for reporting. I’d boil the process down to four moves: define what must be reported, assign ownership, collect raw data from source systems, and validate every figure before disclosure.
Here’s the short version:
Start with reporting needs. Map each disclosure requirement to a field, unit, source, and owner.
Pick the KPIs that matter most. Link each topic to a formula, unit, and reporting boundary.
Set control rules early. Separate who prepares, reviews, and approves the data.
Collect raw inputs, not final metrics. For example, gather kWh, therms, gallons, hours worked, and headcount first.
Check data before roll-up. Look for missing values, duplicates, and unusual swings.
Build an evidence file for each number. Save invoices, exports, logs, factor references, and sign-offs.
A few points stand out. The article frames ESG data like a financial close, which is the right model for teams facing SEC, California, ISSB, GRI, or CDP reporting pressure. It also stresses that Scope 1, Scope 2, workforce, safety, and governance figures need fixed units, clear boundaries, and a record of any changes in method. That matters because assurance work is getting tighter, and weak documentation can slow reporting fast.
I also like the article’s core message: do not start with calculations. Start with source data, standard intake, and review steps. From there, turn raw inputs into reportable metrics with the same rules each year.
If I had to sum it up in one line, it’s this: good ESG reporting depends less on collecting more data and more on controlling the data you already have.
ESG Data Collection Process: 4-Step Framework for Audit-Ready Reporting
Simplifying ESG Data Management: A Practical Approach
1. Define Reporting Requirements, Material Topics, and Metrics
Before your team pulls even one data point, get clear on what you need to report and why it matters. That sounds obvious, but this is where many reporting efforts go sideways. If a disclosure asks for one thing and your systems store another, you're stuck fixing gaps later. The better move is to translate each requirement into exact data fields, units, and named owners from the start.
Map Frameworks and Regulatory Expectations to Data Needs
Most companies face overlap across frameworks, so the goal is not to collect everything under the sun. It's to collect the disclosures that apply to your business.
The SEC's 2024 climate disclosure rule requires large accelerated filers to disclose material Scope 1 and/or Scope 2 GHG emissions in aggregate CO₂e, reported gross of offsets.[4] California's SB-253 requires Scope 1, 2, and 3 emissions for companies with more than $1 billion in annual revenue doing business in California.[7] ISSB's IFRS S1 and S2 set a global baseline for sustainability and climate disclosure, building on TCFD's four pillars and SASB's industry-specific metrics, with effective periods beginning January 1, 2024.[5][6] GRI focuses on impact-based disclosures, including community impacts, human rights, and detailed environmental data. CDP adds more detailed climate, water, and forests questionnaires for companies answering investor and customer requests.
A practical way to manage this is to build a requirements register. Think of it as the master sheet for your reporting program. For each disclosure item, log:
the required field
the unit of measure
the source system
the owner
That level of detail saves time later. For example, the SEC requirement to disclose Scope 2 emissions turns into two separate data fields: location-based CO₂e and market-based CO₂e. Those fields may pull from utility bills measured in kWh, renewable energy certificate (REC) records, and the EPA eGRID emissions factor database.[3]
Framework / Rule | Key Data Points |
|---|---|
SEC Climate Rule | Scope 1 & 2 emissions (CO₂e), climate-related capital expenditures, financial impacts |
Scope 1, 2, & 3 emissions (third-party verified) | |
ISSB S1 / S2 | Industry-specific KPIs (SASB), climate risk metrics, Scope 1, 2, and relevant Scope 3 emissions |
GRI Standards | Workforce diversity, water stress, waste, health & safety (TRIR) |
CDP | Water scarcity risk, carbon pricing, forest-related impacts |
Once those fields are locked in, assign owners and set the approval path. If nobody owns a metric, it usually doesn't get delivered on time.
Run a Materiality Assessment and Select Priority KPIs
A materiality assessment helps answer one plain question: which ESG topics matter enough to track and report? Not every topic deserves the same attention, and trying to track too much can bury your team in noise.
This usually means talking with investors, employees, customers, regulators, and suppliers, then scoring each topic based on business impact and stakeholder importance. Topics that score high on both land in the top-right quadrant of the materiality matrix. Those become your reporting priorities.
From there, build your KPI set and data dictionary around that short list. Each material topic should connect to a KPI that is specific, measurable, and tied to a clear formula and unit.
For climate, that often includes Scope 1 emissions, meaning direct emissions from owned or controlled sources, measured in metric tons CO₂e. It also includes Scope 2 emissions from purchased electricity, steam, heat, or cooling, measured in metric tons CO₂e using both location-based and market-based methods. Depending on the business, you may also need relevant Scope 3 categories such as business travel or purchased goods and services.
For workforce topics, companies often track demographics by gender, race/ethnicity, job level, and location. For safety, use OSHA definitions. Total Recordable Incident Rate (TRIR) should be calculated from OSHA-recordable incidents and total hours worked. Governance KPIs may include the percentage of independent directors and the percentage of employees trained on anti-bribery policies.
The point is simple: a topic is not report-ready until it has a KPI, a formula, a unit, and a clear owner.
Document Boundaries, Units, and Calculation Rules
Boundary decisions shape everything that follows. They determine which entities and operations count, and which do not. If those lines are fuzzy, your numbers will be too.
For GHG emissions, many organizations use an operational control approach under the GHG Protocol. That means covering all facilities where the company has authority to implement operating policies. Your boundary documentation should list every included legal entity, facility, and value-chain segment, including offices, plants, warehouses, and data centers. It should also explain any exclusions in plain language.
Units matter just as much. Before data intake starts, confirm that source systems use the same units. One team may report electricity in kWh, another in MWh. One site may log fuel in gallons, another in liters. If you don't standardize up front, your team ends up cleaning a mess later.
Document these rules in a data dictionary and methodology manual. That should cover factor sources, GWP version, estimation rules, and restatement policy.[2][6] Material changes to those rules should go through formal approval by governance bodies such as the audit committee or sustainability steering committee before each reporting cycle.
With scope, metrics, and calculation rules in place, the next step is to set owners and controls before data collection begins.
2. Build ESG Data Governance, Ownership, and Controls
Once metrics, boundaries, and calculation rules are set, governance is what turns ESG reporting into a controlled process. At that point, the issue is simple: who owns each number, who checks it, and what keeps mistakes from getting through? If ownership is fuzzy and controls are weak, ESG data tends to show up late, clash across teams, and fall apart under scrutiny.
Assign Data Owners and Approval Roles
A RACI matrix is a standard way to assign ESG responsibilities. For every ESG metric in your data register, define who is Responsible for collecting and entering the data, who is Accountable for data quality and sign-off, who is Consulted on methodology, and who is Informed when updates happen.
Ownership should sit with the function closest to the source data:
HR - workforce metrics such as headcount, turnover, training hours, and DEI demographics; accountable owner: CHRO
Operations - energy, fuel, water, waste, and safety incidents; accountable owner: COO or regional operations director
Finance - spend-based inputs for Scope 3 estimation, such as purchased goods and services
Legal and Compliance - board composition, policy metrics, and anti-corruption training completion; accountable owner: General Counsel or Chief Compliance Officer
Each metric should also be logged in an ESG data catalogue with its source, formula, owner, approval path, and reporting destination. That record becomes the working map for the whole process. After owners are in place, the next job is to spell out how data gets reviewed, approved, and stored.
Set Policies, Procedures, and Quality Controls
Written SOPs keep governance steady when deadlines get tight. Each SOP should spell out data collection frequency, approved source systems, aggregation rules, review steps, evidence retention rules, escalation paths for missing or unusual data, and how exceptions are logged, investigated, resolved, and approved before reporting.
Two controls matter more than the rest.
First, segregation of duties. The person entering data should not also approve it, and neither role should sit with the person who set the methodology. That separation cuts the chance of unchecked errors and makes review more than a rubber stamp.
Second, change logs. Any update to a metric definition, emissions factor, or boundary decision should be recorded with the date, reason, owner, and downstream effect on reported figures. During external assurance, those logs are not paperwork for paperwork’s sake. They are part of the evidence trail.
Use a Controls Framework for Sustainability Reporting
The COSO Internal Control–Integrated Framework is the most widely referenced structure for building internal controls over sustainability reporting (ICSR), and it maps cleanly onto ESG data.[8][1][11] Its five components fit the work in a direct, practical way:
COSO Component | What It Means for ESG Data |
|---|---|
Control Environment | Board oversight of ESG, ESG commitments in the Code of Conduct, executive accountability tied to sustainability performance |
Risk Assessment | Treat ESG misstatement and greenwashing as explicit risks; assess data-quality vulnerabilities by metric and source system |
Control Activities | Preventive controls such as standardized templates and unit validation, detective controls such as variance analysis and range checks, and multi-level approval workflows |
Information & Communication | Every reported figure should be traceable to its source, with clear guidance and deadlines communicated to all data owners |
Monitoring | Periodic internal audits of ESG data processes, with corrective actions tracked and closed before the next reporting cycle |
The Institute of Internal Auditors treats greenwashing as a fraud risk.[9][10] That’s the right lens. If a company applies strict controls to financial reporting but treats ESG data as informal, it leaves a gap that can turn into a reporting problem fast.
Once ownership and controls are in place, data collection can move into standardized source-system workflows.
3. Design Data Workflows and Collect ESG Information
Once governance is set, the next job is building the intake workflow: where the data lives, how people submit it, and where it sits before any calculations happen.
Inventory Source Systems and Standardize Data Intake
Begin with a plain, complete list of every system that holds ESG-related data. For many U.S.-based organizations, that means utility invoices and online utility portals, fleet management systems, travel and expense platforms, ERP and finance systems, HRIS, EHS or safety logs, waste hauler reports, supplier questionnaires, and building management systems. Put each source into a register that tracks the system name, the ESG topics it covers, the data owner, and the evidence type.
That step sounds basic, but it saves a lot of pain later. If you don't know where the data starts, you end up chasing numbers at the end of the reporting cycle.
After the sources are mapped, standardize how data enters the process. Intake templates should use fixed units and fixed date formats. Each template should require:
A reporting period in MM/DD/YYYY format
A facility or entity ID
Quantities in the stated units
A required evidence attachment, such as a PDF invoice, meter photo, or HRIS export
This kind of standard intake cuts down on cleanup later and makes source validation much faster in the next step.
Collect Environmental, Social, and Governance Data by Topic
The key rule here is simple: collect raw activity data first, then calculate metrics later.
Don't ask teams to submit "Scope 1 emissions." Ask for the source data behind it: gallons of diesel used per vehicle, therms of natural gas per meter, and kWh of electricity per site. Then calculate emissions in a separate step using documented factors and methods.
In practice, the data usually falls into a few clear buckets:
Environmental data: meter-level electricity in kWh, fleet fuel in gallons, natural gas in therms, water in gallons, and waste volumes in tons by stream
Social data: headcount by site and employment type, turnover counts, EEOC-aligned demographics, training hours per employee, and OSHA-recordable incidents with total hours worked
Governance data: board composition, ethics training completion rates, code of conduct acknowledgments, and compliance incidents with investigation outcomes
That separation matters. Raw data tells you what happened. Calculated metrics tell you what it means. Mixing the two too early makes review harder and can create avoidable errors.
Keep the raw files unchanged so validation and aggregation stay separate.
Choose the Right Collection Method for Scale and Auditability
Use the simplest system that can handle role-based access, evidence capture, and audit trails at your current scale. In other words, don't build a giant machine if a controlled process will do the job.
Keep intake tight with named preparers, locked templates, validation checks, and attached source evidence. Once collection is standardized, the next move is validating source data before aggregation.
4. Validate Data, Prepare for Reporting, and Get Assurance-Ready
Once intake is done, validation turns raw source records into ESG data you can actually report.
Validate Source Data and Resolve Errors Before Aggregation
Validation starts at the record level, before anything gets rolled up. Reconcile electricity use against utility invoices and meter readings. Match headcount and turnover to payroll and HR systems. Check safety metrics against incident logs and case management records. Then look for missing values, duplicates, and unusual month-over-month swings.
When a variance shows up, start with the plainest explanation: did operations change? A plant shutdown, acquisition, weather event, or methodology update may explain the shift. If there’s no business reason, trace the metric back to the source records and compare the current period with prior periods for the same facility, business unit, or process. Document the variance, the evidence reviewed, the approver, and the correction decision.
After exceptions are cleared, those same source records can move into calculation. Don’t swap in rebuilt summaries if you can avoid it.
Use layered controls so one weak check doesn’t sink the whole process.
Control Type | Example | Reliability | Effort & Cost |
|---|---|---|---|
Preventive / Manual | Approvals and workflow sign-offs before submission | Useful for judgment-based checks | Can be slow and scales poorly |
Preventive / Automated | Required fields, format validation, unit checks in intake templates | Strong for rule-based errors | Fast and consistent once designed well |
Detective / Manual | Variance reviews and exception analysis by data owners | Flexible for business-context issues | Time-intensive at scale |
Detective / Automated | Outlier alerts, reconciliation scripts, duplicate detection | Consistent across large datasets | Depends on well-designed rules and system integration |
Transform Raw Data Into Reportable ESG Metrics
Use the same source files and calculation rules defined earlier. Don’t rebuild metrics from summaries. That shortcut usually comes back to bite you.
Standardize units before calculation. Convert fuels as needed, keep electricity in kWh, and use one workforce basis, such as headcount or FTE. Apply your documented emissions factors and stick with the same calculation rules each period.
Work from the original source files, not cleaned summaries, so every metric stays traceable from reported output back to the record that fed it.
If data is missing, use a documented estimation method. Common options include:
Extrapolating from prior periods
Applying an engineering estimate
Using a proxy value from a comparable facility
Be clear about where estimates were used, why they were needed, and what limits they place on comparability. Version-control each calculation file so the assumptions used in the reported period stay traceable later.
A disclosure matrix helps connect each source file to the metric and disclosure it supports. Energy consumption, emissions, and transition-risk data may feed ISSB and TCFD-related disclosures. This data is critical for organizations looking to build climate resilience and long-term economic success. Workforce health and safety, diversity, and turnover data may support SASB and GRI topics. Emissions, water, and governance metrics may also matter for CDP questionnaires. When the matrix is built well, it cuts duplicate work and shows where boundary or measurement-period differences need separate handling.
Prepare Evidence Files and Check Assurance Readiness
Assurance readiness means you can explain, reproduce, and support every material figure without scrambling at the last minute.
Before public reporting, confirm that:
Each metric has a named owner
Source documents are saved and linked to the reported number
Calculation workpapers show the formula and factor references
Management sign-off includes dates and approver names
The final dataset is locked so post-approval changes are tracked
Limited assurance involves lighter testing. Reasonable assurance goes deeper. Even if you only need limited assurance today, build controls and documentation that can scale to reasonable assurance in the next two to three years. It’s far easier to build the system now than patch it together later under deadline pressure.
With the package locked, the reporting review can begin.
Conclusion: Turn ESG Data Collection Into a Repeatable Process
Once validation and evidence are done, the job changes. It’s no longer about finishing one report. It’s about building a cycle you can run again each reporting period, with ESG data that stays consistent and easy to trace back to the source.
That kind of repeatability doesn’t happen by accident. ESG data has to be managed like a controlled business process, with the same discipline companies bring to financial reporting. Assurance demands are getting tighter, and the bar keeps moving up.
The upside goes well beyond compliance. When ESG metrics are timely and consistent, they lead to better capital allocation, sharper risk management, and stronger operating decisions. Why? Because the data is standardized, validated, and traceable to where it started.
For complex portfolios, Council Fire helps turn sustainability strategy into repeatable, data-backed action.
The aim is simple: build a process that gets better with each cycle.
FAQs
What counts as source evidence for ESG data?
Source evidence is the original record or system output behind each reported ESG number. It shows where the figure came from and creates a clear audit trail.
This evidence can include utility invoices, meter readings, building management reports, fleet telematics, ERP data, HRIS reports, board records, policy documents, procurement and logistics reports, and supplier questionnaires. When a figure is estimated, the source evidence should also include the documented method, assumptions, and emission factors used to calculate it.
How do we handle missing or estimated ESG data?
Handle missing ESG data with clear disclosure and a sound method. When primary data isn’t available, use reasonable estimates like sector averages, proxy calculations, or conservative assumptions.
Spell out the method, the reason behind it, and how sensitive the results are to those choices. Keep a clear audit trail, and be open about any gaps that remain and how you plan to fix them.
What should an ESG data dictionary include?
An ESG data dictionary is a core reference point for consistent, transparent reporting. It gives each metric a clear home and ties it back to the source system, whether that’s an ERP platform, a utility invoice, or an HRIS record.
Just as important, it spells out how the metric is calculated, who owns the data, and which reporting framework it supports. It should also record validation rules and explain how evidence will be retained for future assurance. Without that level of detail, reporting can turn into guesswork fast.
Related Blog Posts
Latest Articles
©2026
Narrative Change and Power Building: The Missing Half of Advocacy
Narrative change is the process of disrupting dominant narratives that normalize inequity and advancing new narratives from historically marginalized communities.
Funding Resilience Without Federal Grants
BRIC is unreliable and FEMA is shrinking. Here's how cities fund climate resilience with dedicated revenue, blended finance, and a coordinating authority.
The ESG Blind Spot: How AI Is Finding Risks in Companies Nobody Else Is Watching
Norway's sovereign wealth fund uses AI to screen 7,200 portfolio companies for forced labor and corruption within 24 hours. The real story is the emerging-market coverage gap that traditional ESG data vendors miss — and what it means for any company with a global supply chain.
FAQ
01
What does it really mean to “redefine profit”?
02
What makes Council Fire different?
03
Who does Council Fire work with?
04
What does working with Council Fire actually look like?
05
How does Council Fire help organizations turn big goals into action?
06
How does Council Fire define and measure success?
07
How does technology fit into Council Fire’s work?
Jul 19, 2026
ESG Data Collection: Step-by-Step Guide
ESG Strategy
In This Article
Treat ESG reporting like a financial close: collect source records, assign owners, enforce controls, and validate every metric.
ESG Data Collection: Step-by-Step Guide
If your ESG data is not tied to source records, named owners, and review steps, it is not ready for reporting. I’d boil the process down to four moves: define what must be reported, assign ownership, collect raw data from source systems, and validate every figure before disclosure.
Here’s the short version:
Start with reporting needs. Map each disclosure requirement to a field, unit, source, and owner.
Pick the KPIs that matter most. Link each topic to a formula, unit, and reporting boundary.
Set control rules early. Separate who prepares, reviews, and approves the data.
Collect raw inputs, not final metrics. For example, gather kWh, therms, gallons, hours worked, and headcount first.
Check data before roll-up. Look for missing values, duplicates, and unusual swings.
Build an evidence file for each number. Save invoices, exports, logs, factor references, and sign-offs.
A few points stand out. The article frames ESG data like a financial close, which is the right model for teams facing SEC, California, ISSB, GRI, or CDP reporting pressure. It also stresses that Scope 1, Scope 2, workforce, safety, and governance figures need fixed units, clear boundaries, and a record of any changes in method. That matters because assurance work is getting tighter, and weak documentation can slow reporting fast.
I also like the article’s core message: do not start with calculations. Start with source data, standard intake, and review steps. From there, turn raw inputs into reportable metrics with the same rules each year.
If I had to sum it up in one line, it’s this: good ESG reporting depends less on collecting more data and more on controlling the data you already have.
ESG Data Collection Process: 4-Step Framework for Audit-Ready Reporting
Simplifying ESG Data Management: A Practical Approach
1. Define Reporting Requirements, Material Topics, and Metrics
Before your team pulls even one data point, get clear on what you need to report and why it matters. That sounds obvious, but this is where many reporting efforts go sideways. If a disclosure asks for one thing and your systems store another, you're stuck fixing gaps later. The better move is to translate each requirement into exact data fields, units, and named owners from the start.
Map Frameworks and Regulatory Expectations to Data Needs
Most companies face overlap across frameworks, so the goal is not to collect everything under the sun. It's to collect the disclosures that apply to your business.
The SEC's 2024 climate disclosure rule requires large accelerated filers to disclose material Scope 1 and/or Scope 2 GHG emissions in aggregate CO₂e, reported gross of offsets.[4] California's SB-253 requires Scope 1, 2, and 3 emissions for companies with more than $1 billion in annual revenue doing business in California.[7] ISSB's IFRS S1 and S2 set a global baseline for sustainability and climate disclosure, building on TCFD's four pillars and SASB's industry-specific metrics, with effective periods beginning January 1, 2024.[5][6] GRI focuses on impact-based disclosures, including community impacts, human rights, and detailed environmental data. CDP adds more detailed climate, water, and forests questionnaires for companies answering investor and customer requests.
A practical way to manage this is to build a requirements register. Think of it as the master sheet for your reporting program. For each disclosure item, log:
the required field
the unit of measure
the source system
the owner
That level of detail saves time later. For example, the SEC requirement to disclose Scope 2 emissions turns into two separate data fields: location-based CO₂e and market-based CO₂e. Those fields may pull from utility bills measured in kWh, renewable energy certificate (REC) records, and the EPA eGRID emissions factor database.[3]
Framework / Rule | Key Data Points |
|---|---|
SEC Climate Rule | Scope 1 & 2 emissions (CO₂e), climate-related capital expenditures, financial impacts |
Scope 1, 2, & 3 emissions (third-party verified) | |
ISSB S1 / S2 | Industry-specific KPIs (SASB), climate risk metrics, Scope 1, 2, and relevant Scope 3 emissions |
GRI Standards | Workforce diversity, water stress, waste, health & safety (TRIR) |
CDP | Water scarcity risk, carbon pricing, forest-related impacts |
Once those fields are locked in, assign owners and set the approval path. If nobody owns a metric, it usually doesn't get delivered on time.
Run a Materiality Assessment and Select Priority KPIs
A materiality assessment helps answer one plain question: which ESG topics matter enough to track and report? Not every topic deserves the same attention, and trying to track too much can bury your team in noise.
This usually means talking with investors, employees, customers, regulators, and suppliers, then scoring each topic based on business impact and stakeholder importance. Topics that score high on both land in the top-right quadrant of the materiality matrix. Those become your reporting priorities.
From there, build your KPI set and data dictionary around that short list. Each material topic should connect to a KPI that is specific, measurable, and tied to a clear formula and unit.
For climate, that often includes Scope 1 emissions, meaning direct emissions from owned or controlled sources, measured in metric tons CO₂e. It also includes Scope 2 emissions from purchased electricity, steam, heat, or cooling, measured in metric tons CO₂e using both location-based and market-based methods. Depending on the business, you may also need relevant Scope 3 categories such as business travel or purchased goods and services.
For workforce topics, companies often track demographics by gender, race/ethnicity, job level, and location. For safety, use OSHA definitions. Total Recordable Incident Rate (TRIR) should be calculated from OSHA-recordable incidents and total hours worked. Governance KPIs may include the percentage of independent directors and the percentage of employees trained on anti-bribery policies.
The point is simple: a topic is not report-ready until it has a KPI, a formula, a unit, and a clear owner.
Document Boundaries, Units, and Calculation Rules
Boundary decisions shape everything that follows. They determine which entities and operations count, and which do not. If those lines are fuzzy, your numbers will be too.
For GHG emissions, many organizations use an operational control approach under the GHG Protocol. That means covering all facilities where the company has authority to implement operating policies. Your boundary documentation should list every included legal entity, facility, and value-chain segment, including offices, plants, warehouses, and data centers. It should also explain any exclusions in plain language.
Units matter just as much. Before data intake starts, confirm that source systems use the same units. One team may report electricity in kWh, another in MWh. One site may log fuel in gallons, another in liters. If you don't standardize up front, your team ends up cleaning a mess later.
Document these rules in a data dictionary and methodology manual. That should cover factor sources, GWP version, estimation rules, and restatement policy.[2][6] Material changes to those rules should go through formal approval by governance bodies such as the audit committee or sustainability steering committee before each reporting cycle.
With scope, metrics, and calculation rules in place, the next step is to set owners and controls before data collection begins.
2. Build ESG Data Governance, Ownership, and Controls
Once metrics, boundaries, and calculation rules are set, governance is what turns ESG reporting into a controlled process. At that point, the issue is simple: who owns each number, who checks it, and what keeps mistakes from getting through? If ownership is fuzzy and controls are weak, ESG data tends to show up late, clash across teams, and fall apart under scrutiny.
Assign Data Owners and Approval Roles
A RACI matrix is a standard way to assign ESG responsibilities. For every ESG metric in your data register, define who is Responsible for collecting and entering the data, who is Accountable for data quality and sign-off, who is Consulted on methodology, and who is Informed when updates happen.
Ownership should sit with the function closest to the source data:
HR - workforce metrics such as headcount, turnover, training hours, and DEI demographics; accountable owner: CHRO
Operations - energy, fuel, water, waste, and safety incidents; accountable owner: COO or regional operations director
Finance - spend-based inputs for Scope 3 estimation, such as purchased goods and services
Legal and Compliance - board composition, policy metrics, and anti-corruption training completion; accountable owner: General Counsel or Chief Compliance Officer
Each metric should also be logged in an ESG data catalogue with its source, formula, owner, approval path, and reporting destination. That record becomes the working map for the whole process. After owners are in place, the next job is to spell out how data gets reviewed, approved, and stored.
Set Policies, Procedures, and Quality Controls
Written SOPs keep governance steady when deadlines get tight. Each SOP should spell out data collection frequency, approved source systems, aggregation rules, review steps, evidence retention rules, escalation paths for missing or unusual data, and how exceptions are logged, investigated, resolved, and approved before reporting.
Two controls matter more than the rest.
First, segregation of duties. The person entering data should not also approve it, and neither role should sit with the person who set the methodology. That separation cuts the chance of unchecked errors and makes review more than a rubber stamp.
Second, change logs. Any update to a metric definition, emissions factor, or boundary decision should be recorded with the date, reason, owner, and downstream effect on reported figures. During external assurance, those logs are not paperwork for paperwork’s sake. They are part of the evidence trail.
Use a Controls Framework for Sustainability Reporting
The COSO Internal Control–Integrated Framework is the most widely referenced structure for building internal controls over sustainability reporting (ICSR), and it maps cleanly onto ESG data.[8][1][11] Its five components fit the work in a direct, practical way:
COSO Component | What It Means for ESG Data |
|---|---|
Control Environment | Board oversight of ESG, ESG commitments in the Code of Conduct, executive accountability tied to sustainability performance |
Risk Assessment | Treat ESG misstatement and greenwashing as explicit risks; assess data-quality vulnerabilities by metric and source system |
Control Activities | Preventive controls such as standardized templates and unit validation, detective controls such as variance analysis and range checks, and multi-level approval workflows |
Information & Communication | Every reported figure should be traceable to its source, with clear guidance and deadlines communicated to all data owners |
Monitoring | Periodic internal audits of ESG data processes, with corrective actions tracked and closed before the next reporting cycle |
The Institute of Internal Auditors treats greenwashing as a fraud risk.[9][10] That’s the right lens. If a company applies strict controls to financial reporting but treats ESG data as informal, it leaves a gap that can turn into a reporting problem fast.
Once ownership and controls are in place, data collection can move into standardized source-system workflows.
3. Design Data Workflows and Collect ESG Information
Once governance is set, the next job is building the intake workflow: where the data lives, how people submit it, and where it sits before any calculations happen.
Inventory Source Systems and Standardize Data Intake
Begin with a plain, complete list of every system that holds ESG-related data. For many U.S.-based organizations, that means utility invoices and online utility portals, fleet management systems, travel and expense platforms, ERP and finance systems, HRIS, EHS or safety logs, waste hauler reports, supplier questionnaires, and building management systems. Put each source into a register that tracks the system name, the ESG topics it covers, the data owner, and the evidence type.
That step sounds basic, but it saves a lot of pain later. If you don't know where the data starts, you end up chasing numbers at the end of the reporting cycle.
After the sources are mapped, standardize how data enters the process. Intake templates should use fixed units and fixed date formats. Each template should require:
A reporting period in MM/DD/YYYY format
A facility or entity ID
Quantities in the stated units
A required evidence attachment, such as a PDF invoice, meter photo, or HRIS export
This kind of standard intake cuts down on cleanup later and makes source validation much faster in the next step.
Collect Environmental, Social, and Governance Data by Topic
The key rule here is simple: collect raw activity data first, then calculate metrics later.
Don't ask teams to submit "Scope 1 emissions." Ask for the source data behind it: gallons of diesel used per vehicle, therms of natural gas per meter, and kWh of electricity per site. Then calculate emissions in a separate step using documented factors and methods.
In practice, the data usually falls into a few clear buckets:
Environmental data: meter-level electricity in kWh, fleet fuel in gallons, natural gas in therms, water in gallons, and waste volumes in tons by stream
Social data: headcount by site and employment type, turnover counts, EEOC-aligned demographics, training hours per employee, and OSHA-recordable incidents with total hours worked
Governance data: board composition, ethics training completion rates, code of conduct acknowledgments, and compliance incidents with investigation outcomes
That separation matters. Raw data tells you what happened. Calculated metrics tell you what it means. Mixing the two too early makes review harder and can create avoidable errors.
Keep the raw files unchanged so validation and aggregation stay separate.
Choose the Right Collection Method for Scale and Auditability
Use the simplest system that can handle role-based access, evidence capture, and audit trails at your current scale. In other words, don't build a giant machine if a controlled process will do the job.
Keep intake tight with named preparers, locked templates, validation checks, and attached source evidence. Once collection is standardized, the next move is validating source data before aggregation.
4. Validate Data, Prepare for Reporting, and Get Assurance-Ready
Once intake is done, validation turns raw source records into ESG data you can actually report.
Validate Source Data and Resolve Errors Before Aggregation
Validation starts at the record level, before anything gets rolled up. Reconcile electricity use against utility invoices and meter readings. Match headcount and turnover to payroll and HR systems. Check safety metrics against incident logs and case management records. Then look for missing values, duplicates, and unusual month-over-month swings.
When a variance shows up, start with the plainest explanation: did operations change? A plant shutdown, acquisition, weather event, or methodology update may explain the shift. If there’s no business reason, trace the metric back to the source records and compare the current period with prior periods for the same facility, business unit, or process. Document the variance, the evidence reviewed, the approver, and the correction decision.
After exceptions are cleared, those same source records can move into calculation. Don’t swap in rebuilt summaries if you can avoid it.
Use layered controls so one weak check doesn’t sink the whole process.
Control Type | Example | Reliability | Effort & Cost |
|---|---|---|---|
Preventive / Manual | Approvals and workflow sign-offs before submission | Useful for judgment-based checks | Can be slow and scales poorly |
Preventive / Automated | Required fields, format validation, unit checks in intake templates | Strong for rule-based errors | Fast and consistent once designed well |
Detective / Manual | Variance reviews and exception analysis by data owners | Flexible for business-context issues | Time-intensive at scale |
Detective / Automated | Outlier alerts, reconciliation scripts, duplicate detection | Consistent across large datasets | Depends on well-designed rules and system integration |
Transform Raw Data Into Reportable ESG Metrics
Use the same source files and calculation rules defined earlier. Don’t rebuild metrics from summaries. That shortcut usually comes back to bite you.
Standardize units before calculation. Convert fuels as needed, keep electricity in kWh, and use one workforce basis, such as headcount or FTE. Apply your documented emissions factors and stick with the same calculation rules each period.
Work from the original source files, not cleaned summaries, so every metric stays traceable from reported output back to the record that fed it.
If data is missing, use a documented estimation method. Common options include:
Extrapolating from prior periods
Applying an engineering estimate
Using a proxy value from a comparable facility
Be clear about where estimates were used, why they were needed, and what limits they place on comparability. Version-control each calculation file so the assumptions used in the reported period stay traceable later.
A disclosure matrix helps connect each source file to the metric and disclosure it supports. Energy consumption, emissions, and transition-risk data may feed ISSB and TCFD-related disclosures. This data is critical for organizations looking to build climate resilience and long-term economic success. Workforce health and safety, diversity, and turnover data may support SASB and GRI topics. Emissions, water, and governance metrics may also matter for CDP questionnaires. When the matrix is built well, it cuts duplicate work and shows where boundary or measurement-period differences need separate handling.
Prepare Evidence Files and Check Assurance Readiness
Assurance readiness means you can explain, reproduce, and support every material figure without scrambling at the last minute.
Before public reporting, confirm that:
Each metric has a named owner
Source documents are saved and linked to the reported number
Calculation workpapers show the formula and factor references
Management sign-off includes dates and approver names
The final dataset is locked so post-approval changes are tracked
Limited assurance involves lighter testing. Reasonable assurance goes deeper. Even if you only need limited assurance today, build controls and documentation that can scale to reasonable assurance in the next two to three years. It’s far easier to build the system now than patch it together later under deadline pressure.
With the package locked, the reporting review can begin.
Conclusion: Turn ESG Data Collection Into a Repeatable Process
Once validation and evidence are done, the job changes. It’s no longer about finishing one report. It’s about building a cycle you can run again each reporting period, with ESG data that stays consistent and easy to trace back to the source.
That kind of repeatability doesn’t happen by accident. ESG data has to be managed like a controlled business process, with the same discipline companies bring to financial reporting. Assurance demands are getting tighter, and the bar keeps moving up.
The upside goes well beyond compliance. When ESG metrics are timely and consistent, they lead to better capital allocation, sharper risk management, and stronger operating decisions. Why? Because the data is standardized, validated, and traceable to where it started.
For complex portfolios, Council Fire helps turn sustainability strategy into repeatable, data-backed action.
The aim is simple: build a process that gets better with each cycle.
FAQs
What counts as source evidence for ESG data?
Source evidence is the original record or system output behind each reported ESG number. It shows where the figure came from and creates a clear audit trail.
This evidence can include utility invoices, meter readings, building management reports, fleet telematics, ERP data, HRIS reports, board records, policy documents, procurement and logistics reports, and supplier questionnaires. When a figure is estimated, the source evidence should also include the documented method, assumptions, and emission factors used to calculate it.
How do we handle missing or estimated ESG data?
Handle missing ESG data with clear disclosure and a sound method. When primary data isn’t available, use reasonable estimates like sector averages, proxy calculations, or conservative assumptions.
Spell out the method, the reason behind it, and how sensitive the results are to those choices. Keep a clear audit trail, and be open about any gaps that remain and how you plan to fix them.
What should an ESG data dictionary include?
An ESG data dictionary is a core reference point for consistent, transparent reporting. It gives each metric a clear home and ties it back to the source system, whether that’s an ERP platform, a utility invoice, or an HRIS record.
Just as important, it spells out how the metric is calculated, who owns the data, and which reporting framework it supports. It should also record validation rules and explain how evidence will be retained for future assurance. Without that level of detail, reporting can turn into guesswork fast.
Related Blog Posts
Latest Articles
©2026
Narrative Change and Power Building: The Missing Half of Advocacy
Narrative change is the process of disrupting dominant narratives that normalize inequity and advancing new narratives from historically marginalized communities.
Funding Resilience Without Federal Grants
BRIC is unreliable and FEMA is shrinking. Here's how cities fund climate resilience with dedicated revenue, blended finance, and a coordinating authority.
The ESG Blind Spot: How AI Is Finding Risks in Companies Nobody Else Is Watching
Norway's sovereign wealth fund uses AI to screen 7,200 portfolio companies for forced labor and corruption within 24 hours. The real story is the emerging-market coverage gap that traditional ESG data vendors miss — and what it means for any company with a global supply chain.
FAQ
What does it really mean to “redefine profit”?
What makes Council Fire different?
Who does Council Fire work with?
What does working with Council Fire actually look like?
How does Council Fire help organizations turn big goals into action?
How does Council Fire define and measure success?
How does technology fit into Council Fire’s work?