
Oct 2, 2026 · 9 min read
Sustainability Strategy
In This Article
Use spend-based data for broad retail Scope 3 coverage and activity-based data for product-level accuracy; keep price effects separate.
Retail Data Models: Spend-Based vs Activity-Based
I use spend-based data for broad retail emissions coverage and activity-based data for detailed purchasing decisions. Start with purchase records, then add physical quantities and supplier data where emissions are highest. A 10% price increase can produce a 10% increase in a spend-based estimate - even when purchase volumes and emissions stay unchanged.
I compare the methods across cost, accuracy, supplier access, detail, and scale:
Quick Comparison
| Criteria | Spend-based | Activity-based |
|---|---|---|
| Calculation | Dollars spent × emissions per dollar | Physical quantity × emissions per unit |
| Cost and setup | Lower cost; uses finance records | More collection and review work |
| Accuracy | Sensitive to prices and category mapping | Depends on matched quantities, factors, and boundaries |
| Supplier access | Does not require direct supplier data | Needs physical records; supplier-specific data is optional |
| Detail | Category-level screening | Product and supplier detail when inputs are comparable |
| Scale | Broad coverage across stores and suppliers | Phased rollout with standard records |
| Best use | Baselines, gap filling, and prioritization | Procurement decisions and tracking physical changes |
My rule: <u>give each emissions source one calculation path</u>, document boundaries and method changes, and keep price effects separate from emissions changes. Track total emissions, emissions per unit, and coverage by procurement spend or supplier-linked emissions - not supplier count. Better data alone is not an emissions reduction.
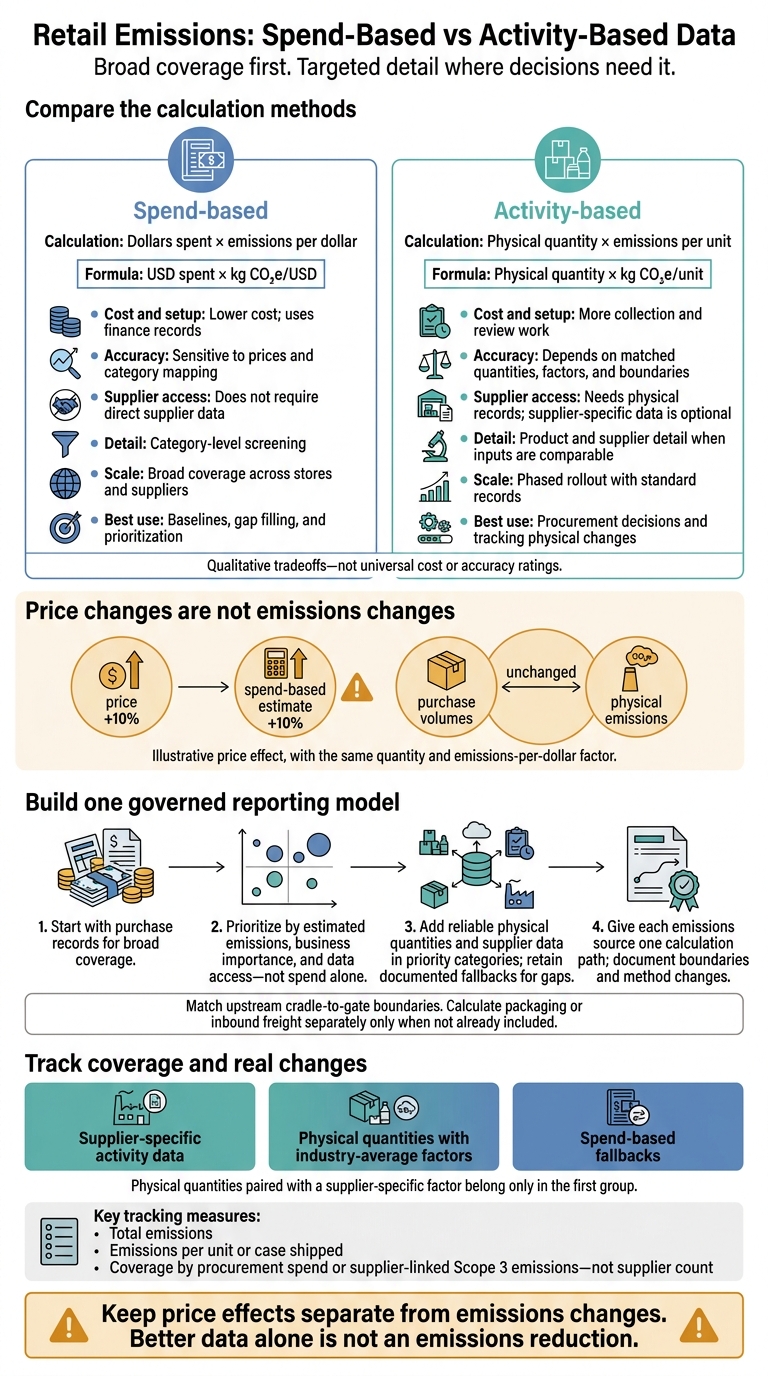
Retail Emissions: Spend-Based vs Activity-Based Data
The Truth in the Numbers: Why Activity Data Beats Spend-Based Carbon Accounting
sbb-itb-8baf5f1
How Spend-Based and Activity-Based Methods Work
Choose factors that match the upstream cradle-to-gate boundary. Calculate packaging or inbound freight separately only if those emissions are not already included.[8][15][16] Then match the method to the quality of data available across the retail network.
| Calculation element | Spend-based | Activity-based |
|---|---|---|
| Input | Purchase value in U.S. dollars | Product mass, units, energy, fuel, freight activity, or waste weight |
| Formula | USD spent × kg CO₂e/USD | Physical quantity × kg CO₂e/unit |
| Factor type | Industry-average factor per dollar | Supplier-, product-, or industry-average physical factor |
| Typical use | Broad screening where detailed data are unavailable | Product estimates, supplier engagement, and procurement decisions |
Spend-Based Method: Spending × Sector Factors
Start with purchasing or accounts-payable (AP) records, grouped by supplier and procurement category. Match each category to a suitable factor rather than applying one factor to all merchandise. EPA’s U.S. Supply Chain Greenhouse Gas Emission Factors provide per-dollar factors for relevant commodity or industry categories.[13][14]
Use a consistent dollar basis: convert spending to the factor year or restate the factor to 2026 dollars. Document currency conversions and how you handle taxes, rebates, returns, discounts, intercompany transactions, and pass-through costs.[9][10][14]
Sector factors reflect an average purchase mix and supply chain - not the actual production processes behind each invoice.[14] Spend-based calculations therefore help cover purchases when detailed data are missing, but offer less guidance for product-level decisions.
Activity-Based Method: Physical Quantities × Matched Factors
Use product specifications, freight records, and waste-stream data to establish physical quantities. Pair each quantity with a factor that uses the same unit and boundary.
Match electricity in kWh to kg CO₂e/kWh, fuel in U.S. gallons to kg CO₂e/gallon, and freight in ton-miles to kg CO₂e/ton-mile. For U.S. short-ton freight data, one ton equals 2,000 pounds.[11][12]
For waste weight, match the factor to both the material and its treatment route. For product counts, use a per-unit factor or document the conversion from units to mass.[11][12]
Attach geography, reporting year, and boundary ownership to each activity record. This keeps retail, supplier, freight, and waste data in the correct scope or category.[12] Activity records provide a stronger basis for product and supplier decisions, but their usefulness depends on reliable quantities.
Compare Cost, Accuracy, Supplier Access, Detail, and Scale
Each model serves a different role in retail disclosure. The comparison below shows where each fits best.
Qualitative tradeoffs - not universal cost or accuracy ratings.
| Dimension | Spend-based | Activity-based |
|---|---|---|
| Rollout cost and speed | Lower cost and faster screening using existing purchasing records | Higher cost and slower rollout when physical records, supplier data, and verification are needed |
| Supplier data coverage | Broad coverage across supplier tiers without direct supplier data | Depends on physical records; smaller suppliers may lack measurement capacity |
| Measurement stability | Sensitive to prices, discounts, and category mapping | More representative when quantities, boundaries, locations, periods, and factors match |
| Product and supplier granularity | Category-level screening with limited supplier differentiation | Supports SKU-level procurement decisions and supplier comparisons when data are comparable and verified |
| Retail network coverage | Scales quickly across stores, distribution centers, and banners | Requires standardized records and phased supplier onboarding |
| Best use | Disclosure baseline, gap filling, and prioritization | Priority-category disclosure and tracking changes in materials, packaging, energy, and freight |
| Auditability | Traceable spending, category mapping, and factors | Traceable quantities, allocations, factors, and supporting evidence |
Usefulness depends on data quality and the decision, not the method name.[6]
Setup Costs and Supplier Data Access
Existing finance and procurement records reduce the work needed for spend-based screening.[5] Activity data takes longer to roll out because it relies on physical records and adds supplier outreach, data matching, and review.
Use spend-based data to fill low-priority gaps and activity data for priority categories. Consistent collection templates help keep results comparable across years and suppliers.[17]
Accuracy, Product Detail, and Emissions Tracking
Lower spend can reflect discounts, not lower emissions.[19][21] Activity data is more useful for decisions about materials, packaging, energy, and freight. Check completeness, boundary consistency, factor specificity, location, time period, allocation, and verification.
Track activity volumes and factor versions separately. Before ranking suppliers, require comparable product specifications and boundaries. Spend-based estimates alone cannot support product-level impact claims.
Coverage Across Retail Networks
Spend records can extend coverage across stores, distribution centers, banners, and smaller suppliers. But missing purchases remain missing emissions. Check smaller-supplier records, store-level purchases, and banner-level reporting for gaps.
Start the activity-data rollout with the highest-emission categories and priority suppliers. Use consistent supplier identifiers, SKU records, units, and reporting periods. Keep source records and final outputs so results remain reproducible as coverage grows.
Match methods to what retailers need to disclose - not just what they can calculate.
| Use case | Starting method | Key condition |
|---|---|---|
| Enterprise baseline | Spend-based, supplemented by available activity data | Check purchase coverage and category mapping |
| New purchasing category | Spend-based or average-data estimate | Mark estimates as provisional |
| Supplier comparisons | Comparable supplier-specific or activity data | Align specifications, boundaries, periods, and evidence |
| Freight improvements | Activity-based logistics data | Record weight, distance, mode, and allocation consistently |
| Product claims | Product-specific lifecycle or supplier data | Match boundaries and provide supporting evidence |
Use the coverage gaps identified in these checks to set the next activity-data rollout priorities.
Build and Govern a Combined Reporting Model
After comparing coverage and accuracy, bring the two methods together in one governed reporting system.
Choose Methods by Data Access and Emissions
Start with the purchasing ledger, then add activity data to the highest-priority records. Rank suppliers by their importance to the business, estimated emissions, and data access - not spend alone. Focus on private-label products, packaging, and logistics. Include smaller suppliers when their emissions justify the cost of collecting data. Review priorities each year and keep documented fallback methods.[7][18][22]
Use this hierarchy to decide where spend-based coverage ends and activity-based detail begins.
| Priority | Estimated emissions | Data availability | Method |
|---|---|---|---|
| Low | Low | Limited or none | Spend-based fallback |
| High | Low or uncertain | Limited | Spend-based, with a supplier-engagement plan |
| Low or medium | High | Reliable physical records | Activity-based |
| High | High | Reliable physical or supplier-specific data | Activity-based or supplier-specific |
| High | High | Partial | Combined treatment, with defined gaps covered by industry-average factors |
A mixed-method portfolio is not automatically a hybrid method. For purchased goods and services, that formal term has a narrower meaning: it combines supplier-specific activity data or supplier emissions data with industry-average factors for upstream activities not covered by those data.[4][6]
Document Boundaries, Fallbacks, and Method Changes
Maintain a calculation register that records source files, periods, boundaries, units, factors, allocation rules, assumptions, data-quality ratings, and approvals. Set fallback rules before collecting data. Give each emissions source one calculation path to avoid counting the same cradle-to-gate footprint twice.[11][12]
Report coverage in three nonoverlapping groups: supplier-specific activity data, physical quantities with industry-average factors, and spend-based fallbacks. Physical quantities paired with a supplier-specific factor belong only in the first group.[11][20]
Apply a consistent base-year recalculation policy for significant changes. Distinguish changes in physical activity and efficiency from price effects, factor updates, boundary changes, and calculation-method improvements. A change in inputs should not count as an emissions cut unless the underlying activity changed.[11][20]
Use Reporting Data to Guide Procurement and Decarbonization
Once the model is in place, use it to guide purchasing decisions. Link each data request to a specific decision about material specifications, packaging weight, supplier energy use, or freight mode.
Track emissions per unit or case shipped alongside total emissions. Connect those results to supplier scorecards, product specifications, packaging redesign, and logistics decisions.
Conclusion: Balance Broad Coverage With Targeted Detail
Use spend-based data for broad coverage and activity-based data when decisions require product, supplier, or freight detail. Keep spend-based estimates as a starting point that can scale and serve as a fallback. Add physical-quantity calculations when reliable inputs and suitable factors can guide priority purchasing decisions.[4][6]
Apply the model to the largest gaps first. Give suppliers standard templates, fixed reporting periods, and training, then use those tools to extend the combined reporting model across stores, banners, and suppliers. Measure coverage by procurement spend or supplier-linked Scope 3 emissions - not supplier count.[25][26]
For clear year-to-year comparisons, separate price and method effects from changes in physical emissions. This helps distinguish actual emissions changes from shifts in pricing or calculations.[23][24]
FAQs
When should I switch from spend-based to activity-based data?
As your sustainability program matures, use spend-based estimates for initial screening to identify categories with high emissions or major risk.
Then prioritize activity-based or supplier-specific data for those categories. This improves accuracy and helps track actual decarbonization efforts. The phased approach directs resources toward the suppliers and categories that matter most, while retaining spend-based estimates as a fallback for lower-priority areas.
How can I validate supplier emissions data?
Follow a data-quality hierarchy. Start with standardized collection templates and unit validation. Then flag anomalies using automated range checks, year-over-year variance analysis, and cross-metric consistency checks.
Maintain a traceable audit trail for every data point, documenting methodologies, emission factors, and assumptions. Check completeness against initial spend-based screenings, and work with external assurance providers to verify disclosures as regulatory requirements change.
How do I compare emissions after changing methods?
When moving from spend-based estimates to activity-based or supplier-specific data, keep comparisons consistent. Trends should reflect actual changes in emissions - not changes in accounting methods [1]. Set a formal recalculation policy to update your base-year inventory whenever methods change, and restate prior-year figures using the new method [1][2].
In your methodology report, document your assumptions, data sources, and reasons for each change. This keeps your reporting transparent and allows comparisons over time [3][1].



FAQ