Sep 18, 2026
Research Summary: Green-Blue Climate Planning
Sustainability Strategy
In This Article
Pair local green projects with regional water storage to cut runoff, reduce urban heat, and sustain benefits with maintenance and equity.
Research Summary: Green-Blue Climate Planning
I see a clear takeaway in this research: if you want better results, you should pair small, local green projects with larger water-storage systems and back both with steady maintenance, shared data, and equity-based siting. The studies point to the same pattern again and again: green-blue systems can cut annual runoff by 30%–70%, reduce peak flows by 20%–60%, cool some spaces by up to 8.6°F, and improve access to parks and shade where heat risk is highest.
If I had to boil the article down, it says:
Use the right tool in the right place. Street trees, bioswales, rain gardens, and permeable pavement work best close to where runoff starts.
Pair local fixes with larger storage. Floodplains, wetlands, and detention areas help during bigger storms.
Don’t plan flood and heat work separately. The same corridor can lower runoff, cool pavement, and improve walking conditions.
Target need, not just opportunity. Areas with less canopy, fewer parks, and higher flood risk should move up the list.
Budget for upkeep from day one. Without watering, pruning, cleaning, and tracking results, performance drops.
Shared governance matters. Cities get better long-term results when water, parks, streets, housing, and health teams work from the same playbook.
A few numbers stand out. Permeable pavement has shown about 50% runoff-volume reduction and 60% peak-flow reduction in monitored sites. Some rain gardens and bioswales along residential streets have reduced local runoff by up to 90%. Green roofs can be 30°F to 40°F cooler than standard roofs in summer. And regional programs like Los Angeles County’s Safe Clean Water Program show what scale looks like, with about $280 million per year tied to multi-benefit stormwater work.
For me, the main lesson is simple: one-off projects help, but connected networks do more. This research supports a city approach that links design standards, capital budgets, hazard maps, maintenance plans, and neighborhood priorities so flood, heat, and public-space gains last.
Building Climate-Resilient Cities: Blue-green infrastructure and inclusive planning
Flood Control and Water System Performance
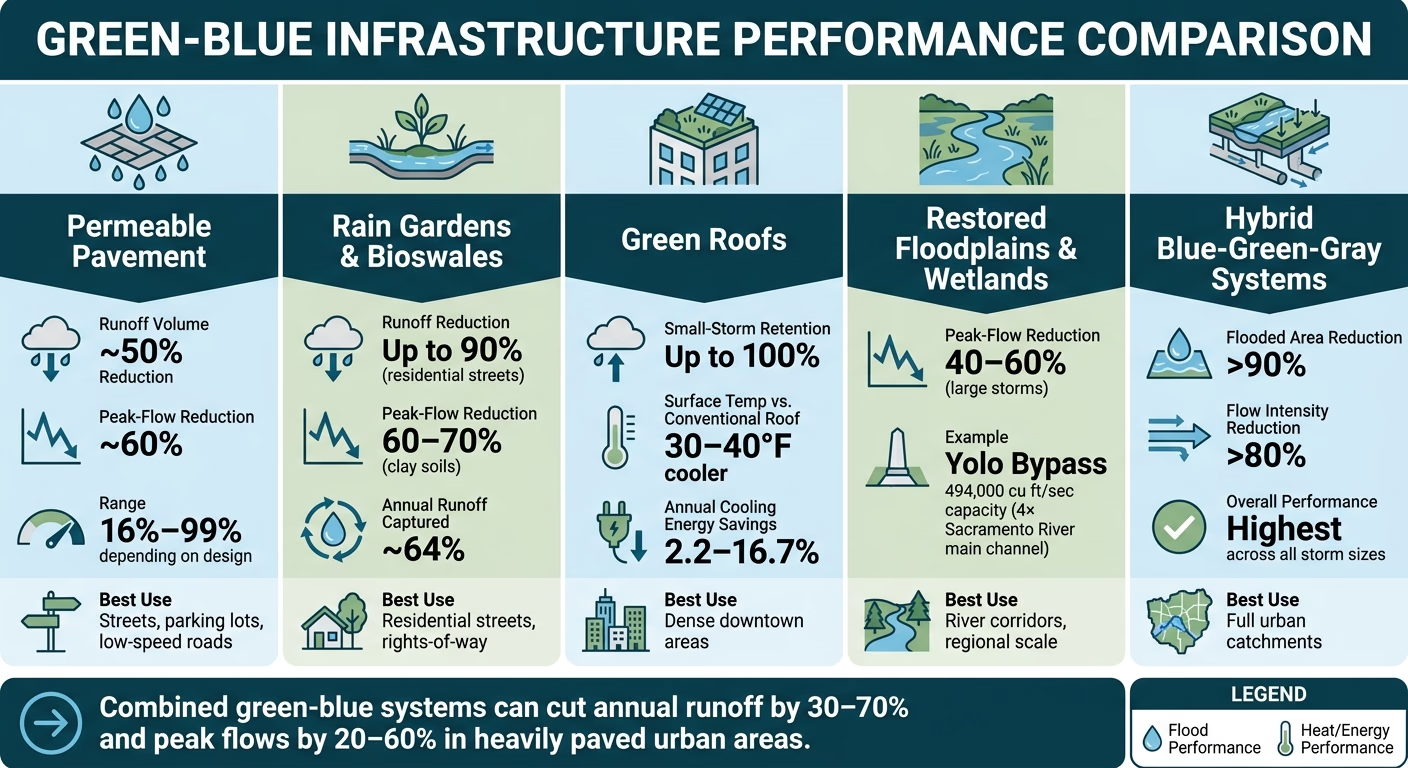
Green-Blue Infrastructure: Flood & Heat Performance by Type
Distributed green-blue systems - rain gardens, bioswales, permeable pavement, and green roofs - can cut annual runoff by 30–70% and peak flows by 20–60% in heavily paved urban areas. That range matters. These tools work, but they do not all work the same way, and they do not work equally well in every storm.
Permeable pavement, for example, has shown about 50% runoff-volume reduction and 60% peak-flow reduction in monitored sites. Green roofs can retain up to 100% of rainfall during small events, though that benefit drops as storms get stronger. Bioswales built on clay soils have captured about 64% of annual runoff and cut peak flows by 60–70%. That is strong performance, but there’s still a limit once major storms soak the system.
The main point is simple: no single measure can handle every storm. The practical issue is not whether green-blue systems work. It is where each one works best.
Where Flood-Control Measures Perform Best
Use source-control measures on streets and parking areas; use blue storage systems in floodplains and river corridors.
Decentralized measures work best close to the source. Streets, parking lots, alleys, sidewalks, and other rights-of-way produce runoff that can be intercepted before it reaches pipes. In U.S. case studies, rain gardens and bioswales along residential streets have reduced local runoff by up to 90%. Permeable pavement in parking lots and low-speed streets has fully captured storm events in some installations, with volume reductions ranging from 16% to nearly 99%, depending on design and soil conditions.
Larger-scale blue systems store floodwater during bigger storms. Restored floodplains, stormwater parks, and detention basins in river corridors are built to store water and reduce peak flows during larger events. Regional systems can deliver 40–60% reductions in peak flows during large storms by holding water for a time and releasing it more slowly.
The Yolo Bypass in California shows what that can look like at full scale. It can channel about 494,000 cubic feet per second, which is roughly four times the capacity of the Sacramento River's main channel.
To place each measure where it can do the most good, planners should use GIS flood maps, stormwater models such as EPA's SWMM, and social vulnerability overlays. Scenario modeling shows that maximum green-blue coverage can reduce peak flooding by around 50% even under high-urbanization conditions.
What Decision-Makers Should Do with the Evidence
Hybrid blue-green-gray portfolios beat single-track approaches. Green-blue systems handle frequent, smaller storms well. Gray infrastructure - pipes, culverts, underground storage tunnels, and pumps - takes on the rare but damaging extremes that saturate soils and overwhelm surface systems.
Studies of combined systems show that hybrid portfolios can reduce downstream flooded area by more than 90% and lower flow intensities by over 80% in retrofitted urban catchments. That’s a big shift. It also means siting decisions are doing more than flood work alone; the same choices affect cooling and public space, which the next section covers.
For decision-makers, the choice usually falls into three portfolio types:
Approach | Flood-Mitigation Performance | Co-Benefits | Cost & Governance |
|---|---|---|---|
Green-Only (bioswales, rain gardens, permeable pavement) | Strong for frequent, low-intensity storms (≤1 in.); reduces initial runoff volume by 50–70% | Heat mitigation, air quality, biodiversity, neighborhood aesthetics | Lower capital cost; requires decentralized maintenance and community buy-in; requires dedicated maintenance funding and monitoring |
Blue-Only (restored floodplains, wetlands, detention basins) | High regional storage; 40–60% peak-flow reduction for large events; limited for local pluvial flooding | Habitat restoration, carbon sequestration, groundwater recharge | High land requirements; complex multi-jurisdictional governance; requires dedicated maintenance funding and monitoring |
Hybrid Blue-Green-Gray | Highest overall; handles routine runoff and extreme peak events; >90% reduction in flooded area possible | Combines ecological, social, and safety benefits | Higher coordination complexity; requires cross-departmental coordination and diverse funding; requires dedicated maintenance funding and monitoring |
Conventional flood control often cuts rivers off from their floodplains. Green-blue planning brings back storage, filtration, and more room for water to move. Those same design decisions also shape heat, walkability, and public space.
Heat Mitigation, Land Use, and Public Space
Green-blue infrastructure cools cities in two main ways: shade and evapotranspiration. Shade keeps solar radiation off pavement and building surfaces. Evapotranspiration shifts heat into the air as water vapor. In plain terms, where these systems go - and how they’re built - shapes how much relief people feel on the ground. The same siting moves that help cut runoff also decide where cooling works best.
Cooling Performance Across Common Green-Blue Types
A recent synthesis found peak air-temperature drops of about 4.8°C (8.6°F) for green walls, 3.9°C (7.0°F) for green roofs, 3.1°C (5.6°F) for wetlands and parks, and 2.8°C (5.0°F) for street trees.[10][11]
Typology | Max. Air-Temp Reduction | Spatial Reach | Key Design Drivers |
|---|---|---|---|
Green Walls | Up to 4.8°C (8.6°F) | Building envelope and immediate sidewalk | Vegetation density, wall orientation, irrigation |
Green Roofs | Up to 3.9°C (7.0°F) | Building-specific; modest ambient effect | Substrate depth, plant coverage, drainage layer |
Wetlands | Up to 3.1°C (5.6°F) | Site and adjacent blocks | Surrounding vegetation density, water surface area |
Urban Parks | Up to 3.1°C (5.6°F) | Neighborhood to regional; can extend beyond park edges | Canopy cover above 30%, tree height, water features |
Street Trees | Up to 2.8°C (5.0°F) | Street corridor and adjacent sidewalks | Canopy continuity, species selection, planting strip width |
Not all green space cools the same way. Park performance, for example, depends less on sheer size and more on what’s inside the park - especially canopy height and water features.[12] A big open lawn may look green on a map, but it won’t cool like a park with tall trees and shaded paths.
Green roofs matter most in dense downtown areas, where ground-level space is tight and rooftops become part of the climate toolkit. In summer, surface temperatures on green roofs run 30–40°F cooler than conventional roofs.[14][15] Multiple studies also report annual cooling-energy cuts of 2.2–16.7%.[13]
Equity, Health, and Public-Space Outcomes
Cooling access is not shared evenly. National analyses show that neighborhoods within a 10-minute walk of a park can be up to 6°F cooler than places without that access. At the same time, in many of the 100 most populous U.S. cities, communities where most residents identify as Black, Hispanic/Latinx, American Indian/Alaska Native, or Asian have much less park acreage and tree canopy than majority-white neighborhoods.[9]
That gap matters because parks and green corridors do more than lower temperatures. Accessible, well-kept public green space supports physical activity, lower stress, and better self-rated health.[6][8][9] Green-blue plazas and park systems also act as social infrastructure. They create room for informal gatherings, civic events, and a stronger sense of safety - most of all when spaces reflect the people who use them and feel open to all.[4][8][9]
So heat planning is not just a landscaping choice. It is also a land-use and equity choice. At the same time, the research has limits. Systematic reviews note that most studies rely on cross-sectional data and rarely follow outcomes across multiple decades or under rising climate stress.[5][6][8] That means current health and equity findings point in a clear direction, but the long-term, compounding gains are not yet fully measured.
How to Site and Design Green-Blue Infrastructure for Underserved Areas
Agencies can target underserved neighborhoods more carefully by layering heat-risk maps, socio-demographic indicators, and land-use data.[6][7][9] Add park-access metrics and flood-risk data, and a clearer picture starts to emerge: priority corridors where one project can cut both heat exposure and runoff at the same time.
Land use sets the menu of what can work. Dense districts need building-scale and corridor-scale cooling, often through street trees, green roofs, and pocket plazas. Lower-density residential areas have more room for yard tree programs, green streets, and park expansion. Industrial districts, with their large parcels and heavy impervious cover, are strong candidates for perimeter tree belts, vegetated buffers, and stormwater wetlands. In high-demand zones, modeling shows energy-use reductions of up to 51% when green infrastructure is deployed at scale.[1][2]
Some patterns are clear across settings:
Continuous canopy works better than scattered planting.
Layered vegetation beats single-layer landscapes.
Local involvement also changes the outcome. When residents help shape programming and stewardship, usage goes up and the risk of displacement-driven green gentrification goes down.[4][8][9] Long-term stewardship plans matter just as much as initial build-out. Local jobs in tree care, park maintenance, and monitoring help keep cooling and health gains in place as trees mature and climate extremes grow more intense. Without pruning, watering, replacement, and monitoring, cooling gains fade over time.[5][6][8][9]
These gains rest on coordination across land use, maintenance, and monitoring.
Cross-Sector Planning, Governance, and Implementation
Coordination turns into a governance issue the moment a city moves from plans to delivery. Green-blue infrastructure does not hold up on design work alone. Governance shapes who pays, who maintains assets, who tracks results, and whether performance lasts over time.[19][20]
Governance Models and Monitoring Systems That Support Delivery
A department-led setup can get early projects off the ground fast. The tradeoff is pretty clear: it often narrows the work to one agency’s lane and misses citywide gains. When planning, public works, transportation, water utilities, parks, housing, and public health share formal decision-making through a cross-department steering group, projects are more likely to deal with flood risk, heat, and equity together rather than one by one.[16][18]
Philadelphia’s Green City, Clean Waters plan shows what that can look like in practice. It uses schools, streets, and rights-of-way to manage stormwater, with a target of 2,148 greened acres and about 2 billion gallons kept out of the Schuylkill and Delaware each year.[23]
That puts measurement on the same level as design. If a city can’t track what changed, it’s flying half-blind.
Governance Model | Key Advantages | Key Challenges | Typical Outcomes |
|---|---|---|---|
Department-Led | Clear accountability; faster decisions; fits existing workflows | Siloed projects; limited co-benefits; uneven citywide coverage | Visible early pilots; inconsistent standards across the city |
Cross-Departmental Steering Group | Aligns flood, heat, equity, and health goals; shared standards | Needs formal authority and conflict-resolution processes | More integrated networks; stronger maintenance and monitoring |
Regional Collaborative | Addresses watershed-scale flood and heat; shared funding | Complex governance; multiple jurisdictions and legal agreements | Basin-scale resilience; coordinated standards across municipalities |
Cities need to track three layers at once: baseline risk, project targets, and measured performance across flood, heat, and public-space outcomes. MARC’s framework does this by tracking impervious surface in floodplains, tree canopy, and park access.[22][18]
The OECD treats lifecycle monitoring and maintenance as core pillars, alongside institutional design, planning, funding, procurement, and appraisal.[19] In plain terms, that means cities should pay for maintenance from the start, name a lead entity, and build performance thresholds into permitting, zoning, and capital plans.[21][17]
How Council Fire Can Help Put Green-Blue Planning into Practice
The hard part now is moving from findings on paper to budgets, standards, and reporting that agencies can actually use. Council Fire helps governments turn green-blue strategy into measurable action by aligning governance, shared metrics, and measurement frameworks across flood, heat, public-space, and equity goals.
Conclusion: Key Research Takeaways for U.S. Decision-Makers
Put all of these findings together - flooding, heat, land use, and governance - and the message is plain: green-blue infrastructure works best when it functions as a connected system, not as a scatter of one-off projects. Citywide efforts like Portland's bioswales and Philadelphia's Green City, Clean Waters show what happens when scale meets steady governance.
The biggest points of failure are just as plain. Projects fall short when there is no money for maintenance, when agencies work in silos, and when equity is treated as an afterthought. Equity is part of performance. Without intentional siting and maintenance schedules weighted toward need, benefits do not spread evenly. Higher-income areas often get steadier upkeep, while lower-income neighborhoods face decline over time.[24][25]
For U.S. cities and counties, the near-term steps with the strongest backing are practical and fit within current budget and regulatory systems. Update stormwater, street, and park design standards so green-blue elements are required in new construction and major retrofits. Put GBI line items into multi-year capital improvement programs instead of leaning on short grant cycles. Use layered hazard, heat, and social vulnerability data - such as Philadelphia's GI Equity Index - to steer spending to places where climate and health risk overlap most.[30][29]
For regional agencies, the top job is coordination: shared mapping tools, common monitoring protocols across jurisdictions, and links between local projects so they work at the watershed scale. For foundations and institutional partners, the main roles are paying for planning-grade analysis, community-led data collection, and independent evaluations that feed results back into policy.[24][25][26]
That is why measurement needs to be built in from day one. Track hydrology, temperature, and neighborhood outcomes at the block level. Los Angeles County's Safe Clean Water Program offers a strong model: about $280 million a year for multi-benefit stormwater projects, paired with equity criteria and shared governance.[27][28] That should be the bar.
FAQs
What is green-blue climate planning?
Green-blue climate planning is an urban approach that links water systems - like ponds, canals, and wetlands - with vegetation and natural landscapes, including urban forests, parks, and green roofs.
Instead of treating stormwater, green space, and gray infrastructure as separate pieces, it views the urban water cycle as one connected network. The goal is simple: use natural processes alongside built systems to slow, store, and clean water while also supporting flood protection, heat reduction, and long-term community resilience.
Why combine local projects with larger water storage?
Combining local projects with larger water storage creates a hybrid system that handles both day-to-day rainfall and extreme storms.
Local green infrastructure captures stormwater where it falls, which takes pressure off drainage systems. When it’s paired with larger storage, such as retention ponds or restored floodplains, the system can handle peak demand more effectively, protect critical infrastructure, and support long-term resilience.
How should cities decide where to invest first?
Cities should put money where the data points them. That means using data-driven, risk-informed reviews that pair climate projections with social vulnerability data. When heat and flood exposure maps sit alongside socioeconomic data, the picture gets much clearer: you can spot frontline communities and critical assets where a breakdown could trigger ripple effects across the city.
From there, cities can rank projects based on benefit-cost, equity impact, and co-benefits. Those findings should then feed straight into capital improvement and land-use plans, so resilience isn't treated like an extra line item. It becomes a standard, funded part of development.
Related Blog Posts
Latest Articles
©2026

Narrative Change and Power Building: The Missing Half of Advocacy
Narrative change is the process of disrupting dominant narratives that normalize inequity and advancing new narratives from historically marginalized communities.
Funding Resilience Without Federal Grants
BRIC is unreliable and FEMA is shrinking. Here's how cities fund climate resilience with dedicated revenue, blended finance, and a coordinating authority.

The ESG Blind Spot: How AI Is Finding Risks in Companies Nobody Else Is Watching
Norway's sovereign wealth fund uses AI to screen 7,200 portfolio companies for forced labor and corruption within 24 hours. The real story is the emerging-market coverage gap that traditional ESG data vendors miss — and what it means for any company with a global supply chain.
Narrative Change and Power Building: The Missing Half of Advocacy
Narrative change is the process of disrupting dominant narratives that normalize inequity and advancing new narratives from historically marginalized communities.
Funding Resilience Without Federal Grants
BRIC is unreliable and FEMA is shrinking. Here's how cities fund climate resilience with dedicated revenue, blended finance, and a coordinating authority.
The ESG Blind Spot: How AI Is Finding Risks in Companies Nobody Else Is Watching
Norway's sovereign wealth fund uses AI to screen 7,200 portfolio companies for forced labor and corruption within 24 hours. The real story is the emerging-market coverage gap that traditional ESG data vendors miss — and what it means for any company with a global supply chain.
FAQ
01
What does it really mean to “redefine profit”?
02
What makes Council Fire different?
03
Who does Council Fire work with?
04
What does working with Council Fire actually look like?
05
How does Council Fire help organizations turn big goals into action?
06
How does Council Fire define and measure success?
07
How does technology fit into Council Fire’s work?
Sep 18, 2026
Research Summary: Green-Blue Climate Planning
Sustainability Strategy
In This Article
Pair local green projects with regional water storage to cut runoff, reduce urban heat, and sustain benefits with maintenance and equity.
Research Summary: Green-Blue Climate Planning
I see a clear takeaway in this research: if you want better results, you should pair small, local green projects with larger water-storage systems and back both with steady maintenance, shared data, and equity-based siting. The studies point to the same pattern again and again: green-blue systems can cut annual runoff by 30%–70%, reduce peak flows by 20%–60%, cool some spaces by up to 8.6°F, and improve access to parks and shade where heat risk is highest.
If I had to boil the article down, it says:
Use the right tool in the right place. Street trees, bioswales, rain gardens, and permeable pavement work best close to where runoff starts.
Pair local fixes with larger storage. Floodplains, wetlands, and detention areas help during bigger storms.
Don’t plan flood and heat work separately. The same corridor can lower runoff, cool pavement, and improve walking conditions.
Target need, not just opportunity. Areas with less canopy, fewer parks, and higher flood risk should move up the list.
Budget for upkeep from day one. Without watering, pruning, cleaning, and tracking results, performance drops.
Shared governance matters. Cities get better long-term results when water, parks, streets, housing, and health teams work from the same playbook.
A few numbers stand out. Permeable pavement has shown about 50% runoff-volume reduction and 60% peak-flow reduction in monitored sites. Some rain gardens and bioswales along residential streets have reduced local runoff by up to 90%. Green roofs can be 30°F to 40°F cooler than standard roofs in summer. And regional programs like Los Angeles County’s Safe Clean Water Program show what scale looks like, with about $280 million per year tied to multi-benefit stormwater work.
For me, the main lesson is simple: one-off projects help, but connected networks do more. This research supports a city approach that links design standards, capital budgets, hazard maps, maintenance plans, and neighborhood priorities so flood, heat, and public-space gains last.
Building Climate-Resilient Cities: Blue-green infrastructure and inclusive planning
Flood Control and Water System Performance
Green-Blue Infrastructure: Flood & Heat Performance by Type
Distributed green-blue systems - rain gardens, bioswales, permeable pavement, and green roofs - can cut annual runoff by 30–70% and peak flows by 20–60% in heavily paved urban areas. That range matters. These tools work, but they do not all work the same way, and they do not work equally well in every storm.
Permeable pavement, for example, has shown about 50% runoff-volume reduction and 60% peak-flow reduction in monitored sites. Green roofs can retain up to 100% of rainfall during small events, though that benefit drops as storms get stronger. Bioswales built on clay soils have captured about 64% of annual runoff and cut peak flows by 60–70%. That is strong performance, but there’s still a limit once major storms soak the system.
The main point is simple: no single measure can handle every storm. The practical issue is not whether green-blue systems work. It is where each one works best.
Where Flood-Control Measures Perform Best
Use source-control measures on streets and parking areas; use blue storage systems in floodplains and river corridors.
Decentralized measures work best close to the source. Streets, parking lots, alleys, sidewalks, and other rights-of-way produce runoff that can be intercepted before it reaches pipes. In U.S. case studies, rain gardens and bioswales along residential streets have reduced local runoff by up to 90%. Permeable pavement in parking lots and low-speed streets has fully captured storm events in some installations, with volume reductions ranging from 16% to nearly 99%, depending on design and soil conditions.
Larger-scale blue systems store floodwater during bigger storms. Restored floodplains, stormwater parks, and detention basins in river corridors are built to store water and reduce peak flows during larger events. Regional systems can deliver 40–60% reductions in peak flows during large storms by holding water for a time and releasing it more slowly.
The Yolo Bypass in California shows what that can look like at full scale. It can channel about 494,000 cubic feet per second, which is roughly four times the capacity of the Sacramento River's main channel.
To place each measure where it can do the most good, planners should use GIS flood maps, stormwater models such as EPA's SWMM, and social vulnerability overlays. Scenario modeling shows that maximum green-blue coverage can reduce peak flooding by around 50% even under high-urbanization conditions.
What Decision-Makers Should Do with the Evidence
Hybrid blue-green-gray portfolios beat single-track approaches. Green-blue systems handle frequent, smaller storms well. Gray infrastructure - pipes, culverts, underground storage tunnels, and pumps - takes on the rare but damaging extremes that saturate soils and overwhelm surface systems.
Studies of combined systems show that hybrid portfolios can reduce downstream flooded area by more than 90% and lower flow intensities by over 80% in retrofitted urban catchments. That’s a big shift. It also means siting decisions are doing more than flood work alone; the same choices affect cooling and public space, which the next section covers.
For decision-makers, the choice usually falls into three portfolio types:
Approach | Flood-Mitigation Performance | Co-Benefits | Cost & Governance |
|---|---|---|---|
Green-Only (bioswales, rain gardens, permeable pavement) | Strong for frequent, low-intensity storms (≤1 in.); reduces initial runoff volume by 50–70% | Heat mitigation, air quality, biodiversity, neighborhood aesthetics | Lower capital cost; requires decentralized maintenance and community buy-in; requires dedicated maintenance funding and monitoring |
Blue-Only (restored floodplains, wetlands, detention basins) | High regional storage; 40–60% peak-flow reduction for large events; limited for local pluvial flooding | Habitat restoration, carbon sequestration, groundwater recharge | High land requirements; complex multi-jurisdictional governance; requires dedicated maintenance funding and monitoring |
Hybrid Blue-Green-Gray | Highest overall; handles routine runoff and extreme peak events; >90% reduction in flooded area possible | Combines ecological, social, and safety benefits | Higher coordination complexity; requires cross-departmental coordination and diverse funding; requires dedicated maintenance funding and monitoring |
Conventional flood control often cuts rivers off from their floodplains. Green-blue planning brings back storage, filtration, and more room for water to move. Those same design decisions also shape heat, walkability, and public space.
Heat Mitigation, Land Use, and Public Space
Green-blue infrastructure cools cities in two main ways: shade and evapotranspiration. Shade keeps solar radiation off pavement and building surfaces. Evapotranspiration shifts heat into the air as water vapor. In plain terms, where these systems go - and how they’re built - shapes how much relief people feel on the ground. The same siting moves that help cut runoff also decide where cooling works best.
Cooling Performance Across Common Green-Blue Types
A recent synthesis found peak air-temperature drops of about 4.8°C (8.6°F) for green walls, 3.9°C (7.0°F) for green roofs, 3.1°C (5.6°F) for wetlands and parks, and 2.8°C (5.0°F) for street trees.[10][11]
Typology | Max. Air-Temp Reduction | Spatial Reach | Key Design Drivers |
|---|---|---|---|
Green Walls | Up to 4.8°C (8.6°F) | Building envelope and immediate sidewalk | Vegetation density, wall orientation, irrigation |
Green Roofs | Up to 3.9°C (7.0°F) | Building-specific; modest ambient effect | Substrate depth, plant coverage, drainage layer |
Wetlands | Up to 3.1°C (5.6°F) | Site and adjacent blocks | Surrounding vegetation density, water surface area |
Urban Parks | Up to 3.1°C (5.6°F) | Neighborhood to regional; can extend beyond park edges | Canopy cover above 30%, tree height, water features |
Street Trees | Up to 2.8°C (5.0°F) | Street corridor and adjacent sidewalks | Canopy continuity, species selection, planting strip width |
Not all green space cools the same way. Park performance, for example, depends less on sheer size and more on what’s inside the park - especially canopy height and water features.[12] A big open lawn may look green on a map, but it won’t cool like a park with tall trees and shaded paths.
Green roofs matter most in dense downtown areas, where ground-level space is tight and rooftops become part of the climate toolkit. In summer, surface temperatures on green roofs run 30–40°F cooler than conventional roofs.[14][15] Multiple studies also report annual cooling-energy cuts of 2.2–16.7%.[13]
Equity, Health, and Public-Space Outcomes
Cooling access is not shared evenly. National analyses show that neighborhoods within a 10-minute walk of a park can be up to 6°F cooler than places without that access. At the same time, in many of the 100 most populous U.S. cities, communities where most residents identify as Black, Hispanic/Latinx, American Indian/Alaska Native, or Asian have much less park acreage and tree canopy than majority-white neighborhoods.[9]
That gap matters because parks and green corridors do more than lower temperatures. Accessible, well-kept public green space supports physical activity, lower stress, and better self-rated health.[6][8][9] Green-blue plazas and park systems also act as social infrastructure. They create room for informal gatherings, civic events, and a stronger sense of safety - most of all when spaces reflect the people who use them and feel open to all.[4][8][9]
So heat planning is not just a landscaping choice. It is also a land-use and equity choice. At the same time, the research has limits. Systematic reviews note that most studies rely on cross-sectional data and rarely follow outcomes across multiple decades or under rising climate stress.[5][6][8] That means current health and equity findings point in a clear direction, but the long-term, compounding gains are not yet fully measured.
How to Site and Design Green-Blue Infrastructure for Underserved Areas
Agencies can target underserved neighborhoods more carefully by layering heat-risk maps, socio-demographic indicators, and land-use data.[6][7][9] Add park-access metrics and flood-risk data, and a clearer picture starts to emerge: priority corridors where one project can cut both heat exposure and runoff at the same time.
Land use sets the menu of what can work. Dense districts need building-scale and corridor-scale cooling, often through street trees, green roofs, and pocket plazas. Lower-density residential areas have more room for yard tree programs, green streets, and park expansion. Industrial districts, with their large parcels and heavy impervious cover, are strong candidates for perimeter tree belts, vegetated buffers, and stormwater wetlands. In high-demand zones, modeling shows energy-use reductions of up to 51% when green infrastructure is deployed at scale.[1][2]
Some patterns are clear across settings:
Continuous canopy works better than scattered planting.
Layered vegetation beats single-layer landscapes.
Local involvement also changes the outcome. When residents help shape programming and stewardship, usage goes up and the risk of displacement-driven green gentrification goes down.[4][8][9] Long-term stewardship plans matter just as much as initial build-out. Local jobs in tree care, park maintenance, and monitoring help keep cooling and health gains in place as trees mature and climate extremes grow more intense. Without pruning, watering, replacement, and monitoring, cooling gains fade over time.[5][6][8][9]
These gains rest on coordination across land use, maintenance, and monitoring.
Cross-Sector Planning, Governance, and Implementation
Coordination turns into a governance issue the moment a city moves from plans to delivery. Green-blue infrastructure does not hold up on design work alone. Governance shapes who pays, who maintains assets, who tracks results, and whether performance lasts over time.[19][20]
Governance Models and Monitoring Systems That Support Delivery
A department-led setup can get early projects off the ground fast. The tradeoff is pretty clear: it often narrows the work to one agency’s lane and misses citywide gains. When planning, public works, transportation, water utilities, parks, housing, and public health share formal decision-making through a cross-department steering group, projects are more likely to deal with flood risk, heat, and equity together rather than one by one.[16][18]
Philadelphia’s Green City, Clean Waters plan shows what that can look like in practice. It uses schools, streets, and rights-of-way to manage stormwater, with a target of 2,148 greened acres and about 2 billion gallons kept out of the Schuylkill and Delaware each year.[23]
That puts measurement on the same level as design. If a city can’t track what changed, it’s flying half-blind.
Governance Model | Key Advantages | Key Challenges | Typical Outcomes |
|---|---|---|---|
Department-Led | Clear accountability; faster decisions; fits existing workflows | Siloed projects; limited co-benefits; uneven citywide coverage | Visible early pilots; inconsistent standards across the city |
Cross-Departmental Steering Group | Aligns flood, heat, equity, and health goals; shared standards | Needs formal authority and conflict-resolution processes | More integrated networks; stronger maintenance and monitoring |
Regional Collaborative | Addresses watershed-scale flood and heat; shared funding | Complex governance; multiple jurisdictions and legal agreements | Basin-scale resilience; coordinated standards across municipalities |
Cities need to track three layers at once: baseline risk, project targets, and measured performance across flood, heat, and public-space outcomes. MARC’s framework does this by tracking impervious surface in floodplains, tree canopy, and park access.[22][18]
The OECD treats lifecycle monitoring and maintenance as core pillars, alongside institutional design, planning, funding, procurement, and appraisal.[19] In plain terms, that means cities should pay for maintenance from the start, name a lead entity, and build performance thresholds into permitting, zoning, and capital plans.[21][17]
How Council Fire Can Help Put Green-Blue Planning into Practice
The hard part now is moving from findings on paper to budgets, standards, and reporting that agencies can actually use. Council Fire helps governments turn green-blue strategy into measurable action by aligning governance, shared metrics, and measurement frameworks across flood, heat, public-space, and equity goals.
Conclusion: Key Research Takeaways for U.S. Decision-Makers
Put all of these findings together - flooding, heat, land use, and governance - and the message is plain: green-blue infrastructure works best when it functions as a connected system, not as a scatter of one-off projects. Citywide efforts like Portland's bioswales and Philadelphia's Green City, Clean Waters show what happens when scale meets steady governance.
The biggest points of failure are just as plain. Projects fall short when there is no money for maintenance, when agencies work in silos, and when equity is treated as an afterthought. Equity is part of performance. Without intentional siting and maintenance schedules weighted toward need, benefits do not spread evenly. Higher-income areas often get steadier upkeep, while lower-income neighborhoods face decline over time.[24][25]
For U.S. cities and counties, the near-term steps with the strongest backing are practical and fit within current budget and regulatory systems. Update stormwater, street, and park design standards so green-blue elements are required in new construction and major retrofits. Put GBI line items into multi-year capital improvement programs instead of leaning on short grant cycles. Use layered hazard, heat, and social vulnerability data - such as Philadelphia's GI Equity Index - to steer spending to places where climate and health risk overlap most.[30][29]
For regional agencies, the top job is coordination: shared mapping tools, common monitoring protocols across jurisdictions, and links between local projects so they work at the watershed scale. For foundations and institutional partners, the main roles are paying for planning-grade analysis, community-led data collection, and independent evaluations that feed results back into policy.[24][25][26]
That is why measurement needs to be built in from day one. Track hydrology, temperature, and neighborhood outcomes at the block level. Los Angeles County's Safe Clean Water Program offers a strong model: about $280 million a year for multi-benefit stormwater projects, paired with equity criteria and shared governance.[27][28] That should be the bar.
FAQs
What is green-blue climate planning?
Green-blue climate planning is an urban approach that links water systems - like ponds, canals, and wetlands - with vegetation and natural landscapes, including urban forests, parks, and green roofs.
Instead of treating stormwater, green space, and gray infrastructure as separate pieces, it views the urban water cycle as one connected network. The goal is simple: use natural processes alongside built systems to slow, store, and clean water while also supporting flood protection, heat reduction, and long-term community resilience.
Why combine local projects with larger water storage?
Combining local projects with larger water storage creates a hybrid system that handles both day-to-day rainfall and extreme storms.
Local green infrastructure captures stormwater where it falls, which takes pressure off drainage systems. When it’s paired with larger storage, such as retention ponds or restored floodplains, the system can handle peak demand more effectively, protect critical infrastructure, and support long-term resilience.
How should cities decide where to invest first?
Cities should put money where the data points them. That means using data-driven, risk-informed reviews that pair climate projections with social vulnerability data. When heat and flood exposure maps sit alongside socioeconomic data, the picture gets much clearer: you can spot frontline communities and critical assets where a breakdown could trigger ripple effects across the city.
From there, cities can rank projects based on benefit-cost, equity impact, and co-benefits. Those findings should then feed straight into capital improvement and land-use plans, so resilience isn't treated like an extra line item. It becomes a standard, funded part of development.
Related Blog Posts
Latest Articles
©2026
Narrative Change and Power Building: The Missing Half of Advocacy
Narrative change is the process of disrupting dominant narratives that normalize inequity and advancing new narratives from historically marginalized communities.
Funding Resilience Without Federal Grants
BRIC is unreliable and FEMA is shrinking. Here's how cities fund climate resilience with dedicated revenue, blended finance, and a coordinating authority.
The ESG Blind Spot: How AI Is Finding Risks in Companies Nobody Else Is Watching
Norway's sovereign wealth fund uses AI to screen 7,200 portfolio companies for forced labor and corruption within 24 hours. The real story is the emerging-market coverage gap that traditional ESG data vendors miss — and what it means for any company with a global supply chain.
FAQ
What does it really mean to “redefine profit”?
What makes Council Fire different?
Who does Council Fire work with?
What does working with Council Fire actually look like?
How does Council Fire help organizations turn big goals into action?
How does Council Fire define and measure success?
How does technology fit into Council Fire’s work?