
May 28, 2026
How to Develop Metrics, Monitoring, and Verification (MRV) for Impact for Universities & Research Institutions
Sustainability Strategy
In This Article
Universities: build MRV systems, set mission KPIs, automate monitoring and verify data for credible sustainability impact.
How to Develop Metrics, Monitoring, and Verification (MRV) for Impact for Universities & Research Institutions
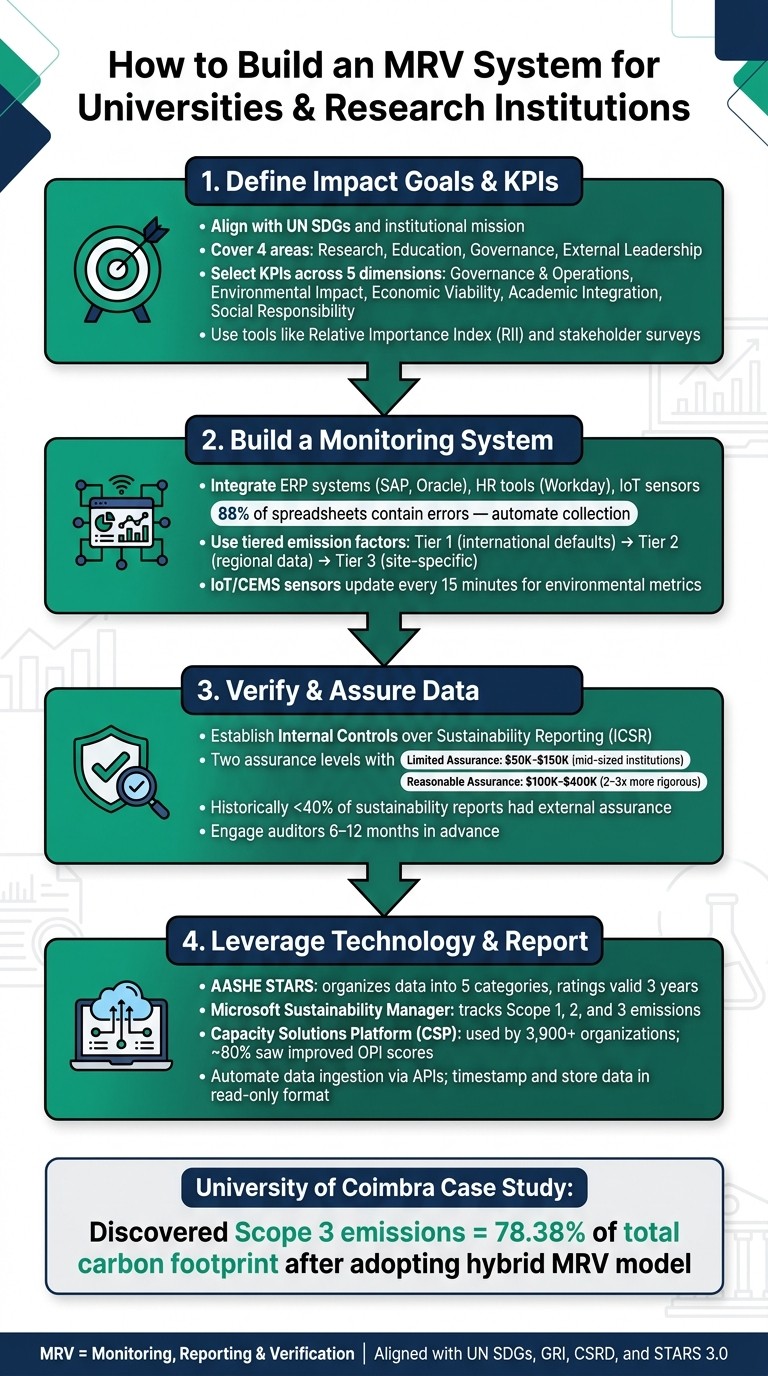
Universities and research institutions play a critical role in shaping the future, but many struggle to measure their true impact. Metrics, Monitoring, and Verification (MRV) systems offer a structured way to track and validate data, ensuring that sustainability and social contributions are accurately represented. Here's how institutions can build effective MRV systems:
Set Clear Goals and KPIs: Align impact goals with institutional missions and global frameworks like the UN SDGs. Focus on meaningful metrics across research, education, governance, and community engagement.
Create a Monitoring System: Use tools like ERP systems, IoT sensors, and AI-powered platforms to automate data collection and reduce errors. Ensure scalability and reliability for long-term use.
Verify and Assure Data: Establish internal controls and consider external audits to validate the accuracy of reported data. This builds trust with stakeholders and meets regulatory requirements.
Leverage Technology: Platforms like AASHE STARS and Microsoft Sustainability Manager simplify data management and reporting, while automation ensures consistency and transparency.
How to Build an MRV System for Universities: 4-Step Framework
MRV Explained: How to Measure, Report & Verify Carbon Emissions
Step 1: Define Impact Goals and Key Performance Indicators (KPIs)
Before diving into tracking data, it’s crucial to clarify what you aim to achieve. Skipping this step often leads to collecting metrics that are easy to measure but don’t truly reflect meaningful progress.
Aligning Goals with Institutional Mission and Values
Start by organizing your impact goals into four main areas: Research, Education, Organizational Governance, and External Leadership. This approach ensures a balanced focus, avoiding an overemphasis on easily quantifiable metrics like energy usage while overlooking more complex areas such as the influence of research on public policy or how curricula shape students' values [6].
Linking these goals to the UN Sustainable Development Goals (SDGs) provides a globally recognized framework. It also simplifies communication with external stakeholders, such as funders, accreditors, and government agencies. For example, in 2025, a team led by Phoebe Koundouri at the Athens University of Economics and Business (AUEB) used this method to analyze 870 working papers, curricula, and policies. Their findings highlighted strong alignment with SDG 8 (Decent Work and Economic Growth) at 80.7% and SDG 5 (Gender Equality) at 81.4%, but revealed gaps in environmental SDGs [6].
It’s also important to distinguish between potential impact signals, like patent filings, and confirmed outcomes, such as citations in policy documents.
"Responsible measurement does not mean measuring everything, nor reducing impact to a single score. It means choosing appropriate signals, interpreting them with care, and using them in ways that support analysis and decision making." - Dmytro Filchenko, Senior Director, Research & Analytics at the Institute for Scientific Information [5]
By aligning your goals with institutional values and global standards, you can then identify the KPIs that best capture these impacts.
Selecting Relevant KPIs for Sustainability and Social Impact
Defining goals is only half the battle - choosing KPIs that genuinely matter is the next step. These should cover five critical dimensions: Governance & Operations, Environmental Impact, Economic Viability, Academic Integration, and Social Responsibility [2]. This avoids the common pitfall of focusing too heavily on environmental metrics while neglecting areas like financial health or social equity.
Dimension | Focus Areas |
|---|---|
Governance & Operations | Institutional frameworks, strategic plans, stakeholder engagement |
Environmental Impact | Energy efficiency, waste management, carbon footprint |
Economic Viability | Financial assistance programs, ethical costing, resource allocation |
Academic Integration | Sustainability literacy, interdisciplinary research, integration in curricula |
Social Responsibility | Gender equity, community engagement, diversity, well-being |
Stakeholder input is essential for selecting KPIs that reflect shared priorities. Students, faculty, and staff often have differing views on what matters most. Tools like structured surveys or gap analyses can help identify these priorities. The Relative Importance Index (RII), for instance, ranks KPIs based on their perceived significance across different campus groups.
A 2026 Delphi study of Nigerian universities demonstrated how institutional context shapes KPI selection. For universities in the early stages of sustainability efforts, "commercialized research outputs" and "campus fleet" emerged as top priorities [7]. The lesson here? Established frameworks like STARS 3.0 or the SDGs are useful starting points, but they need to be customized to fit your institution’s specific situation and development stage.
Step 2: Build a Monitoring System for Continuous Data Collection
Once you've identified your KPIs, the next step is to establish a system that collects data consistently without creating unnecessary administrative burdens.
Data Collection Tools and Techniques
Effective monitoring systems often leverage existing institutional data sources. By integrating with platforms like ERP systems (e.g., SAP, Oracle), HR tools (e.g., Workday), or building management systems, you can automate real-time data collection. This approach minimizes manual effort and avoids errors - 88% of spreadsheets contain mistakes [8], which can undermine the credibility of your data when subjected to external review.
For tracking environmental metrics, such as energy usage or emissions, IoT sensors and Continuous Emission Monitoring Systems (CEMS) provide updates as frequently as every 15 minutes [9]. On the social impact side - covering areas like supplier diversity, community engagement, or employee well-being - structured digital surveys are an efficient way to gather insights, particularly when working with diverse stakeholders across multiple departments or partner organizations.
Data Collection Mode | Best Use Case |
|---|---|
Direct Integration (ERP, HRIS, Lab systems) | Financial and operational metrics |
Document Intelligence (AI extraction from PDFs) | Utility bills, lab reports, contracts |
Survey Campaigns | Social impact and supplier diversity metrics |
Live Monitoring (IoT, CEMS sensors) | Real-time environmental metrics |
Bulk Uploads (validated CSV/XLSX) | Historical data or one-time reports |
Document intelligence is especially useful for extracting structured data from unstructured formats like utility invoices or lab reports. Some platforms offer pre-trained AI extractors for over 35 document types [9], making them invaluable for organizations managing large volumes of data, such as research institutions. Once continuous data collection is in place, the focus should shift to ensuring the system is scalable and reliable over the long term.
Designing for Scalability and Long-Term Use
A monitoring system must be designed to grow with your institution. A setup that works today but falters under expanded goals, additional departments, or staff turnover isn't a sustainable solution - it's a stopgap. To ensure longevity, start with a centralized data catalog. This catalog should clearly outline every metric, its source, how it's calculated, and who is responsible for it [8]. This transparency ensures continuity, making it easier for new team members to step in seamlessly if someone leaves.
Data quality is another critical consideration. A tiered approach to emission factors allows you to start reporting immediately while improving accuracy over time. For example, you might begin with international default figures (Tier 1), progress to regional economic data (Tier 2), and eventually use site-specific measurements (Tier 3) [4]. This method was effectively demonstrated by the University of Coimbra in 2023. By adopting a hybrid carbon footprint model that combined process-based and economic-based data, they found their total carbon footprint was far higher than previously estimated. Specifically, Scope 3 emissions represented 78.38% of their impact, an area that had been overlooked under their earlier system [4].
To maintain data integrity, implement automated validation controls from the outset. Features like range checks, year-on-year variance alerts, and multi-level approval workflows can catch anomalies before they appear in your reports [8]. These controls are more than just quality measures - they ensure your data can withstand scrutiny from auditors or funders. A well-designed system not only supports current needs but also lays the groundwork for a dependable Monitoring, Reporting, and Verification (MRV) framework.
Step 3: Verify and Assure Impact Data for Credible Reporting
Once data has been gathered, the next step is to verify its accuracy. This ensures your reporting is trustworthy for stakeholders, funders, and regulators.
Setting Up Verification Protocols
Developing strong verification protocols begins with establishing Internal Controls over Sustainability Reporting (ICSR). This involves documenting data sources, validation processes, and how evidence is stored. Every reported figure must be traceable back to its origin, whether it's from a utility bill, meter reading, or survey response. To identify potential issues, conduct a trial run 8–9 months into your reporting cycle. Use this opportunity to simulate an audit, compile necessary evidence, and address any gaps. Afterward, prepare a Management Assertion to confirm compliance with recognized standards like STARS or GRI, ensuring the data is free from material misstatements [10].
While internal controls form the foundation, external verification adds another layer of credibility to your reports.
Working with Third-Party Auditors
External assurance is becoming increasingly important, especially as regulations like the Corporate Sustainability Reporting Directive (CSRD) begin to require it. Historically, fewer than 40% of sustainability reports have undergone external assurance [10]. As this practice transitions from optional to mandatory, organizations must understand their options.
Third-party assurance typically comes in two levels:
Assurance Level | Conclusion Type | Testing Requirement |
|---|---|---|
Limited Assurance | "Nothing has come to our attention..." | Focused on analytical reviews and limited testing |
Reasonable Assurance | "In our opinion, the statement is fairly presented..." | Involves rigorous testing, larger samples, and detailed reviews |
Reasonable assurance offers a higher level of confidence but comes at a higher cost - typically 2–3 times more than limited assurance. For mid-sized organizations, limited assurance fees usually fall between $50,000 and $150,000, while reasonable assurance can range from $100,000 to $400,000, depending on the complexity of the institution [10].
"The real value of assurance lies in the discipline it imposes on data management, controls, and governance." - Council Fire [10]
To keep the process efficient, assign a single point of contact to handle auditor requests and track outstanding items. Auditors will not only examine numerical data but also verify that qualitative claims are backed by evidence. This requires teams like facilities managers, HR analysts, and procurement officers to be prepared to explain their data collection methods. Engage auditors 6–12 months in advance to avoid last-minute complications or a qualified opinion.
Tools and Best Practices for Implementing MRV Systems
With verification protocols established, selecting tools that simplify the daily management of MRV (Monitoring, Reporting, and Verification) data is critical.
Using Technology for Data Management and Reporting
The right software can make or break the success of an MRV system. In the context of higher education, AASHE STARS stands out as a tailored solution. It organizes sustainability data into five key categories - Academics, Engagement, Operations, Planning & Administration, and Innovation & Leadership - and assigns publicly recognized ratings valid for three years [11]. To streamline the process, institutions can utilize STARS' internal review templates to identify and correct data inconsistencies before submission, accelerating the official publication timeline.
For tracking emissions, the Microsoft Sustainability Manager offers a robust platform for managing Scope 1, 2, and 3 emissions. A practical approach is to start small - such as focusing solely on Scope 2 purchased electricity - and validate the workflow entirely before expanding. This step-by-step method reduces the risk of errors that could snowball across a larger dataset [14].
Institutions looking to broaden their focus beyond environmental metrics to include social and institutional impacts might consider the Capacity Solutions Platform (CSP). Supporting over 3,900 organizations worldwide, CSP employs the Organizational Performance Index (OPI) to monitor institutional effectiveness over time [15]. For example, a study in Nigeria revealed that nearly 80% of agencies using CSP's MRV tools saw measurable improvements in their OPI scores [15].
One indispensable best practice across all platforms is automating data ingestion. Moving away from manual spreadsheets and adopting APIs or system connectors allows near real-time visibility into environmental impact while reducing transcription errors that can undermine audit credibility [13][14]. To ensure traceability for third-party verifiers, each data point should be timestamped and stored securely in a read-only format [12][13]. Automation not only enhances data integrity but also integrates seamlessly into existing operational controls, making MRV processes more efficient and reliable.
Case Studies: MRV in Practice at Academic Institutions
Real-world examples highlight how institutions at different stages of MRV implementation have achieved success by leveraging these tools and methods.
The University of Coimbra, for instance, validated a hybrid MRV framework that uncovered previously unquantified Scope 3 emissions [4]. In January 2026, Agnes Scott College gained recognition for its transparent MRV practices, specifically for documenting its data collection and quality assurance processes in a way that built trust among stakeholders. During the 2022–2023 reporting cycle, Bentley University collaborated with GreenerU, an independent sustainability consultant, for a third-party review of its sustainability disclosures. This added an extra layer of credibility without requiring a full audit. Similarly, in 2023, Boise State University partnered with California State University, Stanislaus for peer verification of its STARS report data, demonstrating the value of collaboration in ensuring accuracy before submission.
These examples reveal a consistent theme: institutions that invest in structured data systems and seek external review - whether through auditors, peer institutions, or consultants - produce reports that withstand scrutiny and inspire stakeholder confidence.
Conclusion: Building a Culture of Accountability through MRV
An MRV system is far more than a tool for reporting; it represents a pledge to uphold precision and responsibility. When universities align their metrics with their core mission, sustainability evolves from being a peripheral initiative to becoming an integral part of daily operations. This approach not only simplifies data management but also embeds sustainability into the institution's identity.
Forward-thinking institutions go beyond monitoring energy usage or waste. They adopt a "whole-of-institution" perspective [1], evaluating their impact across governance, academics, operations, and community engagement. This comprehensive approach distinguishes institutions that merely meet compliance requirements from those that drive meaningful change.
Instead of focusing solely on consumption, institutions can highlight their positive contributions, often referred to as their "handprint." This term captures the measurable, beneficial outcomes of their research and teaching efforts. For instance, one university's project-based sustainability course enabled partner organizations to cut emissions by an estimated 704,000 kg CO₂-eq [3].
Maintaining rigorous data controls, from limited to reasonable assurance, ensures the data is audit-ready. This level of accuracy not only enhances the institution's credibility but also strengthens trust with stakeholders, funders, and regulators.
As discussed earlier, the success of MRV systems relies on collective involvement at every level of the institution. When faculty, students, staff, and leadership understand the importance of the data and actively contribute to it, accountability shifts from being a mere obligation to becoming part of the institution’s culture. By aligning metrics and verification processes with institutional values, MRV becomes more than a reporting tool - it transforms into a foundational element of the institution's ethos.
FAQs
Where should we start if we have little impact data today?
To begin, establish clear objectives that align closely with your institution’s mission. This ensures that every piece of data you collect serves a meaningful purpose. Focus on identifying 3–5 core outcome metrics that are both practical to monitor and directly connected to your goals. Take stock of the data you already have - such as administrative or research records - and consider using proxy indicators when direct measurement isn't possible. Involve stakeholders early in the process to help prioritize critical areas of focus, and aim to scale your efforts incrementally as your resources and capabilities expand.
How do we choose KPIs that align with our mission and the UN SDGs?
To begin, conduct a double materiality assessment to understand how environmental, social, and governance (ESG) factors affect your institution both financially and socially. This process helps uncover the dual impact: how ESG issues influence your organization and how your activities affect broader societal and environmental goals.
Next, align your institution's core functions - such as teaching, research, operations, and community engagement - with relevant Sustainable Development Goal (SDG) targets. This mapping ensures that your efforts are purpose-driven and focused on contributing to global priorities.
When setting performance indicators, apply the SMART framework. This means your key performance indicators (KPIs) should be specific, measurable, achievable, relevant, and time-bound. This approach brings clarity and structure to your goals, making progress easier to track and evaluate.
To maintain academic rigor and ensure alignment with long-term institutional objectives, consider established frameworks like STARS (Sustainability Tracking, Assessment & Rating System). Such standards provide a structured methodology for assessing sustainability performance in higher education, keeping your institution on a well-defined path.
What level of third-party assurance do we need, and when?
Third-party assurance plays a key role in verifying the accuracy of sustainability disclosures. The level of assurance you need typically hinges on regulatory requirements and what stakeholders expect.
Limited assurance serves as an entry point, offering a moderate level of confidence by conducting basic checks.
Reasonable assurance involves deeper, more detailed testing, delivering a confidence level comparable to that of financial audits.
Organizations often start with limited assurance and gradually advance to reasonable assurance, particularly for metrics deemed critical. This phased approach allows them to build trust and refine their reporting processes over time.
Related Blog Posts
Latest Articles
©2025


FAQ
01
What does it really mean to “redefine profit”?
02
What makes Council Fire different?
03
Who does Council Fire work with?
04
What does working with Council Fire actually look like?
05
How does Council Fire help organizations turn big goals into action?
06
How does Council Fire define and measure success?
May 28, 2026
How to Develop Metrics, Monitoring, and Verification (MRV) for Impact for Universities & Research Institutions
Sustainability Strategy
In This Article
Universities: build MRV systems, set mission KPIs, automate monitoring and verify data for credible sustainability impact.
How to Develop Metrics, Monitoring, and Verification (MRV) for Impact for Universities & Research Institutions
Universities and research institutions play a critical role in shaping the future, but many struggle to measure their true impact. Metrics, Monitoring, and Verification (MRV) systems offer a structured way to track and validate data, ensuring that sustainability and social contributions are accurately represented. Here's how institutions can build effective MRV systems:
Set Clear Goals and KPIs: Align impact goals with institutional missions and global frameworks like the UN SDGs. Focus on meaningful metrics across research, education, governance, and community engagement.
Create a Monitoring System: Use tools like ERP systems, IoT sensors, and AI-powered platforms to automate data collection and reduce errors. Ensure scalability and reliability for long-term use.
Verify and Assure Data: Establish internal controls and consider external audits to validate the accuracy of reported data. This builds trust with stakeholders and meets regulatory requirements.
Leverage Technology: Platforms like AASHE STARS and Microsoft Sustainability Manager simplify data management and reporting, while automation ensures consistency and transparency.
How to Build an MRV System for Universities: 4-Step Framework
MRV Explained: How to Measure, Report & Verify Carbon Emissions
Step 1: Define Impact Goals and Key Performance Indicators (KPIs)
Before diving into tracking data, it’s crucial to clarify what you aim to achieve. Skipping this step often leads to collecting metrics that are easy to measure but don’t truly reflect meaningful progress.
Aligning Goals with Institutional Mission and Values
Start by organizing your impact goals into four main areas: Research, Education, Organizational Governance, and External Leadership. This approach ensures a balanced focus, avoiding an overemphasis on easily quantifiable metrics like energy usage while overlooking more complex areas such as the influence of research on public policy or how curricula shape students' values [6].
Linking these goals to the UN Sustainable Development Goals (SDGs) provides a globally recognized framework. It also simplifies communication with external stakeholders, such as funders, accreditors, and government agencies. For example, in 2025, a team led by Phoebe Koundouri at the Athens University of Economics and Business (AUEB) used this method to analyze 870 working papers, curricula, and policies. Their findings highlighted strong alignment with SDG 8 (Decent Work and Economic Growth) at 80.7% and SDG 5 (Gender Equality) at 81.4%, but revealed gaps in environmental SDGs [6].
It’s also important to distinguish between potential impact signals, like patent filings, and confirmed outcomes, such as citations in policy documents.
"Responsible measurement does not mean measuring everything, nor reducing impact to a single score. It means choosing appropriate signals, interpreting them with care, and using them in ways that support analysis and decision making." - Dmytro Filchenko, Senior Director, Research & Analytics at the Institute for Scientific Information [5]
By aligning your goals with institutional values and global standards, you can then identify the KPIs that best capture these impacts.
Selecting Relevant KPIs for Sustainability and Social Impact
Defining goals is only half the battle - choosing KPIs that genuinely matter is the next step. These should cover five critical dimensions: Governance & Operations, Environmental Impact, Economic Viability, Academic Integration, and Social Responsibility [2]. This avoids the common pitfall of focusing too heavily on environmental metrics while neglecting areas like financial health or social equity.
Dimension | Focus Areas |
|---|---|
Governance & Operations | Institutional frameworks, strategic plans, stakeholder engagement |
Environmental Impact | Energy efficiency, waste management, carbon footprint |
Economic Viability | Financial assistance programs, ethical costing, resource allocation |
Academic Integration | Sustainability literacy, interdisciplinary research, integration in curricula |
Social Responsibility | Gender equity, community engagement, diversity, well-being |
Stakeholder input is essential for selecting KPIs that reflect shared priorities. Students, faculty, and staff often have differing views on what matters most. Tools like structured surveys or gap analyses can help identify these priorities. The Relative Importance Index (RII), for instance, ranks KPIs based on their perceived significance across different campus groups.
A 2026 Delphi study of Nigerian universities demonstrated how institutional context shapes KPI selection. For universities in the early stages of sustainability efforts, "commercialized research outputs" and "campus fleet" emerged as top priorities [7]. The lesson here? Established frameworks like STARS 3.0 or the SDGs are useful starting points, but they need to be customized to fit your institution’s specific situation and development stage.
Step 2: Build a Monitoring System for Continuous Data Collection
Once you've identified your KPIs, the next step is to establish a system that collects data consistently without creating unnecessary administrative burdens.
Data Collection Tools and Techniques
Effective monitoring systems often leverage existing institutional data sources. By integrating with platforms like ERP systems (e.g., SAP, Oracle), HR tools (e.g., Workday), or building management systems, you can automate real-time data collection. This approach minimizes manual effort and avoids errors - 88% of spreadsheets contain mistakes [8], which can undermine the credibility of your data when subjected to external review.
For tracking environmental metrics, such as energy usage or emissions, IoT sensors and Continuous Emission Monitoring Systems (CEMS) provide updates as frequently as every 15 minutes [9]. On the social impact side - covering areas like supplier diversity, community engagement, or employee well-being - structured digital surveys are an efficient way to gather insights, particularly when working with diverse stakeholders across multiple departments or partner organizations.
Data Collection Mode | Best Use Case |
|---|---|
Direct Integration (ERP, HRIS, Lab systems) | Financial and operational metrics |
Document Intelligence (AI extraction from PDFs) | Utility bills, lab reports, contracts |
Survey Campaigns | Social impact and supplier diversity metrics |
Live Monitoring (IoT, CEMS sensors) | Real-time environmental metrics |
Bulk Uploads (validated CSV/XLSX) | Historical data or one-time reports |
Document intelligence is especially useful for extracting structured data from unstructured formats like utility invoices or lab reports. Some platforms offer pre-trained AI extractors for over 35 document types [9], making them invaluable for organizations managing large volumes of data, such as research institutions. Once continuous data collection is in place, the focus should shift to ensuring the system is scalable and reliable over the long term.
Designing for Scalability and Long-Term Use
A monitoring system must be designed to grow with your institution. A setup that works today but falters under expanded goals, additional departments, or staff turnover isn't a sustainable solution - it's a stopgap. To ensure longevity, start with a centralized data catalog. This catalog should clearly outline every metric, its source, how it's calculated, and who is responsible for it [8]. This transparency ensures continuity, making it easier for new team members to step in seamlessly if someone leaves.
Data quality is another critical consideration. A tiered approach to emission factors allows you to start reporting immediately while improving accuracy over time. For example, you might begin with international default figures (Tier 1), progress to regional economic data (Tier 2), and eventually use site-specific measurements (Tier 3) [4]. This method was effectively demonstrated by the University of Coimbra in 2023. By adopting a hybrid carbon footprint model that combined process-based and economic-based data, they found their total carbon footprint was far higher than previously estimated. Specifically, Scope 3 emissions represented 78.38% of their impact, an area that had been overlooked under their earlier system [4].
To maintain data integrity, implement automated validation controls from the outset. Features like range checks, year-on-year variance alerts, and multi-level approval workflows can catch anomalies before they appear in your reports [8]. These controls are more than just quality measures - they ensure your data can withstand scrutiny from auditors or funders. A well-designed system not only supports current needs but also lays the groundwork for a dependable Monitoring, Reporting, and Verification (MRV) framework.
Step 3: Verify and Assure Impact Data for Credible Reporting
Once data has been gathered, the next step is to verify its accuracy. This ensures your reporting is trustworthy for stakeholders, funders, and regulators.
Setting Up Verification Protocols
Developing strong verification protocols begins with establishing Internal Controls over Sustainability Reporting (ICSR). This involves documenting data sources, validation processes, and how evidence is stored. Every reported figure must be traceable back to its origin, whether it's from a utility bill, meter reading, or survey response. To identify potential issues, conduct a trial run 8–9 months into your reporting cycle. Use this opportunity to simulate an audit, compile necessary evidence, and address any gaps. Afterward, prepare a Management Assertion to confirm compliance with recognized standards like STARS or GRI, ensuring the data is free from material misstatements [10].
While internal controls form the foundation, external verification adds another layer of credibility to your reports.
Working with Third-Party Auditors
External assurance is becoming increasingly important, especially as regulations like the Corporate Sustainability Reporting Directive (CSRD) begin to require it. Historically, fewer than 40% of sustainability reports have undergone external assurance [10]. As this practice transitions from optional to mandatory, organizations must understand their options.
Third-party assurance typically comes in two levels:
Assurance Level | Conclusion Type | Testing Requirement |
|---|---|---|
Limited Assurance | "Nothing has come to our attention..." | Focused on analytical reviews and limited testing |
Reasonable Assurance | "In our opinion, the statement is fairly presented..." | Involves rigorous testing, larger samples, and detailed reviews |
Reasonable assurance offers a higher level of confidence but comes at a higher cost - typically 2–3 times more than limited assurance. For mid-sized organizations, limited assurance fees usually fall between $50,000 and $150,000, while reasonable assurance can range from $100,000 to $400,000, depending on the complexity of the institution [10].
"The real value of assurance lies in the discipline it imposes on data management, controls, and governance." - Council Fire [10]
To keep the process efficient, assign a single point of contact to handle auditor requests and track outstanding items. Auditors will not only examine numerical data but also verify that qualitative claims are backed by evidence. This requires teams like facilities managers, HR analysts, and procurement officers to be prepared to explain their data collection methods. Engage auditors 6–12 months in advance to avoid last-minute complications or a qualified opinion.
Tools and Best Practices for Implementing MRV Systems
With verification protocols established, selecting tools that simplify the daily management of MRV (Monitoring, Reporting, and Verification) data is critical.
Using Technology for Data Management and Reporting
The right software can make or break the success of an MRV system. In the context of higher education, AASHE STARS stands out as a tailored solution. It organizes sustainability data into five key categories - Academics, Engagement, Operations, Planning & Administration, and Innovation & Leadership - and assigns publicly recognized ratings valid for three years [11]. To streamline the process, institutions can utilize STARS' internal review templates to identify and correct data inconsistencies before submission, accelerating the official publication timeline.
For tracking emissions, the Microsoft Sustainability Manager offers a robust platform for managing Scope 1, 2, and 3 emissions. A practical approach is to start small - such as focusing solely on Scope 2 purchased electricity - and validate the workflow entirely before expanding. This step-by-step method reduces the risk of errors that could snowball across a larger dataset [14].
Institutions looking to broaden their focus beyond environmental metrics to include social and institutional impacts might consider the Capacity Solutions Platform (CSP). Supporting over 3,900 organizations worldwide, CSP employs the Organizational Performance Index (OPI) to monitor institutional effectiveness over time [15]. For example, a study in Nigeria revealed that nearly 80% of agencies using CSP's MRV tools saw measurable improvements in their OPI scores [15].
One indispensable best practice across all platforms is automating data ingestion. Moving away from manual spreadsheets and adopting APIs or system connectors allows near real-time visibility into environmental impact while reducing transcription errors that can undermine audit credibility [13][14]. To ensure traceability for third-party verifiers, each data point should be timestamped and stored securely in a read-only format [12][13]. Automation not only enhances data integrity but also integrates seamlessly into existing operational controls, making MRV processes more efficient and reliable.
Case Studies: MRV in Practice at Academic Institutions
Real-world examples highlight how institutions at different stages of MRV implementation have achieved success by leveraging these tools and methods.
The University of Coimbra, for instance, validated a hybrid MRV framework that uncovered previously unquantified Scope 3 emissions [4]. In January 2026, Agnes Scott College gained recognition for its transparent MRV practices, specifically for documenting its data collection and quality assurance processes in a way that built trust among stakeholders. During the 2022–2023 reporting cycle, Bentley University collaborated with GreenerU, an independent sustainability consultant, for a third-party review of its sustainability disclosures. This added an extra layer of credibility without requiring a full audit. Similarly, in 2023, Boise State University partnered with California State University, Stanislaus for peer verification of its STARS report data, demonstrating the value of collaboration in ensuring accuracy before submission.
These examples reveal a consistent theme: institutions that invest in structured data systems and seek external review - whether through auditors, peer institutions, or consultants - produce reports that withstand scrutiny and inspire stakeholder confidence.
Conclusion: Building a Culture of Accountability through MRV
An MRV system is far more than a tool for reporting; it represents a pledge to uphold precision and responsibility. When universities align their metrics with their core mission, sustainability evolves from being a peripheral initiative to becoming an integral part of daily operations. This approach not only simplifies data management but also embeds sustainability into the institution's identity.
Forward-thinking institutions go beyond monitoring energy usage or waste. They adopt a "whole-of-institution" perspective [1], evaluating their impact across governance, academics, operations, and community engagement. This comprehensive approach distinguishes institutions that merely meet compliance requirements from those that drive meaningful change.
Instead of focusing solely on consumption, institutions can highlight their positive contributions, often referred to as their "handprint." This term captures the measurable, beneficial outcomes of their research and teaching efforts. For instance, one university's project-based sustainability course enabled partner organizations to cut emissions by an estimated 704,000 kg CO₂-eq [3].
Maintaining rigorous data controls, from limited to reasonable assurance, ensures the data is audit-ready. This level of accuracy not only enhances the institution's credibility but also strengthens trust with stakeholders, funders, and regulators.
As discussed earlier, the success of MRV systems relies on collective involvement at every level of the institution. When faculty, students, staff, and leadership understand the importance of the data and actively contribute to it, accountability shifts from being a mere obligation to becoming part of the institution’s culture. By aligning metrics and verification processes with institutional values, MRV becomes more than a reporting tool - it transforms into a foundational element of the institution's ethos.
FAQs
Where should we start if we have little impact data today?
To begin, establish clear objectives that align closely with your institution’s mission. This ensures that every piece of data you collect serves a meaningful purpose. Focus on identifying 3–5 core outcome metrics that are both practical to monitor and directly connected to your goals. Take stock of the data you already have - such as administrative or research records - and consider using proxy indicators when direct measurement isn't possible. Involve stakeholders early in the process to help prioritize critical areas of focus, and aim to scale your efforts incrementally as your resources and capabilities expand.
How do we choose KPIs that align with our mission and the UN SDGs?
To begin, conduct a double materiality assessment to understand how environmental, social, and governance (ESG) factors affect your institution both financially and socially. This process helps uncover the dual impact: how ESG issues influence your organization and how your activities affect broader societal and environmental goals.
Next, align your institution's core functions - such as teaching, research, operations, and community engagement - with relevant Sustainable Development Goal (SDG) targets. This mapping ensures that your efforts are purpose-driven and focused on contributing to global priorities.
When setting performance indicators, apply the SMART framework. This means your key performance indicators (KPIs) should be specific, measurable, achievable, relevant, and time-bound. This approach brings clarity and structure to your goals, making progress easier to track and evaluate.
To maintain academic rigor and ensure alignment with long-term institutional objectives, consider established frameworks like STARS (Sustainability Tracking, Assessment & Rating System). Such standards provide a structured methodology for assessing sustainability performance in higher education, keeping your institution on a well-defined path.
What level of third-party assurance do we need, and when?
Third-party assurance plays a key role in verifying the accuracy of sustainability disclosures. The level of assurance you need typically hinges on regulatory requirements and what stakeholders expect.
Limited assurance serves as an entry point, offering a moderate level of confidence by conducting basic checks.
Reasonable assurance involves deeper, more detailed testing, delivering a confidence level comparable to that of financial audits.
Organizations often start with limited assurance and gradually advance to reasonable assurance, particularly for metrics deemed critical. This phased approach allows them to build trust and refine their reporting processes over time.
Related Blog Posts
FAQ
What does it really mean to “redefine profit”?
What makes Council Fire different?
Who does Council Fire work with?
What does working with Council Fire actually look like?
How does Council Fire help organizations turn big goals into action?
How does Council Fire define and measure success?