
Jun 27, 2026
How to Measure and Communicate Collective Impact for Universities & Research Institutions
Capacity Building
In This Article
Define one campus goal, use shared measures and SDG mapping, build a single dashboard, and tailor reporting to each audience.
How to Measure and Communicate Collective Impact for Universities & Research Institutions
If I want one clear view of campus impact, I need one shared system - not four separate reports. The article’s core point is simple: I should define one campus-wide goal, use a small set of shared measures across teaching, research, campus services, and community work, connect those measures to outcomes, and report them in plain language for each audience.
Here’s the short version:
Start with scope, not data. I first decide what change the institution is trying to make.
Use shared measures. Activity counts alone do not show impact.
Link work to outcomes. Logic models, theory of change, and SDG tags help show how effort connects to results.
Build one data system. Clear ownership, shared definitions, and a regular update cycle matter.
Change the message, not the evidence. Funders, policymakers, students, faculty, and partners need different framing from the same record.
A few facts stand out:
A 2023UNC System study found 93% of degree programs had a positive student ROI.
Undergraduate degree completers were estimated to earn nearly $500,000 more over a lifetime than non-degree holders.
Partnership outcomes should be checked at 6 and 12 months, not just at launch.
A 3- to 6-month reporting cycle is often enough to keep impact data current without overloading staff.
I’d boil the article down to one working model: set a common agenda, pick shared measures, map them to outcomes, build a trusted dashboard, and tailor the story for each audience. That gives leaders, funders, and partners one version of the truth they can use.
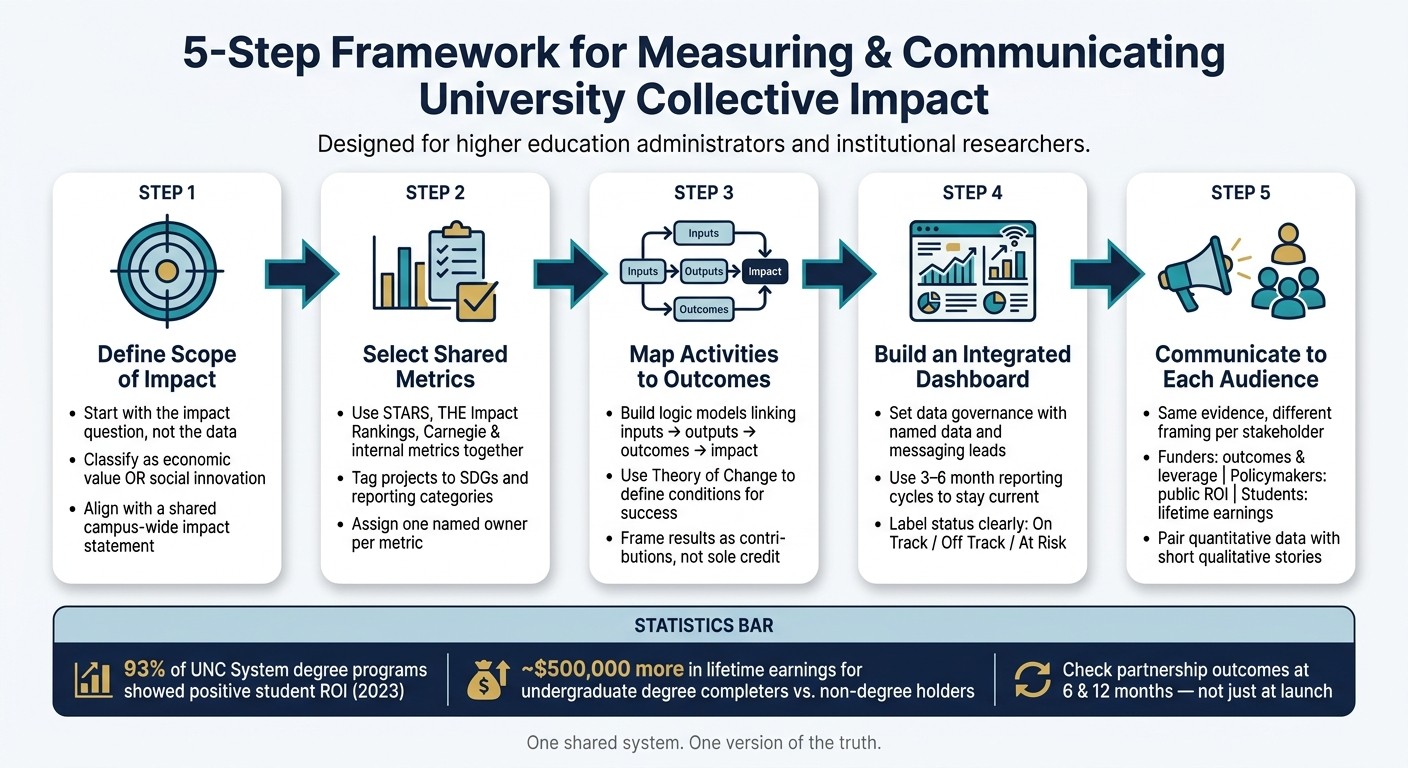
5-Step Framework for Measuring & Communicating University Collective Impact
Overview of the Collective Impact Framework - Module #2 | National Council of Social Service
1. Define the scope of impact before choosing metrics
Start with the impact question. Then pick the metrics.
If a team skips that step, it usually ends up tracking activity counts: events held, papers published, students enrolled. Those numbers may look busy on a dashboard, but they don't answer the main issue: what change is this work meant to create? Once the scope is clear, it becomes much easier to link each activity to the mission area it serves.
Set a common agenda across teaching, research, operations, and engagement
A shared impact statement gives each unit one point of reference. Without it, teams drift toward their own scorecards, and the institution produces siloed reports instead of one clear story.
A good place to start is classifying the initiative as either technology transfer and regional economic value or sustainability, social innovation, and community well-being [4]. That choice shapes which metrics make sense. Just as important, the scope should be checked with the people who will use the data, not set in isolation.
In May 2026, UNC Greensboro (UNCG) aligned its community engagement data with the 17 United Nations Sustainable Development Goals. That SDG tagging helped turn engagement data into something leaders could use, and as the UNCG case study noted:
"SDG tagging turns engagement data into strategic insight, not only documenting breadth, but clarifying purpose and collective direction." [1]
UNCG became the second institution in the United States to track SDGs in this way, giving campus leadership a clearer view of where effort was concentrated and where gaps remained across mission areas [1].
Identify the stakeholders who shape and use the measurement system
The people who will use the system should help shape it. If they don't, the system can miss the mark.
As Susana Campbell, Provost Associate Professor at American University, put it:
"It is useless to have more data without a clear decision-making structure that [the data are] going into." [2]
Before locking in the measurement system, map users to the role each group plays:
Stakeholder Group | Primary Role |
|---|---|
Campus Leadership | Sets the common agenda and allocates resources |
Institutional Research | Manages data governance and dashboard reporting |
Faculty & Students | Implements co-creation, research, and service-learning |
Community Partners | Defines relevant outcomes and validates cultural fit |
Policymakers & Funders | Sets accountability standards and uses data for decisions |
Bring these users in before data collection begins. In 2022, the Indiana University Indianapolis Office of Community Engagement ran partner interviews with 11 community partners and 8 faculty and staff members to test its partner survey. That process led to a measurement tool that tracked outcomes across eight themes, including health disparities and community safety. The survey became more useful for both reporting and decision-making [7].
With scope and users in place, the next move is choosing shared metrics.
2. Select shared metrics and align them to recognized frameworks
Once the scope is set, the next move is to choose the metrics that will guide decisions. Keep the set small and balanced. You want indicators that help leaders manage the work and help outside audiences see what matters. Every metric should tie back to the shared impact statement from Step 1, not to what happens to be easy for one unit to count.
Choose a balanced set of indicators for each mission area
Each mission area needs its own indicators, but all of them should connect to the same shared impact statement. For teaching and learning, that means looking past enrollment counts alone. Focus on outcomes such as student return on investment and workforce alignment. Those measures say more about whether the institution is doing its job in ways that matter to students, families, and state leaders.
A 2023 study of the University of North Carolina System found that 93% of degree programs had a positive return on investment for students, and undergraduate degree completers are estimated to earn nearly $500,000 more over their lifetime than non-degree holders [2]. That kind of metric lands with policymakers and prospective students because it speaks in plain terms about long-term payoff.
For research and engagement, measure changes in knowledge, behavior, policy, or quality of life. For campus operations, use standard categories such as energy efficiency, greenhouse gas emissions, waste management, and sustainable procurement. These categories map cleanly to outside frameworks and make year-over-year comparison easier.
Partnership depth needs a stricter test. Don’t just record that a partnership exists. Track whether community partners helped define the outcomes in the first place. Then check outcomes at 6 and 12 months to see whether the results hold up over time [8].
These metrics only help if each one is tied to a clear outcome and a clear reporting use.
Use STARS, THE Impact Rankings, Carnegie, and internal metrics together
No single framework does the whole job. The better approach is to use them together, with the SDGs as the common thread. Build one metric set, then reuse it across STARS, THE Impact Rankings, Carnegie, and internal reporting. That cuts duplicate work and keeps the story straight.
At UNC Greensboro, for example, engagement data in its Collaboratory platform was linked to specific SDGs. That connection helped bridge STARS reporting with community-engaged research without duplicate data entry [1].
Use each framework for what it does best, then connect the pieces through SDG tags.
Framework | Strengths | Limitations | Best use |
|---|---|---|---|
Standardized, transparent sustainability tracking | Focused on internal campus sustainability; can be data-intensive | Operations, administration, teaching, research | |
THE Impact Rankings | Global benchmarking; aligns directly with all 17 UN SDGs | Self-reported data; may favor larger institutions | SDG-oriented institutional performance |
Validates institutional commitment and partnership reciprocity | Documentation-heavy; qualitative focus limits direct numerical comparison | Mission, leadership, faculty/student involvement, community voice | |
Internal Metrics | Tailored to local priorities and regional workforce needs | Lacks external comparability and may need framework alignment for broader credibility | Local ROI, workforce alignment, specific community outcomes |
A simple way to keep this clean is to:
Assign each metric to one primary framework
Note any secondary use across other frameworks
Tag projects to both SDGs and reporting categories where it makes sense
Name one owner for collection, validation, and reporting
A single outreach project, for instance, can be tagged to both an SDG and a STARS credit, which helps cut duplicate data entry [1][8].
Once the metric set is fixed, map each indicator to the outcomes it is meant to influence.
3. Use logic models, theory of change, and SDG mapping to connect activities to outcomes
Shared metrics only matter if they sit inside a clear model of change. The tougher question is simple: what actually caused the result? That’s where logic models and theory of change frameworks come in. A logic model links inputs to activities, outputs, outcomes, and impact. A theory of change starts with the impact you want, then spells out the conditions needed to get there. Used together, they help institutions pick indicators at each stage and stay honest about what they can reasonably claim [6]. A logic model makes that pathway easy to see.
One idea that belongs in either framework is the boundary of attribution - the point where you can no longer take direct credit for a result. Being clear about that line makes impact claims more believable, not weaker [6].
Once the metrics are in place, logic models show how those metrics connect to change on the ground.
Build a logic model for a cross-campus or partnership initiative
A concrete example helps clear up the difference between outputs and outcomes.
Take a sustainable irrigation partnership. It might use faculty expertise, student volunteers, and grant funding as inputs; training workshops as the activity; farmer adoption as the outcome; and regional drought resilience as the impact [8].
Outputs are what you delivered. Outcomes are what changed because of it.
Map programs and results to the Sustainable Development Goals
After the logic model is built, SDG mapping gives it a shared language that outside audiences already know. Tag parts of the model to SDG targets, not just goal numbers, so readers can see where work is concentrated and where gaps still exist [1] [8].
UNC Greensboro used this method in its Collaboratory platform to tag community-engaged activity to SDG targets and show how partnerships linked to broader sustainability priorities [1].
Logic Model Element | University Example | Relevant SDG Target |
|---|---|---|
Input | Faculty expertise, student volunteers, and grant funding | N/A |
Activity | Technical training workshops for local smallholder farmers | N/A |
Output | 150 farmers trained in sustainable irrigation techniques | Target 2.4: Sustainable food production systems |
Outcome | 30% reduction in agricultural water use among participants over 12 months | Target 6.4: Increase water-use efficiency |
Impact | Improved regional drought resilience and food security | SDG 2 & SDG 6 |
When you describe SDG results, frame them as contributions, not sole credit. Broad social outcomes happen for many reasons. Positioning your institution as one meaningful contributor keeps claims honest and defensible [6].
Use the logic model and SDG tags to shape dashboard fields, reporting rules, and audience-specific reporting. Once the model is set, it becomes the blueprint for what the dashboard should track and how each audience should read it.
4. Build an integrated data system and dashboard that stakeholders can trust
A data system turns a logic model into steady, institution-wide evidence. It gives people one place to look, one set of rules to follow, and one shared view of progress. That structure also helps you settle the practical stuff early: who owns each metric, when data gets updated, and how people are expected to read the dashboard.
Set up data governance, roles, and reporting rules
Start with ownership. Every metric needs a named owner who is responsible for keeping it current and accurate. In many schools and universities, two roles work well together: data leads, who tie data back to institutional priorities, and messaging leads, who shape how that evidence is explained and shared [9].
Ownership alone isn’t enough. Shared definitions matter just as much. If separate offices count the same activity in different ways, the numbers won’t line up. Before you pull data together, define each indicator, set its baseline, and agree on its update cadence. For collective impact indicators, a 3- to 6-month reporting cycle often works well. It’s frequent enough to spot movement, but not so frequent that staff get buried in reporting [3].
A useful dashboard does more than display numbers. It should connect each metric to goals, short narrative notes, risks, and a review cadence. Before any report goes out, check for stale data and use plain status labels like on track, off track, and at risk. Add short evidence notes that explain what changed, what risks are in play, and what kind of support leadership may need to provide [10].
"We finally have one record of what we said we'd do, what we're doing, and what we've achieved." - Lori Borden, Chief of Staff [10]
Choose the right dashboard approach for your institution's scale
Once governance is in place, the dashboard can give units and audiences one consistent view. That doesn’t mean every institution needs a custom platform right away. In practice, the best option depends on a few simple questions: How many data sources need to come together? Who needs access? Is the dashboard meant for internal management, public communication, or both?
Dashboard Approach | Scalability | Transparency | Usability | Best For |
|---|---|---|---|---|
Spreadsheets | Low; difficult to maintain across large institutions | Low; prone to version control issues and stale data | High for individuals; low for teams | Small-scale pilot projects or single-unit tracking |
Institutional Data Warehouses (BI) | High; handles data from IR, HR, and Finance | High; provides a single source of truth | Moderate; shows what happened but rarely why | Compliance reporting and high-level institutional oversight |
Custom/Specialized Dashboards | High; can integrate via APIs across platforms | Very high; supports public-facing impact stories | High; designed for non-technical stakeholders | Collective impact reporting and stakeholder engagement |
The dashboard should track outcomes, not just activity counts, if it’s going to stay tied to collective impact goals. That’s where many institutions slip up: they count effort but miss results. UNCG offers a good example of the stronger approach. Its SDG-linked data shows concentrations of effort, gaps, and public impact in one view [1].
When that shared evidence base is in place, audience-specific reporting gets a lot easier. Funders, students, faculty, and policymakers may need different framing, but they can all work from the same underlying record.
5. Communicate results clearly to funders, policymakers, students, faculty, and partners
Once a trusted dashboard is in place, the last step is simple in theory and easy to miss in practice: translate the evidence for each audience. The evidence itself should stay the same. What changes is the framing.
That shared evidence base should cover teaching, research, operations, and engagement, using the same metric families built in earlier steps. This matters because it keeps everyone working from one record instead of a different version of the story for each group.
Tailor the message to each audience without changing the evidence
Use the same proof, but lead with what each audience cares about most. Draw from the student outcomes, research outcomes, sustainability outcomes, and partnership outcomes already built into the measurement system.
Stakeholder | What to Lead With |
|---|---|
Funders | Outcomes achieved, leverage created, grant portfolio impact |
Policymakers | Public value, regional effects, and state-level ROI |
Students | Career satisfaction, economic security, and lifetime earnings |
Faculty | Participation, learning outcomes, and institutional incentives |
Community Partners | Shared benefits, trust, and reciprocity in goal-setting |
One move that tends to strengthen almost any stakeholder narrative is the counterfactual: say what likely would not have happened without the collaboration [2]. That shifts the story from a rundown of activities to a clear case for continued support.
It also helps to pair quantitative data with short qualitative stories. UNC Greensboro offers a strong model. In 2024, the university published Volume 4 of its Excellence in Community Engagement & Community-Engaged Scholarship series, blending data on engagement trends with specific partnership stories like "A Community Comes Together", which supports Congolese refugees. That kind of data-backed storytelling makes the numbers easier to remember and easier to use [5].
"SDG tagging turns engagement data into strategic insight, not only documenting breadth, but clarifying purpose and collective direction." - UNCG Use Case Report [1]
The same evidence can then be reused across briefs, slide decks, public summaries, and partner reports. The record stays fixed; the emphasis shifts based on who is reading it.
Conclusion: A practical model for credible and useful impact reporting
When institutions keep one shared evidence base and explain it clearly for each audience, collective impact reporting becomes more credible, more usable, and more strategic.
FAQs
How do we choose one campus-wide impact goal?
Use a bottom-up approach that brings people in from across the institution. That’s how you build trust, legitimacy, and buy-in from the start. A working group can help here. Pull together people from academics, communications, and financial leadership to weigh the costs, benefits, and feasibility of possible metrics.
Instead of setting a goal from the top and hoping it sticks, look for shared priorities across campus and the community. The best goals usually come from overlap: what the institution cares about, what partners need, and what people can support in practice. Tools like theory of change frameworks or SDG mapping can help connect the goal to broader outcomes and partner priorities.
What metrics best show outcomes, not just activity?
Focus on metrics that show what changed, not just what took place. It’s easy to count workshops, attendees, or events. That tells you about activity, but not much about impact. The better test is whether people changed their behavior, whether systems shifted, and whether conditions on the ground improved.
That might mean tracking the adoption of new practices, gains in sustainable behavior, or whether environmental projects are still active months or years later. Those signals get closer to the point: did the work stick?
Use longitudinal tracking and community-centered indicators to see impact over time, in the places where it matters. Numbers help, but they don’t tell the whole story. Pair quantitative data with narrative self-evaluations so people can explain what changed, what got in the way, and what the data alone might miss.
How can we build a trusted impact dashboard with limited staff?
Prioritize clarity and user-centered design. Don’t turn the dashboard into a bloated mission control center. Start small, build in rounds, and bring stakeholders in early so everyone agrees on what the dashboard is for and how it should be used.
Trust comes from being open about what the data can show - and what it can’t. Say where the gaps are. Flag assumptions. Be clear about timing, coverage, and blind spots. Numbers matter, but they rarely tell the whole story on their own. Pair quantitative data with qualitative narratives so people can see both the metrics and the human context behind them.
Frameworks like the SDGs can also help. They give teams a shared language for mapping, visualizing, and talking about connected impact across social, economic, and planetary outcomes.
Related Blog Posts
Latest Articles
©2025


FAQ
01
What does it really mean to “redefine profit”?
02
What makes Council Fire different?
03
Who does Council Fire you work with?
04
What does working with Council Fire actually look like?
05
How does Council Fire help organizations turn big goals into action?
06
How does Council Fire define and measure success?
Jun 27, 2026
How to Measure and Communicate Collective Impact for Universities & Research Institutions
Capacity Building
In This Article
Define one campus goal, use shared measures and SDG mapping, build a single dashboard, and tailor reporting to each audience.
How to Measure and Communicate Collective Impact for Universities & Research Institutions
If I want one clear view of campus impact, I need one shared system - not four separate reports. The article’s core point is simple: I should define one campus-wide goal, use a small set of shared measures across teaching, research, campus services, and community work, connect those measures to outcomes, and report them in plain language for each audience.
Here’s the short version:
Start with scope, not data. I first decide what change the institution is trying to make.
Use shared measures. Activity counts alone do not show impact.
Link work to outcomes. Logic models, theory of change, and SDG tags help show how effort connects to results.
Build one data system. Clear ownership, shared definitions, and a regular update cycle matter.
Change the message, not the evidence. Funders, policymakers, students, faculty, and partners need different framing from the same record.
A few facts stand out:
A 2023UNC System study found 93% of degree programs had a positive student ROI.
Undergraduate degree completers were estimated to earn nearly $500,000 more over a lifetime than non-degree holders.
Partnership outcomes should be checked at 6 and 12 months, not just at launch.
A 3- to 6-month reporting cycle is often enough to keep impact data current without overloading staff.
I’d boil the article down to one working model: set a common agenda, pick shared measures, map them to outcomes, build a trusted dashboard, and tailor the story for each audience. That gives leaders, funders, and partners one version of the truth they can use.
5-Step Framework for Measuring & Communicating University Collective Impact
Overview of the Collective Impact Framework - Module #2 | National Council of Social Service
1. Define the scope of impact before choosing metrics
Start with the impact question. Then pick the metrics.
If a team skips that step, it usually ends up tracking activity counts: events held, papers published, students enrolled. Those numbers may look busy on a dashboard, but they don't answer the main issue: what change is this work meant to create? Once the scope is clear, it becomes much easier to link each activity to the mission area it serves.
Set a common agenda across teaching, research, operations, and engagement
A shared impact statement gives each unit one point of reference. Without it, teams drift toward their own scorecards, and the institution produces siloed reports instead of one clear story.
A good place to start is classifying the initiative as either technology transfer and regional economic value or sustainability, social innovation, and community well-being [4]. That choice shapes which metrics make sense. Just as important, the scope should be checked with the people who will use the data, not set in isolation.
In May 2026, UNC Greensboro (UNCG) aligned its community engagement data with the 17 United Nations Sustainable Development Goals. That SDG tagging helped turn engagement data into something leaders could use, and as the UNCG case study noted:
"SDG tagging turns engagement data into strategic insight, not only documenting breadth, but clarifying purpose and collective direction." [1]
UNCG became the second institution in the United States to track SDGs in this way, giving campus leadership a clearer view of where effort was concentrated and where gaps remained across mission areas [1].
Identify the stakeholders who shape and use the measurement system
The people who will use the system should help shape it. If they don't, the system can miss the mark.
As Susana Campbell, Provost Associate Professor at American University, put it:
"It is useless to have more data without a clear decision-making structure that [the data are] going into." [2]
Before locking in the measurement system, map users to the role each group plays:
Stakeholder Group | Primary Role |
|---|---|
Campus Leadership | Sets the common agenda and allocates resources |
Institutional Research | Manages data governance and dashboard reporting |
Faculty & Students | Implements co-creation, research, and service-learning |
Community Partners | Defines relevant outcomes and validates cultural fit |
Policymakers & Funders | Sets accountability standards and uses data for decisions |
Bring these users in before data collection begins. In 2022, the Indiana University Indianapolis Office of Community Engagement ran partner interviews with 11 community partners and 8 faculty and staff members to test its partner survey. That process led to a measurement tool that tracked outcomes across eight themes, including health disparities and community safety. The survey became more useful for both reporting and decision-making [7].
With scope and users in place, the next move is choosing shared metrics.
2. Select shared metrics and align them to recognized frameworks
Once the scope is set, the next move is to choose the metrics that will guide decisions. Keep the set small and balanced. You want indicators that help leaders manage the work and help outside audiences see what matters. Every metric should tie back to the shared impact statement from Step 1, not to what happens to be easy for one unit to count.
Choose a balanced set of indicators for each mission area
Each mission area needs its own indicators, but all of them should connect to the same shared impact statement. For teaching and learning, that means looking past enrollment counts alone. Focus on outcomes such as student return on investment and workforce alignment. Those measures say more about whether the institution is doing its job in ways that matter to students, families, and state leaders.
A 2023 study of the University of North Carolina System found that 93% of degree programs had a positive return on investment for students, and undergraduate degree completers are estimated to earn nearly $500,000 more over their lifetime than non-degree holders [2]. That kind of metric lands with policymakers and prospective students because it speaks in plain terms about long-term payoff.
For research and engagement, measure changes in knowledge, behavior, policy, or quality of life. For campus operations, use standard categories such as energy efficiency, greenhouse gas emissions, waste management, and sustainable procurement. These categories map cleanly to outside frameworks and make year-over-year comparison easier.
Partnership depth needs a stricter test. Don’t just record that a partnership exists. Track whether community partners helped define the outcomes in the first place. Then check outcomes at 6 and 12 months to see whether the results hold up over time [8].
These metrics only help if each one is tied to a clear outcome and a clear reporting use.
Use STARS, THE Impact Rankings, Carnegie, and internal metrics together
No single framework does the whole job. The better approach is to use them together, with the SDGs as the common thread. Build one metric set, then reuse it across STARS, THE Impact Rankings, Carnegie, and internal reporting. That cuts duplicate work and keeps the story straight.
At UNC Greensboro, for example, engagement data in its Collaboratory platform was linked to specific SDGs. That connection helped bridge STARS reporting with community-engaged research without duplicate data entry [1].
Use each framework for what it does best, then connect the pieces through SDG tags.
Framework | Strengths | Limitations | Best use |
|---|---|---|---|
Standardized, transparent sustainability tracking | Focused on internal campus sustainability; can be data-intensive | Operations, administration, teaching, research | |
THE Impact Rankings | Global benchmarking; aligns directly with all 17 UN SDGs | Self-reported data; may favor larger institutions | SDG-oriented institutional performance |
Validates institutional commitment and partnership reciprocity | Documentation-heavy; qualitative focus limits direct numerical comparison | Mission, leadership, faculty/student involvement, community voice | |
Internal Metrics | Tailored to local priorities and regional workforce needs | Lacks external comparability and may need framework alignment for broader credibility | Local ROI, workforce alignment, specific community outcomes |
A simple way to keep this clean is to:
Assign each metric to one primary framework
Note any secondary use across other frameworks
Tag projects to both SDGs and reporting categories where it makes sense
Name one owner for collection, validation, and reporting
A single outreach project, for instance, can be tagged to both an SDG and a STARS credit, which helps cut duplicate data entry [1][8].
Once the metric set is fixed, map each indicator to the outcomes it is meant to influence.
3. Use logic models, theory of change, and SDG mapping to connect activities to outcomes
Shared metrics only matter if they sit inside a clear model of change. The tougher question is simple: what actually caused the result? That’s where logic models and theory of change frameworks come in. A logic model links inputs to activities, outputs, outcomes, and impact. A theory of change starts with the impact you want, then spells out the conditions needed to get there. Used together, they help institutions pick indicators at each stage and stay honest about what they can reasonably claim [6]. A logic model makes that pathway easy to see.
One idea that belongs in either framework is the boundary of attribution - the point where you can no longer take direct credit for a result. Being clear about that line makes impact claims more believable, not weaker [6].
Once the metrics are in place, logic models show how those metrics connect to change on the ground.
Build a logic model for a cross-campus or partnership initiative
A concrete example helps clear up the difference between outputs and outcomes.
Take a sustainable irrigation partnership. It might use faculty expertise, student volunteers, and grant funding as inputs; training workshops as the activity; farmer adoption as the outcome; and regional drought resilience as the impact [8].
Outputs are what you delivered. Outcomes are what changed because of it.
Map programs and results to the Sustainable Development Goals
After the logic model is built, SDG mapping gives it a shared language that outside audiences already know. Tag parts of the model to SDG targets, not just goal numbers, so readers can see where work is concentrated and where gaps still exist [1] [8].
UNC Greensboro used this method in its Collaboratory platform to tag community-engaged activity to SDG targets and show how partnerships linked to broader sustainability priorities [1].
Logic Model Element | University Example | Relevant SDG Target |
|---|---|---|
Input | Faculty expertise, student volunteers, and grant funding | N/A |
Activity | Technical training workshops for local smallholder farmers | N/A |
Output | 150 farmers trained in sustainable irrigation techniques | Target 2.4: Sustainable food production systems |
Outcome | 30% reduction in agricultural water use among participants over 12 months | Target 6.4: Increase water-use efficiency |
Impact | Improved regional drought resilience and food security | SDG 2 & SDG 6 |
When you describe SDG results, frame them as contributions, not sole credit. Broad social outcomes happen for many reasons. Positioning your institution as one meaningful contributor keeps claims honest and defensible [6].
Use the logic model and SDG tags to shape dashboard fields, reporting rules, and audience-specific reporting. Once the model is set, it becomes the blueprint for what the dashboard should track and how each audience should read it.
4. Build an integrated data system and dashboard that stakeholders can trust
A data system turns a logic model into steady, institution-wide evidence. It gives people one place to look, one set of rules to follow, and one shared view of progress. That structure also helps you settle the practical stuff early: who owns each metric, when data gets updated, and how people are expected to read the dashboard.
Set up data governance, roles, and reporting rules
Start with ownership. Every metric needs a named owner who is responsible for keeping it current and accurate. In many schools and universities, two roles work well together: data leads, who tie data back to institutional priorities, and messaging leads, who shape how that evidence is explained and shared [9].
Ownership alone isn’t enough. Shared definitions matter just as much. If separate offices count the same activity in different ways, the numbers won’t line up. Before you pull data together, define each indicator, set its baseline, and agree on its update cadence. For collective impact indicators, a 3- to 6-month reporting cycle often works well. It’s frequent enough to spot movement, but not so frequent that staff get buried in reporting [3].
A useful dashboard does more than display numbers. It should connect each metric to goals, short narrative notes, risks, and a review cadence. Before any report goes out, check for stale data and use plain status labels like on track, off track, and at risk. Add short evidence notes that explain what changed, what risks are in play, and what kind of support leadership may need to provide [10].
"We finally have one record of what we said we'd do, what we're doing, and what we've achieved." - Lori Borden, Chief of Staff [10]
Choose the right dashboard approach for your institution's scale
Once governance is in place, the dashboard can give units and audiences one consistent view. That doesn’t mean every institution needs a custom platform right away. In practice, the best option depends on a few simple questions: How many data sources need to come together? Who needs access? Is the dashboard meant for internal management, public communication, or both?
Dashboard Approach | Scalability | Transparency | Usability | Best For |
|---|---|---|---|---|
Spreadsheets | Low; difficult to maintain across large institutions | Low; prone to version control issues and stale data | High for individuals; low for teams | Small-scale pilot projects or single-unit tracking |
Institutional Data Warehouses (BI) | High; handles data from IR, HR, and Finance | High; provides a single source of truth | Moderate; shows what happened but rarely why | Compliance reporting and high-level institutional oversight |
Custom/Specialized Dashboards | High; can integrate via APIs across platforms | Very high; supports public-facing impact stories | High; designed for non-technical stakeholders | Collective impact reporting and stakeholder engagement |
The dashboard should track outcomes, not just activity counts, if it’s going to stay tied to collective impact goals. That’s where many institutions slip up: they count effort but miss results. UNCG offers a good example of the stronger approach. Its SDG-linked data shows concentrations of effort, gaps, and public impact in one view [1].
When that shared evidence base is in place, audience-specific reporting gets a lot easier. Funders, students, faculty, and policymakers may need different framing, but they can all work from the same underlying record.
5. Communicate results clearly to funders, policymakers, students, faculty, and partners
Once a trusted dashboard is in place, the last step is simple in theory and easy to miss in practice: translate the evidence for each audience. The evidence itself should stay the same. What changes is the framing.
That shared evidence base should cover teaching, research, operations, and engagement, using the same metric families built in earlier steps. This matters because it keeps everyone working from one record instead of a different version of the story for each group.
Tailor the message to each audience without changing the evidence
Use the same proof, but lead with what each audience cares about most. Draw from the student outcomes, research outcomes, sustainability outcomes, and partnership outcomes already built into the measurement system.
Stakeholder | What to Lead With |
|---|---|
Funders | Outcomes achieved, leverage created, grant portfolio impact |
Policymakers | Public value, regional effects, and state-level ROI |
Students | Career satisfaction, economic security, and lifetime earnings |
Faculty | Participation, learning outcomes, and institutional incentives |
Community Partners | Shared benefits, trust, and reciprocity in goal-setting |
One move that tends to strengthen almost any stakeholder narrative is the counterfactual: say what likely would not have happened without the collaboration [2]. That shifts the story from a rundown of activities to a clear case for continued support.
It also helps to pair quantitative data with short qualitative stories. UNC Greensboro offers a strong model. In 2024, the university published Volume 4 of its Excellence in Community Engagement & Community-Engaged Scholarship series, blending data on engagement trends with specific partnership stories like "A Community Comes Together", which supports Congolese refugees. That kind of data-backed storytelling makes the numbers easier to remember and easier to use [5].
"SDG tagging turns engagement data into strategic insight, not only documenting breadth, but clarifying purpose and collective direction." - UNCG Use Case Report [1]
The same evidence can then be reused across briefs, slide decks, public summaries, and partner reports. The record stays fixed; the emphasis shifts based on who is reading it.
Conclusion: A practical model for credible and useful impact reporting
When institutions keep one shared evidence base and explain it clearly for each audience, collective impact reporting becomes more credible, more usable, and more strategic.
FAQs
How do we choose one campus-wide impact goal?
Use a bottom-up approach that brings people in from across the institution. That’s how you build trust, legitimacy, and buy-in from the start. A working group can help here. Pull together people from academics, communications, and financial leadership to weigh the costs, benefits, and feasibility of possible metrics.
Instead of setting a goal from the top and hoping it sticks, look for shared priorities across campus and the community. The best goals usually come from overlap: what the institution cares about, what partners need, and what people can support in practice. Tools like theory of change frameworks or SDG mapping can help connect the goal to broader outcomes and partner priorities.
What metrics best show outcomes, not just activity?
Focus on metrics that show what changed, not just what took place. It’s easy to count workshops, attendees, or events. That tells you about activity, but not much about impact. The better test is whether people changed their behavior, whether systems shifted, and whether conditions on the ground improved.
That might mean tracking the adoption of new practices, gains in sustainable behavior, or whether environmental projects are still active months or years later. Those signals get closer to the point: did the work stick?
Use longitudinal tracking and community-centered indicators to see impact over time, in the places where it matters. Numbers help, but they don’t tell the whole story. Pair quantitative data with narrative self-evaluations so people can explain what changed, what got in the way, and what the data alone might miss.
How can we build a trusted impact dashboard with limited staff?
Prioritize clarity and user-centered design. Don’t turn the dashboard into a bloated mission control center. Start small, build in rounds, and bring stakeholders in early so everyone agrees on what the dashboard is for and how it should be used.
Trust comes from being open about what the data can show - and what it can’t. Say where the gaps are. Flag assumptions. Be clear about timing, coverage, and blind spots. Numbers matter, but they rarely tell the whole story on their own. Pair quantitative data with qualitative narratives so people can see both the metrics and the human context behind them.
Frameworks like the SDGs can also help. They give teams a shared language for mapping, visualizing, and talking about connected impact across social, economic, and planetary outcomes.
Related Blog Posts
FAQ
What does it really mean to “redefine profit”?
What makes Council Fire different?
Who does Council Fire you work with?
What does working with Council Fire actually look like?
How does Council Fire help organizations turn big goals into action?
How does Council Fire define and measure success?