
Jun 28, 2026
How to Measure and Communicate Collective Impact for Foundations & Philanthropic Organizations
Capacity Building
In This Article
Practical guide for foundations to set shared outcomes, use common metrics, govern data, and report collaborative contribution.
How to Measure and Communicate Collective Impact for Foundations & Philanthropic Organizations
If you fund many groups toward one goal, you need one shared way to define success. That is the core idea. Collective impact reporting works when I set shared outcomes first, limit the number of common measures, build clear data rules, and report results in ways that each audience can use.
In the U.S., philanthropic collaboratives direct $4 billion to $7 billion each year, and almost 70% say measurement and learning are top priorities. But separate grant reports do not show whether the full effort is moving the needle. To do that, I need to track partner outputs, system-level change, and value for donors and communities in one clear frame.
Here’s the short version:
Start with shared outcomes, not separate grant metrics
Use a small core set of common measures across partners
Break data out by race, ethnicity, gender, and geography
Set data rules early: ownership, access, updates, privacy, and quality checks
Build simple dashboards: one view for boards and donors, another for program teams
Report contribution, not sole credit
Use a review cycle so data leads to decisions, not just year-end summaries
A few reporting formats tend to work best:
Board briefs for mission fit, risk, and drift
Donor summaries for system-level progress
Grantee reports for learning and feedback
Community updates in plain language with stories and visuals
When I keep the system shared, clear, and easy to use, measurement becomes less about paperwork and more about helping the collaborative stay aligned and improve over time.
Build a shared outcomes and measurement framework
Choose shared outcomes before choosing metrics
Once partners agree on shared outcomes, the next job is to turn those outcomes into a measurement system people can actually use across partners, programs, and funding streams. In plain terms: set the outcomes first, then build the shared measurement plan around them.
Getting there takes structured facilitation, not just good intentions. In Seattle and South King County, partners worked through repeated meetings with hundreds of stakeholders before they locked in common goals and measures.[1] That kind of process usually needs a backbone organization to keep things moving. A backbone group can offer neutral facilitation, training, and data review so partners with different priorities can still reach agreement.[1] The outcomes also need to come from broad field input, not just a few voices in the room.
Define common metrics that work across grants
After shared outcomes are in place, the next step is agreeing on a small set of measures that every partner will track the same way. The aim is simple: create a shared view of progress without wiping out local context.
Some collaboratives use a small core set of standard measures. Others combine shared metrics with grantee-specific milestones.[2] That balance often works better than trying to force every grant into one rigid mold.
"A shared measurement system is only a means to an end, not an end in itself. Too often, new collective impact initiatives focus on creating the mythical, all-knowing data system... they let the perfect become the enemy of the good." - Justin Piff, Vice President, Equal Measure [3]
Data should also be broken out by race, ethnicity, gender, and geography. Big topline numbers can look fine while hiding deep gaps underneath. The Hartford Data Collaborative in Connecticut showed why this matters when it matched program data with Hartford Public Schools and National Student Clearinghouse records. That work exposed postsecondary enrollment gaps by gender, race, and ethnicity that aggregate reporting had hidden.[3]
Some foundations go a step further and track grantee traits, including lived-experience leadership and DEI policies, to see whether the portfolio lines up with the mission.[2]
Use logic models and impact dimensions to organize evidence
A shared logic model gives the collaborative one map for the work. Inputs lead to activities, activities produce outputs, outputs lead to outcomes, and outcomes support long-term impact. When each partner's work sits on that same map, boards and donors can see how single programs connect to the larger goal. That makes the logic model a reporting tool as well as an evaluation tool.
Use the model to show how measures link to near-term progress and longer-range systems change. Quantitative data shows what changed. Qualitative evidence helps explain why it changed.[3]
That same structure also lays the groundwork for data-sharing and dashboard design.
FSG's Hallie Preskill on Evaluating Collective Impact
Design data-sharing systems and dashboards that support decisions
Once partners agree on shared outcomes and metrics, the next move is simple in theory and messy in practice: make the data useful for decisions.
Set up data-sharing rules, roles, and standards
After shared outcomes are in place, partners need governance rules that let results line up across the group. That means being clear about who owns the data, who can see it, how often it is updated, and how mistakes are spotted and fixed. Privacy and confidentiality rules should be written down plainly, not left to guesswork.
A backbone organization can handle key data-governance work across the collaborative. That often includes training partners on shared definitions, running data-quality checks, and flagging inconsistencies across the portfolio. It also helps to build disaggregation for race, ethnicity, gender, and geography into the data model from day one.
These rules shape everything that comes next, from dashboards to board reports to partner review.
Build dashboards for boards and donors
A dashboard works best when it shows only what the audience needs to see. For boards and major donors, that usually means a short list of KPIs tied straight to the shared outcomes the collaborative agreed on, not a dense table that buries the point.
Keep the indicators small in number and balanced in scope. The Freedom Fund, which works to end modern slavery, uses a limited set of shared indicators across grantees, including the number of people liberated from slavery and the number of children returned to school, so it can aggregate impact across its portfolio. [2]
Use disaggregated trend lines to show whether progress is reaching the communities the collaborative set out to serve.
Program dashboards should go further. They should show short-term milestones and disaggregated data that helps teams adjust faster. Boards need the big-picture view; program teams need the day-to-day view.
Choose the right structure for collaboration-wide reporting
The last decision is how to organize reporting across the collaborative without drowning partners in admin work. The best setup depends on the number of partners involved, the level of technical capacity, and how much control each partner wants to keep over its own data.
Theory-of-change diagrams work well for showing causal links between activities and outcomes, but they are less useful for routine monitoring. The table below compares two other reporting structures by purpose and fit:
Structure | Purpose | Strengths | Limitations |
|---|---|---|---|
Strategy Maps | Align activities with goals. | Strong for board-level communication. | May lack the granular data needed for daily operations. |
Shared Dashboards | Provide real-time or periodic monitoring of common metrics. | High transparency; supports quick pivots. | Requires a large upfront investment in shared data standards. |
On the governance side, the way data moves between partners matters as much as the metrics themselves. In U.S. philanthropic collaboratives, three models show up most often:
Model | Governance Requirements | Technical Complexity | Best Fit |
|---|---|---|---|
Centralized (Backbone-Managed) | High; backbone controls standards and quality. | High for the backbone; low for partners. | Large-scale initiatives with a strong, well-funded backbone organization. |
Federated Data-Sharing | Moderate; requires alignment on shared standards. | Moderate; data stays with partners but is linked. | Collaboratives with high-capacity partners who want to maintain data ownership. |
Peer-to-Peer Agreements | Low; based on individual MOUs. | Low; manual or simple digital transfers. | Small, emerging collaboratives or pilot projects with few partners. |
Start with the simplest model that meets the reporting need, then add more structure as capacity grows.
Communicate results to boards, donors, grantees, and communities
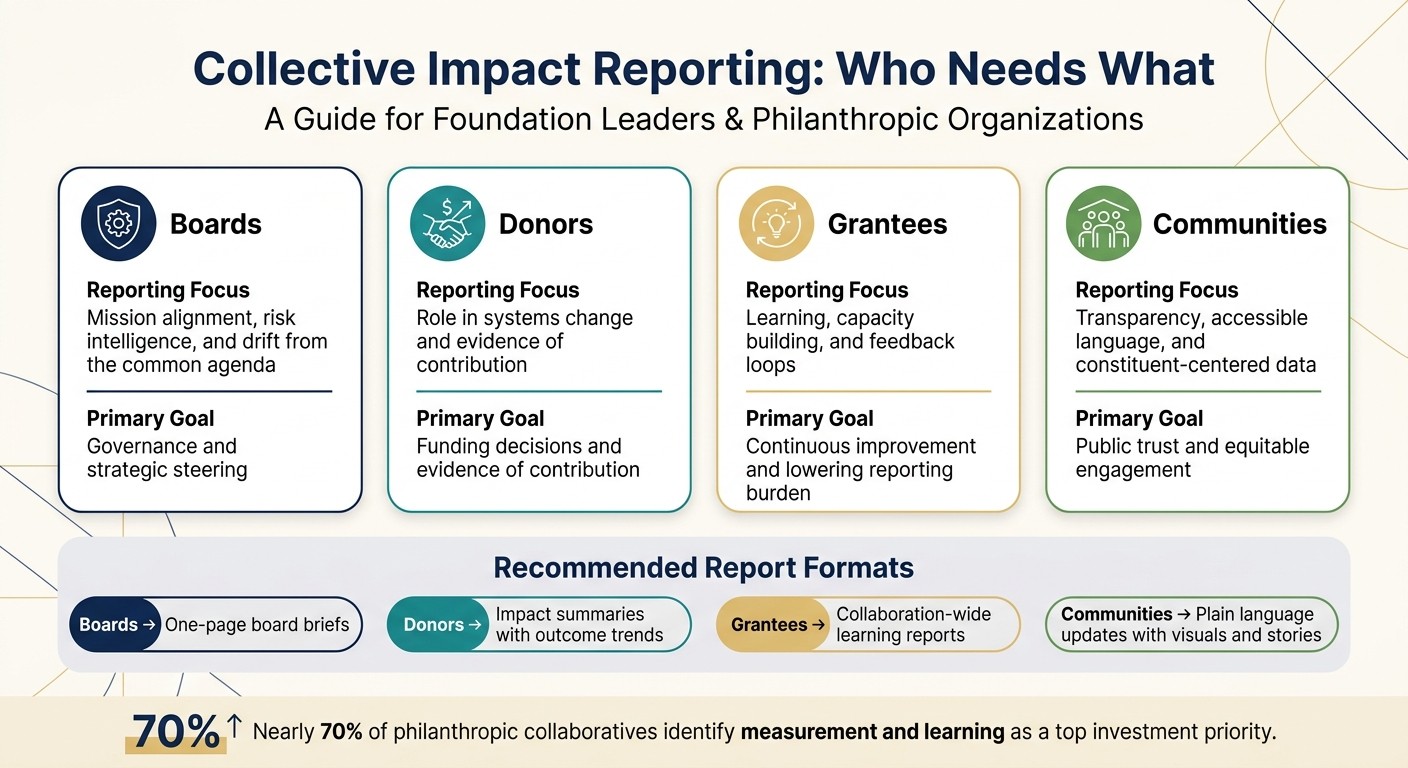
Collective Impact Reporting: Stakeholder Communication Framework for Foundations
Different stakeholders need different versions of the same results. The outcomes may be shared, but the framing should change based on who’s reading. Boards, donors, grantees, and communities each look at the work through a different lens. Use the shared outcomes and dashboard data from your measurement system to shape reports each group can act on.
Tailor the message to each stakeholder group
Each audience has a different relationship to the work, so reporting should match that reality.
Stakeholder Group | Reporting Focus | Primary Goal |
|---|---|---|
Boards | Mission alignment, risk intelligence, and drift from the common agenda | Governance and strategic steering |
Donors | Role in systems change and evidence of contribution | Funding decisions and evidence of contribution |
Grantees | Learning, capacity building, and feedback loops | Continuous improvement and lowering reporting burden |
Communities | Transparency, accessible language, and constituent-centered data | Public trust and equitable engagement |
Board reporting should flag drift from the common agenda early, not just at year-end. Boards need shared data they can use to make governance calls and adjust strategy before misalignment snowballs.
"A year-end roll-up is a reconciliation. It discovers the misalignment after the year it describes - too late to steer the common agenda." - Unmesh Sheth, Founder & CEO, Sopact [6]
For donors, the main issue is simple: is the collaborative producing results that no single grant could produce on its own? Reports should focus on contribution to system-level outcomes, not just a tally of people served. [5]
Grantee reporting works better when it leans toward learning instead of compliance. The African Visionary Fund cut required documents and simplified criteria after hearing directly from grantees. [2] That same approach should shape narrative reporting too. Show contribution, not credit.
For community stakeholders, plain language matters. So do constituent-centered practices. If people can’t understand the report, it won’t build trust.
Pair data with stories without overclaiming results
Numbers show patterns. Stories show what those patterns mean in people’s lives.
The Hartford Data Collaborative in Connecticut matched program data against Hartford Public Schools and National Student Clearinghouse records, then broke out results by gender, race, and ethnicity. That mix of data helped several community agencies spot and address service gaps that overall totals had missed. [3]
Be careful not to claim attribution you can’t prove. In collective impact work, the aim is not isolated attribution. It’s shared contribution to a common outcome. That means shifting the language. Instead of saying, our grants produced this result, say, our collaborative contributed to this shift alongside partners working on X and Y. [5]
Use reporting formats that make action easier
The format matters almost as much as the message. A board packet doesn’t need the same shape as a community update.
A few formats tend to work well:
One-page board briefs focused on mission alignment and risk
Donor-ready impact summaries that pair a small set of outcome trends with system-level progress
Collaboration-wide reports that bring system change and outcome trends into one view
Community-facing updates that use plain language, visuals, and stories grounded in lived experience
The Aspen Institute Opportunity Youth Forum shows this split-screen approach well. Its annual grantee reports ask collaboratives to share both systems-change progress, such as new policies and funding shifts, and youth-level education and workforce outcomes in the same document. [3] That kind of format helps turn reporting into the next learning and review cycle, instead of a stack of papers nobody uses.
Governance, continuous learning, and conclusion
Create a review cycle for learning and adaptation
Once dashboards and reporting formats are in place, the next move is simple: set a review rhythm that turns data into decisions. A backbone organization should lead that rhythm, check the data, and keep partners on the same page about what the numbers mean. [1] Before measures are locked in, use an iterative process with partners to test and refine them.
Review a small group of metrics on a fixed schedule and keep coming back to two plain questions: what is working, and what needs to change? That steady rhythm helps the collaborative stay focused on action instead of reporting for reporting's sake.
Each review cycle should also break out results by race, ethnicity, and gender. That makes uneven progress easier to spot and harder to ignore.
How Council Fire can help operationalize collective impact measurement
This is the point where support matters most: turning a measurement plan into a system people can actually use. Council Fire helps foundations build shared metrics, data governance, dashboards, and reporting routines that support learning and decision-making.
Key takeaways for foundation leaders
For foundation leaders, the goal is practical: build a measurement routine that is simple, shared, and usable. Nearly 70% of philanthropic collaboratives surveyed in 2022 identified building measurement, evaluation, and learning capabilities as a critical investment priority. [4] Getting there takes discipline.
Start with shared outcomes, not metrics. Teams need agreement on what success looks like before they decide how to count it.
Define common metrics that work across grantees, and keep the list short enough to guide action.
Use logic models and dashboards together so the theory of change stays tied to live data.
Build strong data governance with clear roles, confidentiality standards, and equity-centered disaggregation in place from day one.
Tailor every report to its audience and treat measurement as a learning cycle. Boards need governance signals. Donors need evidence of contribution. Grantees need feedback loops. Communities need plain language. Review the work, adjust, and improve as it evolves.
"Continuous learning is essential to [collective impact] success." - Hallie Preskill, Senior Advisor, FSG [7]
FAQs
How do we choose shared outcomes across many partners?
Start with a clear strategy for what the collective is trying to do. Then bring partners together to define success in plain terms. That process should include residents, nonprofit leaders, and government officials so people feel heard and are more likely to support the work.
Use open, repeat discussions to shape shared measures over time. Put equity at the center by breaking data into groups, spotting service gaps, and tracking population-level results instead of focusing on the impact of single organizations.
What metrics should every grantee report?
Every grantee should report metrics tied to the initiative’s shared goals. That doesn’t mean every organization needs to submit the exact same data. What matters is a set of common indicators that partners agree on before data collection starts.
In most cases, those indicators include mission-aligned outcomes, progress toward population-level goals, and participant demographics such as race, gender, and geography for equity analysis. To keep reporting lighter and reduce confusion, use standardized forms and consistent definitions.
How can we show collective impact without overclaiming credit?
Keep the focus on the initiative’s overall progress toward shared, population-level outcomes, not on any one organization’s performance. A theory of change can help make that clear. It shows how your activities, alongside the work of other partners, connect to larger system goals.
Measure impact at the field or systems level, and be open about the fact that these results come from joint effort. Put the shared agenda at the center, rather than spotlighting any single participant’s accomplishments.
Related Blog Posts
How to Integrate ESG into Core Business Operations for Foundations & Philanthropic Organizations
How to Measure and Communicate Collective Impact for Municipalities & Government Agencies
How to Measure and Communicate Collective Impact for Corporations
How to Measure and Communicate Collective Impact for NGOs & Nonprofits
Latest Articles
©2025

Narrative Change and Power Building: The Missing Half of Advocacy
Narrative change is the process of disrupting dominant narratives that normalize inequity and advancing new narratives from historically marginalized communities.

Funding Resilience Without Federal Grants
BRIC is unreliable and FEMA is shrinking. Here's how cities fund climate resilience with dedicated revenue, blended finance, and a coordinating authority.

The ESG Blind Spot: How AI Is Finding Risks in Companies Nobody Else Is Watching
Norway's sovereign wealth fund uses AI to screen 7,200 portfolio companies for forced labor and corruption within 24 hours. The real story is the emerging-market coverage gap that traditional ESG data vendors miss — and what it means for any company with a global supply chain.
Narrative Change and Power Building: The Missing Half of Advocacy
Narrative change is the process of disrupting dominant narratives that normalize inequity and advancing new narratives from historically marginalized communities.
Funding Resilience Without Federal Grants
BRIC is unreliable and FEMA is shrinking. Here's how cities fund climate resilience with dedicated revenue, blended finance, and a coordinating authority.
The ESG Blind Spot: How AI Is Finding Risks in Companies Nobody Else Is Watching
Norway's sovereign wealth fund uses AI to screen 7,200 portfolio companies for forced labor and corruption within 24 hours. The real story is the emerging-market coverage gap that traditional ESG data vendors miss — and what it means for any company with a global supply chain.
FAQ
01
What does it really mean to “redefine profit”?
02
What makes Council Fire different?
03
Who does Council Fire work with?
04
What does working with Council Fire actually look like?
05
How does Council Fire help organizations turn big goals into action?
06
How does Council Fire define and measure success?
Jun 28, 2026
How to Measure and Communicate Collective Impact for Foundations & Philanthropic Organizations
Capacity Building
In This Article
Practical guide for foundations to set shared outcomes, use common metrics, govern data, and report collaborative contribution.
How to Measure and Communicate Collective Impact for Foundations & Philanthropic Organizations
If you fund many groups toward one goal, you need one shared way to define success. That is the core idea. Collective impact reporting works when I set shared outcomes first, limit the number of common measures, build clear data rules, and report results in ways that each audience can use.
In the U.S., philanthropic collaboratives direct $4 billion to $7 billion each year, and almost 70% say measurement and learning are top priorities. But separate grant reports do not show whether the full effort is moving the needle. To do that, I need to track partner outputs, system-level change, and value for donors and communities in one clear frame.
Here’s the short version:
Start with shared outcomes, not separate grant metrics
Use a small core set of common measures across partners
Break data out by race, ethnicity, gender, and geography
Set data rules early: ownership, access, updates, privacy, and quality checks
Build simple dashboards: one view for boards and donors, another for program teams
Report contribution, not sole credit
Use a review cycle so data leads to decisions, not just year-end summaries
A few reporting formats tend to work best:
Board briefs for mission fit, risk, and drift
Donor summaries for system-level progress
Grantee reports for learning and feedback
Community updates in plain language with stories and visuals
When I keep the system shared, clear, and easy to use, measurement becomes less about paperwork and more about helping the collaborative stay aligned and improve over time.
Build a shared outcomes and measurement framework
Choose shared outcomes before choosing metrics
Once partners agree on shared outcomes, the next job is to turn those outcomes into a measurement system people can actually use across partners, programs, and funding streams. In plain terms: set the outcomes first, then build the shared measurement plan around them.
Getting there takes structured facilitation, not just good intentions. In Seattle and South King County, partners worked through repeated meetings with hundreds of stakeholders before they locked in common goals and measures.[1] That kind of process usually needs a backbone organization to keep things moving. A backbone group can offer neutral facilitation, training, and data review so partners with different priorities can still reach agreement.[1] The outcomes also need to come from broad field input, not just a few voices in the room.
Define common metrics that work across grants
After shared outcomes are in place, the next step is agreeing on a small set of measures that every partner will track the same way. The aim is simple: create a shared view of progress without wiping out local context.
Some collaboratives use a small core set of standard measures. Others combine shared metrics with grantee-specific milestones.[2] That balance often works better than trying to force every grant into one rigid mold.
"A shared measurement system is only a means to an end, not an end in itself. Too often, new collective impact initiatives focus on creating the mythical, all-knowing data system... they let the perfect become the enemy of the good." - Justin Piff, Vice President, Equal Measure [3]
Data should also be broken out by race, ethnicity, gender, and geography. Big topline numbers can look fine while hiding deep gaps underneath. The Hartford Data Collaborative in Connecticut showed why this matters when it matched program data with Hartford Public Schools and National Student Clearinghouse records. That work exposed postsecondary enrollment gaps by gender, race, and ethnicity that aggregate reporting had hidden.[3]
Some foundations go a step further and track grantee traits, including lived-experience leadership and DEI policies, to see whether the portfolio lines up with the mission.[2]
Use logic models and impact dimensions to organize evidence
A shared logic model gives the collaborative one map for the work. Inputs lead to activities, activities produce outputs, outputs lead to outcomes, and outcomes support long-term impact. When each partner's work sits on that same map, boards and donors can see how single programs connect to the larger goal. That makes the logic model a reporting tool as well as an evaluation tool.
Use the model to show how measures link to near-term progress and longer-range systems change. Quantitative data shows what changed. Qualitative evidence helps explain why it changed.[3]
That same structure also lays the groundwork for data-sharing and dashboard design.
FSG's Hallie Preskill on Evaluating Collective Impact
Design data-sharing systems and dashboards that support decisions
Once partners agree on shared outcomes and metrics, the next move is simple in theory and messy in practice: make the data useful for decisions.
Set up data-sharing rules, roles, and standards
After shared outcomes are in place, partners need governance rules that let results line up across the group. That means being clear about who owns the data, who can see it, how often it is updated, and how mistakes are spotted and fixed. Privacy and confidentiality rules should be written down plainly, not left to guesswork.
A backbone organization can handle key data-governance work across the collaborative. That often includes training partners on shared definitions, running data-quality checks, and flagging inconsistencies across the portfolio. It also helps to build disaggregation for race, ethnicity, gender, and geography into the data model from day one.
These rules shape everything that comes next, from dashboards to board reports to partner review.
Build dashboards for boards and donors
A dashboard works best when it shows only what the audience needs to see. For boards and major donors, that usually means a short list of KPIs tied straight to the shared outcomes the collaborative agreed on, not a dense table that buries the point.
Keep the indicators small in number and balanced in scope. The Freedom Fund, which works to end modern slavery, uses a limited set of shared indicators across grantees, including the number of people liberated from slavery and the number of children returned to school, so it can aggregate impact across its portfolio. [2]
Use disaggregated trend lines to show whether progress is reaching the communities the collaborative set out to serve.
Program dashboards should go further. They should show short-term milestones and disaggregated data that helps teams adjust faster. Boards need the big-picture view; program teams need the day-to-day view.
Choose the right structure for collaboration-wide reporting
The last decision is how to organize reporting across the collaborative without drowning partners in admin work. The best setup depends on the number of partners involved, the level of technical capacity, and how much control each partner wants to keep over its own data.
Theory-of-change diagrams work well for showing causal links between activities and outcomes, but they are less useful for routine monitoring. The table below compares two other reporting structures by purpose and fit:
Structure | Purpose | Strengths | Limitations |
|---|---|---|---|
Strategy Maps | Align activities with goals. | Strong for board-level communication. | May lack the granular data needed for daily operations. |
Shared Dashboards | Provide real-time or periodic monitoring of common metrics. | High transparency; supports quick pivots. | Requires a large upfront investment in shared data standards. |
On the governance side, the way data moves between partners matters as much as the metrics themselves. In U.S. philanthropic collaboratives, three models show up most often:
Model | Governance Requirements | Technical Complexity | Best Fit |
|---|---|---|---|
Centralized (Backbone-Managed) | High; backbone controls standards and quality. | High for the backbone; low for partners. | Large-scale initiatives with a strong, well-funded backbone organization. |
Federated Data-Sharing | Moderate; requires alignment on shared standards. | Moderate; data stays with partners but is linked. | Collaboratives with high-capacity partners who want to maintain data ownership. |
Peer-to-Peer Agreements | Low; based on individual MOUs. | Low; manual or simple digital transfers. | Small, emerging collaboratives or pilot projects with few partners. |
Start with the simplest model that meets the reporting need, then add more structure as capacity grows.
Communicate results to boards, donors, grantees, and communities
Collective Impact Reporting: Stakeholder Communication Framework for Foundations
Different stakeholders need different versions of the same results. The outcomes may be shared, but the framing should change based on who’s reading. Boards, donors, grantees, and communities each look at the work through a different lens. Use the shared outcomes and dashboard data from your measurement system to shape reports each group can act on.
Tailor the message to each stakeholder group
Each audience has a different relationship to the work, so reporting should match that reality.
Stakeholder Group | Reporting Focus | Primary Goal |
|---|---|---|
Boards | Mission alignment, risk intelligence, and drift from the common agenda | Governance and strategic steering |
Donors | Role in systems change and evidence of contribution | Funding decisions and evidence of contribution |
Grantees | Learning, capacity building, and feedback loops | Continuous improvement and lowering reporting burden |
Communities | Transparency, accessible language, and constituent-centered data | Public trust and equitable engagement |
Board reporting should flag drift from the common agenda early, not just at year-end. Boards need shared data they can use to make governance calls and adjust strategy before misalignment snowballs.
"A year-end roll-up is a reconciliation. It discovers the misalignment after the year it describes - too late to steer the common agenda." - Unmesh Sheth, Founder & CEO, Sopact [6]
For donors, the main issue is simple: is the collaborative producing results that no single grant could produce on its own? Reports should focus on contribution to system-level outcomes, not just a tally of people served. [5]
Grantee reporting works better when it leans toward learning instead of compliance. The African Visionary Fund cut required documents and simplified criteria after hearing directly from grantees. [2] That same approach should shape narrative reporting too. Show contribution, not credit.
For community stakeholders, plain language matters. So do constituent-centered practices. If people can’t understand the report, it won’t build trust.
Pair data with stories without overclaiming results
Numbers show patterns. Stories show what those patterns mean in people’s lives.
The Hartford Data Collaborative in Connecticut matched program data against Hartford Public Schools and National Student Clearinghouse records, then broke out results by gender, race, and ethnicity. That mix of data helped several community agencies spot and address service gaps that overall totals had missed. [3]
Be careful not to claim attribution you can’t prove. In collective impact work, the aim is not isolated attribution. It’s shared contribution to a common outcome. That means shifting the language. Instead of saying, our grants produced this result, say, our collaborative contributed to this shift alongside partners working on X and Y. [5]
Use reporting formats that make action easier
The format matters almost as much as the message. A board packet doesn’t need the same shape as a community update.
A few formats tend to work well:
One-page board briefs focused on mission alignment and risk
Donor-ready impact summaries that pair a small set of outcome trends with system-level progress
Collaboration-wide reports that bring system change and outcome trends into one view
Community-facing updates that use plain language, visuals, and stories grounded in lived experience
The Aspen Institute Opportunity Youth Forum shows this split-screen approach well. Its annual grantee reports ask collaboratives to share both systems-change progress, such as new policies and funding shifts, and youth-level education and workforce outcomes in the same document. [3] That kind of format helps turn reporting into the next learning and review cycle, instead of a stack of papers nobody uses.
Governance, continuous learning, and conclusion
Create a review cycle for learning and adaptation
Once dashboards and reporting formats are in place, the next move is simple: set a review rhythm that turns data into decisions. A backbone organization should lead that rhythm, check the data, and keep partners on the same page about what the numbers mean. [1] Before measures are locked in, use an iterative process with partners to test and refine them.
Review a small group of metrics on a fixed schedule and keep coming back to two plain questions: what is working, and what needs to change? That steady rhythm helps the collaborative stay focused on action instead of reporting for reporting's sake.
Each review cycle should also break out results by race, ethnicity, and gender. That makes uneven progress easier to spot and harder to ignore.
How Council Fire can help operationalize collective impact measurement
This is the point where support matters most: turning a measurement plan into a system people can actually use. Council Fire helps foundations build shared metrics, data governance, dashboards, and reporting routines that support learning and decision-making.
Key takeaways for foundation leaders
For foundation leaders, the goal is practical: build a measurement routine that is simple, shared, and usable. Nearly 70% of philanthropic collaboratives surveyed in 2022 identified building measurement, evaluation, and learning capabilities as a critical investment priority. [4] Getting there takes discipline.
Start with shared outcomes, not metrics. Teams need agreement on what success looks like before they decide how to count it.
Define common metrics that work across grantees, and keep the list short enough to guide action.
Use logic models and dashboards together so the theory of change stays tied to live data.
Build strong data governance with clear roles, confidentiality standards, and equity-centered disaggregation in place from day one.
Tailor every report to its audience and treat measurement as a learning cycle. Boards need governance signals. Donors need evidence of contribution. Grantees need feedback loops. Communities need plain language. Review the work, adjust, and improve as it evolves.
"Continuous learning is essential to [collective impact] success." - Hallie Preskill, Senior Advisor, FSG [7]
FAQs
How do we choose shared outcomes across many partners?
Start with a clear strategy for what the collective is trying to do. Then bring partners together to define success in plain terms. That process should include residents, nonprofit leaders, and government officials so people feel heard and are more likely to support the work.
Use open, repeat discussions to shape shared measures over time. Put equity at the center by breaking data into groups, spotting service gaps, and tracking population-level results instead of focusing on the impact of single organizations.
What metrics should every grantee report?
Every grantee should report metrics tied to the initiative’s shared goals. That doesn’t mean every organization needs to submit the exact same data. What matters is a set of common indicators that partners agree on before data collection starts.
In most cases, those indicators include mission-aligned outcomes, progress toward population-level goals, and participant demographics such as race, gender, and geography for equity analysis. To keep reporting lighter and reduce confusion, use standardized forms and consistent definitions.
How can we show collective impact without overclaiming credit?
Keep the focus on the initiative’s overall progress toward shared, population-level outcomes, not on any one organization’s performance. A theory of change can help make that clear. It shows how your activities, alongside the work of other partners, connect to larger system goals.
Measure impact at the field or systems level, and be open about the fact that these results come from joint effort. Put the shared agenda at the center, rather than spotlighting any single participant’s accomplishments.
Related Blog Posts
How to Integrate ESG into Core Business Operations for Foundations & Philanthropic Organizations
How to Measure and Communicate Collective Impact for Municipalities & Government Agencies
How to Measure and Communicate Collective Impact for Corporations
How to Measure and Communicate Collective Impact for NGOs & Nonprofits
Latest Articles
©2025
Narrative Change and Power Building: The Missing Half of Advocacy
Narrative change is the process of disrupting dominant narratives that normalize inequity and advancing new narratives from historically marginalized communities.
Funding Resilience Without Federal Grants
BRIC is unreliable and FEMA is shrinking. Here's how cities fund climate resilience with dedicated revenue, blended finance, and a coordinating authority.
The ESG Blind Spot: How AI Is Finding Risks in Companies Nobody Else Is Watching
Norway's sovereign wealth fund uses AI to screen 7,200 portfolio companies for forced labor and corruption within 24 hours. The real story is the emerging-market coverage gap that traditional ESG data vendors miss — and what it means for any company with a global supply chain.
FAQ
01
What does it really mean to “redefine profit”?
02
What makes Council Fire different?
03
Who does Council Fire work with?
04
What does working with Council Fire actually look like?
05
How does Council Fire help organizations turn big goals into action?
06
How does Council Fire define and measure success?
Jun 28, 2026
How to Measure and Communicate Collective Impact for Foundations & Philanthropic Organizations
Capacity Building
In This Article
Practical guide for foundations to set shared outcomes, use common metrics, govern data, and report collaborative contribution.
How to Measure and Communicate Collective Impact for Foundations & Philanthropic Organizations
If you fund many groups toward one goal, you need one shared way to define success. That is the core idea. Collective impact reporting works when I set shared outcomes first, limit the number of common measures, build clear data rules, and report results in ways that each audience can use.
In the U.S., philanthropic collaboratives direct $4 billion to $7 billion each year, and almost 70% say measurement and learning are top priorities. But separate grant reports do not show whether the full effort is moving the needle. To do that, I need to track partner outputs, system-level change, and value for donors and communities in one clear frame.
Here’s the short version:
Start with shared outcomes, not separate grant metrics
Use a small core set of common measures across partners
Break data out by race, ethnicity, gender, and geography
Set data rules early: ownership, access, updates, privacy, and quality checks
Build simple dashboards: one view for boards and donors, another for program teams
Report contribution, not sole credit
Use a review cycle so data leads to decisions, not just year-end summaries
A few reporting formats tend to work best:
Board briefs for mission fit, risk, and drift
Donor summaries for system-level progress
Grantee reports for learning and feedback
Community updates in plain language with stories and visuals
When I keep the system shared, clear, and easy to use, measurement becomes less about paperwork and more about helping the collaborative stay aligned and improve over time.
Build a shared outcomes and measurement framework
Choose shared outcomes before choosing metrics
Once partners agree on shared outcomes, the next job is to turn those outcomes into a measurement system people can actually use across partners, programs, and funding streams. In plain terms: set the outcomes first, then build the shared measurement plan around them.
Getting there takes structured facilitation, not just good intentions. In Seattle and South King County, partners worked through repeated meetings with hundreds of stakeholders before they locked in common goals and measures.[1] That kind of process usually needs a backbone organization to keep things moving. A backbone group can offer neutral facilitation, training, and data review so partners with different priorities can still reach agreement.[1] The outcomes also need to come from broad field input, not just a few voices in the room.
Define common metrics that work across grants
After shared outcomes are in place, the next step is agreeing on a small set of measures that every partner will track the same way. The aim is simple: create a shared view of progress without wiping out local context.
Some collaboratives use a small core set of standard measures. Others combine shared metrics with grantee-specific milestones.[2] That balance often works better than trying to force every grant into one rigid mold.
"A shared measurement system is only a means to an end, not an end in itself. Too often, new collective impact initiatives focus on creating the mythical, all-knowing data system... they let the perfect become the enemy of the good." - Justin Piff, Vice President, Equal Measure [3]
Data should also be broken out by race, ethnicity, gender, and geography. Big topline numbers can look fine while hiding deep gaps underneath. The Hartford Data Collaborative in Connecticut showed why this matters when it matched program data with Hartford Public Schools and National Student Clearinghouse records. That work exposed postsecondary enrollment gaps by gender, race, and ethnicity that aggregate reporting had hidden.[3]
Some foundations go a step further and track grantee traits, including lived-experience leadership and DEI policies, to see whether the portfolio lines up with the mission.[2]
Use logic models and impact dimensions to organize evidence
A shared logic model gives the collaborative one map for the work. Inputs lead to activities, activities produce outputs, outputs lead to outcomes, and outcomes support long-term impact. When each partner's work sits on that same map, boards and donors can see how single programs connect to the larger goal. That makes the logic model a reporting tool as well as an evaluation tool.
Use the model to show how measures link to near-term progress and longer-range systems change. Quantitative data shows what changed. Qualitative evidence helps explain why it changed.[3]
That same structure also lays the groundwork for data-sharing and dashboard design.
FSG's Hallie Preskill on Evaluating Collective Impact
Design data-sharing systems and dashboards that support decisions
Once partners agree on shared outcomes and metrics, the next move is simple in theory and messy in practice: make the data useful for decisions.
Set up data-sharing rules, roles, and standards
After shared outcomes are in place, partners need governance rules that let results line up across the group. That means being clear about who owns the data, who can see it, how often it is updated, and how mistakes are spotted and fixed. Privacy and confidentiality rules should be written down plainly, not left to guesswork.
A backbone organization can handle key data-governance work across the collaborative. That often includes training partners on shared definitions, running data-quality checks, and flagging inconsistencies across the portfolio. It also helps to build disaggregation for race, ethnicity, gender, and geography into the data model from day one.
These rules shape everything that comes next, from dashboards to board reports to partner review.
Build dashboards for boards and donors
A dashboard works best when it shows only what the audience needs to see. For boards and major donors, that usually means a short list of KPIs tied straight to the shared outcomes the collaborative agreed on, not a dense table that buries the point.
Keep the indicators small in number and balanced in scope. The Freedom Fund, which works to end modern slavery, uses a limited set of shared indicators across grantees, including the number of people liberated from slavery and the number of children returned to school, so it can aggregate impact across its portfolio. [2]
Use disaggregated trend lines to show whether progress is reaching the communities the collaborative set out to serve.
Program dashboards should go further. They should show short-term milestones and disaggregated data that helps teams adjust faster. Boards need the big-picture view; program teams need the day-to-day view.
Choose the right structure for collaboration-wide reporting
The last decision is how to organize reporting across the collaborative without drowning partners in admin work. The best setup depends on the number of partners involved, the level of technical capacity, and how much control each partner wants to keep over its own data.
Theory-of-change diagrams work well for showing causal links between activities and outcomes, but they are less useful for routine monitoring. The table below compares two other reporting structures by purpose and fit:
Structure | Purpose | Strengths | Limitations |
|---|---|---|---|
Strategy Maps | Align activities with goals. | Strong for board-level communication. | May lack the granular data needed for daily operations. |
Shared Dashboards | Provide real-time or periodic monitoring of common metrics. | High transparency; supports quick pivots. | Requires a large upfront investment in shared data standards. |
On the governance side, the way data moves between partners matters as much as the metrics themselves. In U.S. philanthropic collaboratives, three models show up most often:
Model | Governance Requirements | Technical Complexity | Best Fit |
|---|---|---|---|
Centralized (Backbone-Managed) | High; backbone controls standards and quality. | High for the backbone; low for partners. | Large-scale initiatives with a strong, well-funded backbone organization. |
Federated Data-Sharing | Moderate; requires alignment on shared standards. | Moderate; data stays with partners but is linked. | Collaboratives with high-capacity partners who want to maintain data ownership. |
Peer-to-Peer Agreements | Low; based on individual MOUs. | Low; manual or simple digital transfers. | Small, emerging collaboratives or pilot projects with few partners. |
Start with the simplest model that meets the reporting need, then add more structure as capacity grows.
Communicate results to boards, donors, grantees, and communities
Collective Impact Reporting: Stakeholder Communication Framework for Foundations
Different stakeholders need different versions of the same results. The outcomes may be shared, but the framing should change based on who’s reading. Boards, donors, grantees, and communities each look at the work through a different lens. Use the shared outcomes and dashboard data from your measurement system to shape reports each group can act on.
Tailor the message to each stakeholder group
Each audience has a different relationship to the work, so reporting should match that reality.
Stakeholder Group | Reporting Focus | Primary Goal |
|---|---|---|
Boards | Mission alignment, risk intelligence, and drift from the common agenda | Governance and strategic steering |
Donors | Role in systems change and evidence of contribution | Funding decisions and evidence of contribution |
Grantees | Learning, capacity building, and feedback loops | Continuous improvement and lowering reporting burden |
Communities | Transparency, accessible language, and constituent-centered data | Public trust and equitable engagement |
Board reporting should flag drift from the common agenda early, not just at year-end. Boards need shared data they can use to make governance calls and adjust strategy before misalignment snowballs.
"A year-end roll-up is a reconciliation. It discovers the misalignment after the year it describes - too late to steer the common agenda." - Unmesh Sheth, Founder & CEO, Sopact [6]
For donors, the main issue is simple: is the collaborative producing results that no single grant could produce on its own? Reports should focus on contribution to system-level outcomes, not just a tally of people served. [5]
Grantee reporting works better when it leans toward learning instead of compliance. The African Visionary Fund cut required documents and simplified criteria after hearing directly from grantees. [2] That same approach should shape narrative reporting too. Show contribution, not credit.
For community stakeholders, plain language matters. So do constituent-centered practices. If people can’t understand the report, it won’t build trust.
Pair data with stories without overclaiming results
Numbers show patterns. Stories show what those patterns mean in people’s lives.
The Hartford Data Collaborative in Connecticut matched program data against Hartford Public Schools and National Student Clearinghouse records, then broke out results by gender, race, and ethnicity. That mix of data helped several community agencies spot and address service gaps that overall totals had missed. [3]
Be careful not to claim attribution you can’t prove. In collective impact work, the aim is not isolated attribution. It’s shared contribution to a common outcome. That means shifting the language. Instead of saying, our grants produced this result, say, our collaborative contributed to this shift alongside partners working on X and Y. [5]
Use reporting formats that make action easier
The format matters almost as much as the message. A board packet doesn’t need the same shape as a community update.
A few formats tend to work well:
One-page board briefs focused on mission alignment and risk
Donor-ready impact summaries that pair a small set of outcome trends with system-level progress
Collaboration-wide reports that bring system change and outcome trends into one view
Community-facing updates that use plain language, visuals, and stories grounded in lived experience
The Aspen Institute Opportunity Youth Forum shows this split-screen approach well. Its annual grantee reports ask collaboratives to share both systems-change progress, such as new policies and funding shifts, and youth-level education and workforce outcomes in the same document. [3] That kind of format helps turn reporting into the next learning and review cycle, instead of a stack of papers nobody uses.
Governance, continuous learning, and conclusion
Create a review cycle for learning and adaptation
Once dashboards and reporting formats are in place, the next move is simple: set a review rhythm that turns data into decisions. A backbone organization should lead that rhythm, check the data, and keep partners on the same page about what the numbers mean. [1] Before measures are locked in, use an iterative process with partners to test and refine them.
Review a small group of metrics on a fixed schedule and keep coming back to two plain questions: what is working, and what needs to change? That steady rhythm helps the collaborative stay focused on action instead of reporting for reporting's sake.
Each review cycle should also break out results by race, ethnicity, and gender. That makes uneven progress easier to spot and harder to ignore.
How Council Fire can help operationalize collective impact measurement
This is the point where support matters most: turning a measurement plan into a system people can actually use. Council Fire helps foundations build shared metrics, data governance, dashboards, and reporting routines that support learning and decision-making.
Key takeaways for foundation leaders
For foundation leaders, the goal is practical: build a measurement routine that is simple, shared, and usable. Nearly 70% of philanthropic collaboratives surveyed in 2022 identified building measurement, evaluation, and learning capabilities as a critical investment priority. [4] Getting there takes discipline.
Start with shared outcomes, not metrics. Teams need agreement on what success looks like before they decide how to count it.
Define common metrics that work across grantees, and keep the list short enough to guide action.
Use logic models and dashboards together so the theory of change stays tied to live data.
Build strong data governance with clear roles, confidentiality standards, and equity-centered disaggregation in place from day one.
Tailor every report to its audience and treat measurement as a learning cycle. Boards need governance signals. Donors need evidence of contribution. Grantees need feedback loops. Communities need plain language. Review the work, adjust, and improve as it evolves.
"Continuous learning is essential to [collective impact] success." - Hallie Preskill, Senior Advisor, FSG [7]
FAQs
How do we choose shared outcomes across many partners?
Start with a clear strategy for what the collective is trying to do. Then bring partners together to define success in plain terms. That process should include residents, nonprofit leaders, and government officials so people feel heard and are more likely to support the work.
Use open, repeat discussions to shape shared measures over time. Put equity at the center by breaking data into groups, spotting service gaps, and tracking population-level results instead of focusing on the impact of single organizations.
What metrics should every grantee report?
Every grantee should report metrics tied to the initiative’s shared goals. That doesn’t mean every organization needs to submit the exact same data. What matters is a set of common indicators that partners agree on before data collection starts.
In most cases, those indicators include mission-aligned outcomes, progress toward population-level goals, and participant demographics such as race, gender, and geography for equity analysis. To keep reporting lighter and reduce confusion, use standardized forms and consistent definitions.
How can we show collective impact without overclaiming credit?
Keep the focus on the initiative’s overall progress toward shared, population-level outcomes, not on any one organization’s performance. A theory of change can help make that clear. It shows how your activities, alongside the work of other partners, connect to larger system goals.
Measure impact at the field or systems level, and be open about the fact that these results come from joint effort. Put the shared agenda at the center, rather than spotlighting any single participant’s accomplishments.
Related Blog Posts
How to Integrate ESG into Core Business Operations for Foundations & Philanthropic Organizations
How to Measure and Communicate Collective Impact for Municipalities & Government Agencies
How to Measure and Communicate Collective Impact for Corporations
How to Measure and Communicate Collective Impact for NGOs & Nonprofits
Latest Articles
©2025
Narrative Change and Power Building: The Missing Half of Advocacy
Narrative change is the process of disrupting dominant narratives that normalize inequity and advancing new narratives from historically marginalized communities.
Funding Resilience Without Federal Grants
BRIC is unreliable and FEMA is shrinking. Here's how cities fund climate resilience with dedicated revenue, blended finance, and a coordinating authority.
The ESG Blind Spot: How AI Is Finding Risks in Companies Nobody Else Is Watching
Norway's sovereign wealth fund uses AI to screen 7,200 portfolio companies for forced labor and corruption within 24 hours. The real story is the emerging-market coverage gap that traditional ESG data vendors miss — and what it means for any company with a global supply chain.
FAQ
What does it really mean to “redefine profit”?
What makes Council Fire different?
Who does Council Fire work with?
What does working with Council Fire actually look like?
How does Council Fire help organizations turn big goals into action?
How does Council Fire define and measure success?