In This Article
Map affected roles, timelines, and funding so workers move into suitable, paid jobs—measure placement and 12-month retention.
How Energy Firms Report Worker Transition Risk
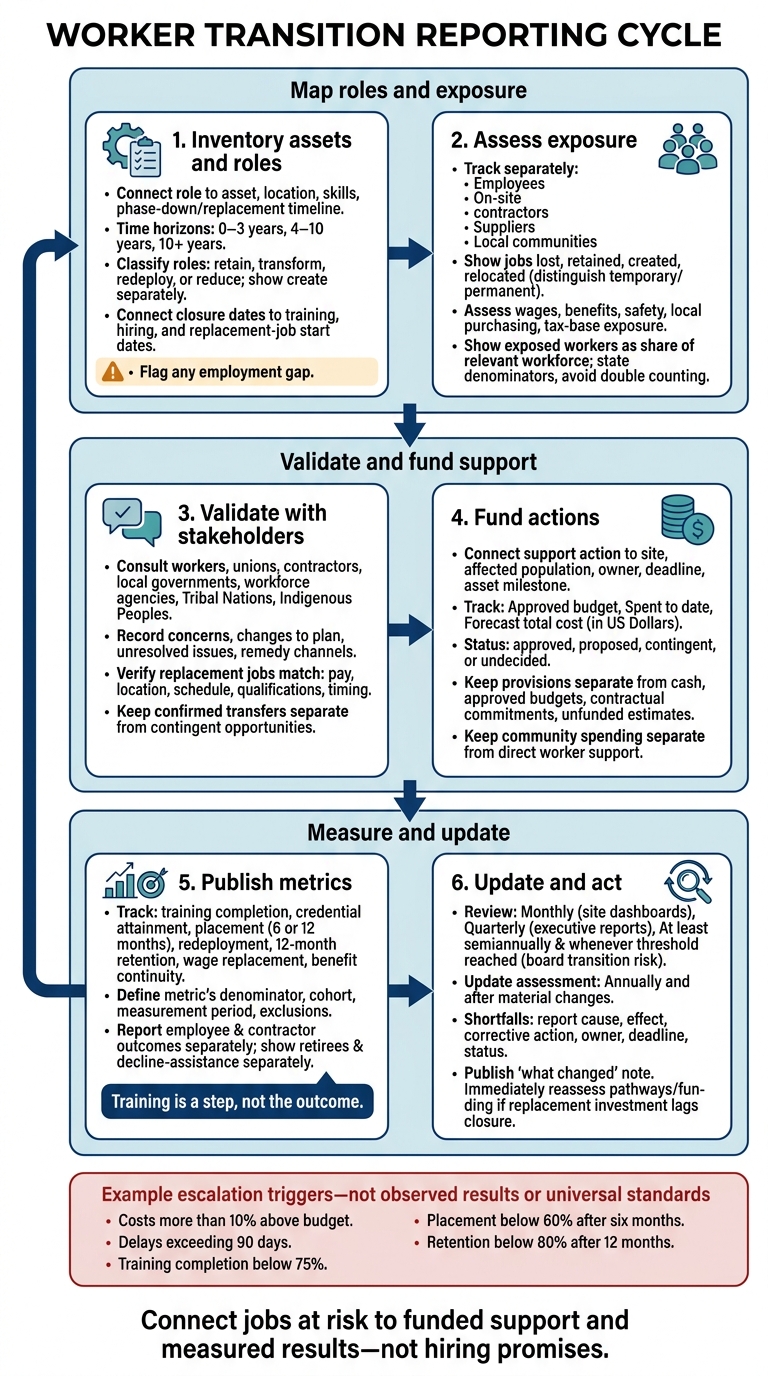
I judge a worker transition report by whether it connects jobs at risk to funded support and measured results - not hiring promises. Start by showing whose work will change, when it will change, and whether replacement jobs match workers’ pay, location, and needs.
I look for three links:
Roles and timelines: Map affected jobs, skills gaps, and confirmed openings across 0–3 years, 4–10 years, and 10+ years.
People and places: Track employees, contractors, suppliers, and local communities separately, including job losses, wages, safety, and consultation.
Funding and results: Connect support to budgets, named owners, and deadlines. Measure placement, pay, and 12-month retention, not just training attendance.
Training is a step, not the outcome. My test is <u>whether workers can move into suitable jobs when they need them</u>. Clear data limits, financial links, and updates after major changes help you see where plans are working - and where action is still needed.
Worker Transition Risk Reporting: From Exposure to Outcomes
What is a Just Transition and How Can We Accelerate It?
sbb-itb-8baf5f1
Step 1: Map Roles and Skills to Asset Timelines
Connect each role to an asset timeline so readers can see when jobs change, end, or move. Identify the plant, unit, project, or support function that needs the role and the decision changing that work. Cover production, operations, maintenance, engineering, construction, logistics, administration, and site support.
Company-wide hiring does not prove a pathway for workers at a closing plant. Show whether suitable jobs will be available where and when affected workers need them. This asset-by-asset view provides the basis for assessing skills and timing.
Classify Roles and Identify Skills Gaps
Classify current positions as retain, transform, redeploy, or reduce, and report create separately from existing jobs. Record skills, certifications, scheduled hours, location, and tenure bands. Publish aggregated results that prevent readers from identifying people in small groups.
| Role group | Current skills to assess | Future requirements and gaps to verify | Training capacity and vacancies to report | Pathway to report only if confirmed |
|---|---|---|---|---|
| Maintenance electricians | Electrical maintenance and controls | Battery systems, digital controls, equipment-specific safety requirements | Seats per year, training hours, credentials required, confirmed openings | Storage or grid work, subject to qualification |
| Heavy-equipment operators | Equipment operation and site work | Remediation training and required certifications | Available seats, completion dates, funded vacancies | Decommissioning or reclamation |
| Engineering and construction workers | Design, procurement, and project delivery | Requirements of the replacement technology | Provider capacity, time to proficiency, hiring windows | Replacement-project construction; distinguish temporary from permanent work |
For each asset and role group, report exposed workers as a share of the relevant workforce. State the denominator and count each affected worker only once in asset totals. Report contractor exposure separately, and explain whether estimates come from rosters, procurement records, or labor hours.
Show training completion, credential attainment, and placement alongside available training seats. Each proposed pathway also needs a location, wage range, schedule, and realistic start date.
Then connect each mapped role to the site timeline that determines when exposure begins and ends.
Report Plant Phase-Down Dates and Worker Milestones
Publish one timeline entry for each material site or unit and its affected activities. Report employee and contractor exposure separately, then link asset dates to worker-support deadlines. Use the table to connect site activities with worker milestones and funding - not just project dates.
| Site-level activity | Exposure and asset date | Decision status and dependencies | Support milestones | Replacement project and financial-plan link |
|---|---|---|---|---|
| Operating phase-down | Affected roles and counts; generation-reduction and retirement dates | Announced commitment, approved plan, or scenario assumption; reliability and regulatory conditions | Notification, skills assessment, consultation, training enrollment | Replacement capacity; operating budget and closure reserve |
| Conversion or replacement construction | Existing workers eligible to move; construction demand and commissioning period | Permits, financing, interconnection, equipment, and labor availability | Credential completion, hiring windows, redeployment offers | Conversion or replacement project; capital-plan reference |
| Decommissioning and remediation | Retained and contractor roles; work start and expected duration | Closure approvals, environmental requirements, contracting schedule | Contractor notice, placement support, separation decisions | Remediation or site reuse; closure and remediation funding |
Use only the date precision the plan supports:
2028, Q2 2028, or June 30, 2028.
Distinguish announced dates from modeled scenarios, and explain what could move each schedule forward or delay it. Show planned versus actual worker milestones and state whether linked funding is approved, proposed, contingent, or undecided. If replacement work begins after operating jobs end, disclose the employment gap and the support planned for that period.
Step 2: Report Site and Supply Chain Labor Impacts
Use the asset timeline from Step 1 to screen sites for material labor and community impacts. Consider shutdown timing, site size, contractor dependence, the site’s role in the local economy, and exposure of vulnerable groups. Report local losses and gains separately.[4]
Assess Local Jobs and Community Impacts
Show current conditions, the expected phase-down period, the closure or conversion year, and post-closure years. Separate jobs lost, retained, created, and relocated, and distinguish temporary work from permanent employment.
Report wages, benefits, local purchasing, taxes, royalties, and safety risks from demolition and remediation. Explain whether workers can access replacement jobs and training given commute times, transportation options, and childcare needs. Keep direct employment separate from estimated supplier and household-spending effects, and disclose modeling assumptions.[4][5][6]
Redeploying employees does not prevent all local losses. Local tax bases and supplier networks may still suffer.
Before final decisions, complete a documented community and human-rights review for screened sites. Use participatory methods and stakeholder mapping. Consult affected employees, unions, contractors, local governments, workforce agencies, Tribal Nations, and Indigenous Peoples where relevant. Report who was consulted and when, their main concerns, how the plan changed in response, unresolved issues, and available grievance or remedy channels. Start engagement before decisions are final and continue through implementation and post-closure monitoring.[4]
Report Contractor and Supplier Exposure Separately
Build a separate exposure register using procurement records, supplier disclosures, worker interviews, and site audits. Check whether shorter contracts, cost pressure, or accelerated schedules threaten wages, benefits, safe staffing, or labor rights. Report consultation outcomes and corrective-action deadlines - not just audit counts.[4]
| Group | Exposure | Evidence | Mitigation | Owner | Metric |
|---|---|---|---|---|---|
| Employees | Job, wage, or benefit losses | Payroll and worker consultation | Redeployment, benefit continuation | Site HR | Reemployment rate; wage replacement |
| On-site contractors | Reduced maintenance or service work | Rosters, contracts, worker interviews | Advance notice, safe staffing, placement support | Procurement and site manager | Retention and placement rates; grievance resolution |
| Fuel and transportation suppliers | Falling orders and workforce reductions | Purchase volumes, supplier-confirmed headcounts | Phased contracting, supplier transition plans | Supply-chain leader | Exposed worker count; notice periods |
| Equipment and construction suppliers | Changing demand and working-condition risks | Purchase orders, subcontractor records, audits | Labor requirements and corrective actions | Capital projects and procurement | Local hires; safety incidents; overdue actions |
| Closure and remediation suppliers | Temporary work and hazardous tasks | Project staffing plans and safety records | Worker consultation, training, safety checks | Environmental and project teams | Employment duration; injuries; concern resolution |
Label modeled figures and missing data, and state coverage and confidence. To avoid double counting, exclude contractor or supplier jobs already counted elsewhere from indirect totals. Report induced household-spending effects separately. Do not count contract termination as mitigation unless it includes worker remedy.[4]
Use the site and supplier findings to assign budgets, owners, and worker-support actions.
Step 3: Connect Worker Support to Funding and Oversight
Use the exposure register from Step 2 to assign funding, owners, and deadlines. Then report how worker support is funded, governed, and measured.
Link Worker Support to Budgets and Capital Plans
Connect each worker-support action to its site, affected population, delivery date, asset milestone, and accounting treatment. Keep provisions separate from cash, approved budgets, contractual commitments, and unfunded estimates.[3][8]
Use the register below to report all amounts in U.S. dollars. Keep community spending separate from direct worker support.
| Action and population | Funding source and treatment | Approved budget | Spent to date | Forecast total cost and funding status | Accountable owner | Outcome metric |
|---|---|---|---|---|---|---|
| Technical retraining and new-project hiring for affected workers | New project capital plan or operating budget; explain treatment | Approved amount in $ | Actual spending in $ | Total expected cost in $; approved versus estimated | Project director and HR lead | Training-to-placement rate |
| Relocation assistance for redeployed employees | Operating budget | Approved amount in $ | Actual spending in $ | Total expected cost in $; committed versus estimated | Business-unit HR lead | Retention after 12 months |
| Severance and benefit continuation for eligible workers | Closure or restructuring provision; identify payment funding separately | Approved amount in $ | Actual payments in $ | Expected payments in $; provision shown separately | Finance and site HR | Timely payments; benefit continuity |
| Community investment for affected residents | Separate community investment program | Approved amount in $ | Actual spending in $ | Total expected cost in $; funding conditions | Community-investment lead | Local employment outcomes |
Add a decision-linkage column identifying each action as a prerequisite, assumed cost, schedule activity, or mitigation measure. Show how a six-month delay, a 20% increase in training costs, or a 15% shortfall in qualified workers would affect total cost, net present value, capital allocation, or financing conditions. Explain forecast changes in terms of headcount, wages, eligibility, inflation, or schedule shifts.[8][9]
With funding linked to each action, assign ownership and set the reporting schedule.
Assign Accountability and Track Worker Outcomes
Oversight should test whether funded actions improve worker outcomes. Name the board committee and executive responsible for climate, risk, audit, sustainability, or human capital oversight. Assign clear responsibilities:
Finance: Funding and financial assumptions.
HR: Worker outcomes.
Operations: Site delivery.
Procurement: Contractor support.
Legal or compliance: Labor and disclosure controls.
Review site dashboards monthly and executive reports quarterly. Review board-level transition risk at least semiannually and whenever a threshold is breached. Set consultation checkpoints before closure decisions, after phase-down approval, during workforce selection, before training starts, and after placement outcomes are known. Define escalation triggers, then record each response, owner, deadline, and revised assumption.[2]
Example triggers: costs more than 10% above budget, delays exceeding 90 days, training completion below 75%, placement below 60% after six months, or retention below 80% after 12 months.
Report training completion, placement within six or 12 months, redeployment, 12-month retention, voluntary separation, wage replacement rates, and benefit continuity. Define each metric’s denominator, cohort, measurement period, and exclusions. Show retirees and workers who decline assistance separately.
Break down results by site, worker type, gender, race and ethnicity where legally permissible, age band, employment status, and contractor status when data quality and privacy controls allow. Report contractor exposure separately from employee exposure so employee placement rates do not hide risks among temporary, subcontracted, or supplier workforces.
Include site-level indicators such as payroll at risk, tax-base exposure, and the percentage of workers covered by verified data. For each material shortfall, explain the original assumption, actual result, cause, financial or schedule effect, corrective action, owner, deadline, and status. Update affected closure dates, hiring needs, operating costs, provisions, financing requirements, or project returns.[3][7][8]
Conclusion: Update Reports and Act on Findings
Worker transition risk changes as assets, contracts, and capital plans shift. Treat reporting as a cycle, not a one-time task.
Use a repeatable process: inventory assets and roles → assess exposure → validate with stakeholders → fund actions → publish metrics → update the assessment annually and after material changes.[10][11]
Before each update, check for changes in job pathways, assumptions, funding, and actual outcomes. Revalidate any pathway that depends on delayed hiring, permits, or financing. Keep confirmed transfers separate from contingent opportunities.
Publish a short “what changed since last year” note that lists revised assumptions and decisions.
At each update, keep role mapping, site timing, supply chain exposure, capital-plan funding, and worker outcomes aligned. If replacement investment falls behind a plant closure, reassess the job pathway and funding gap immediately - don’t wait for the next annual report.
FAQs
How can firms verify that replacement jobs are suitable?
Firms should look beyond matching skills: Do replacement jobs offer comparable wages, benefits, protections, and long-term security? Track wage replacement rates and overall job quality - not just how many workers land a job [1].
Verification also calls for advance planning shaped by stakeholders’ needs. Map realistic jobs that workers can access, along with the training and support they’ll need to make the transition [1].
How should firms report gaps in contractor workforce data?
Firms should include contractors in core workforce transition planning, mapping their roles, skills, and site-level impacts alongside those of direct employees. Align contractor data with capital plans and plant phase-down timelines.
Require supply chain partners to share their labor transition strategies. Set up joint governance with contractors and worker representatives to manage workforce impacts consistently across the value chain.
What happens to worker support if replacement projects lose funding?
A workforce transition plan can stall - or fail - when worker support and replacement projects draw from separate budgets. Without dedicated funding for retraining, payments that bridge the gap to retirement, and income support, workers’ needs often go unmet.
Companies that leave these needs unmet risk losing community trust and acceptance. That loss can lead to litigation, regulatory scrutiny, and reputational damage, putting their decarbonization plans at risk.



FAQ