Jul 25, 2026
Case Study: Climate Adaptation in Retail Logistics
Sustainability Strategy
In This Article
Efficiency isn't enough: map climate risk, harden sites, and pre-position inventory so retail networks can deliver after storms.
Case Study: Climate Adaptation in Retail Logistics
If you want the short version, here it is: I saw a retailer move from reacting to storms to planning ahead by fixing four weak points - sites, routes, inventory, and response planning. The company mapped risk across warehouses and freight lanes, added backup power and temperature controls, placed storm goods closer to demand, and lined up extra warehouse and carrier capacity before trouble started.
A few facts stand out:
Weather-related supply chain disruption cost retail about $100 billion in 2024
The network had key exposure in Florida, Texas, Georgia, and California
Lean inventory left little room for emergency items like generators, propane tanks, and fans
During Hurricane Florence, Ace staged nearly 3,500 pallets of storm goods
Result: stores in affected areas were supplied in less than 24 hours, with less need for costly expedited freight
For me, the main lesson is simple: efficiency alone is not enough. If you run a retail network, you need to know which buildings, routes, and products fail first, and you need backup options in place before a storm, heat wave, flood, or wildfire disrupts the flow.
What this article shows, in plain terms:
Risk mapping first: find exposed warehouses, routes, and single points of failure
Site fixes next: improve backup power and heat protection where outages hurt most
Network changes: add backup hubs, extra carriers, and alternate routes
Inventory shifts: hold buffer stock for storm-season demand in high-risk regions
Shared planning: use weather data in supply chain, finance, and store planning meetings
Here’s the case in one view:
Focus area | Main problem | What changed | Result |
|---|---|---|---|
Warehouses and stores | Heat, outages, flood and fire exposure | Backup power and temperature controls | Less downtime and product loss |
Distribution network | Too much reliance on a few RDCs | Backup capacity and flexible warehousing | Lower single-site risk |
Inventory | Lean stock, weak storm readiness | Seasonal buffer stock near risk zones | Faster response to demand spikes |
Freight | Standard routes failed in bad weather | More carriers and backup routes | Fewer delays and lower emergency shipping costs |
Planning | Reactive decisions | Weather and climate data in planning | Earlier action before disruptions spread |
If I had to sum it up in one line, it would be this: the retailer did not just harden buildings - it changed where goods sat, how freight moved, and who made the call when pressure built.
That shift is the core takeaway from the full case.
Gaining a Competitive Edge: Building Climate-Resilient Supply Chains
Starting Point: Logistics Model and Climate Vulnerabilities
The company relied on regional distribution centers (RDCs) to restock thousands of stores, using a lean inventory model with very little room for disruption. Stock levels stayed low to cut carrying costs, but that also meant there was almost no extra capacity for emergency items like generators, propane tanks, and box fans [1].
Where the Network Was Exposed
The weak spots came down to location, concentration, and poor backup design. Several facilities were placed in hurricane-prone corridors across Florida, Texas, and Georgia, along with wildfire-prone areas in California [1]. A small number of RDCs handled most store replenishment, so if just one site went down, many stores could feel it fast. Most warehouses also had limited backup power and weak temperature control for goods that could be damaged by heat.
The table below shows the company’s main exposure points before adaptation [1].
Risk Area | Pre-Adaptation Condition | Climate Threat |
|---|---|---|
Facility Location | RDCs in Florida, Texas, Georgia, and California | Hurricanes, flooding, wildfire risk |
Inventory Model | Lean/JIT, limited emergency SKU capacity | Demand surges during disasters |
Hub Concentration | Few critical RDCs serving many stores | Single-point failure risk |
Backup Systems | Limited backup power and temperature controls | Extreme heat, power outages |
Transportation Network | Reliance on standard replenishment routes | Delays from severe weather disruptions |
When climate events hit, the company often had to rush goods in from far-off hubs. That slowed recovery and left shelves empty for longer stretches.
How the Company Measured Current and Future Risk
To move from reacting to planning ahead, the company first needed a clear view of both current exposure and future climate risk. That meant using a structured vulnerability assessment to rank where the network was under the most strain - pinpointing which sites, routes, and inventory policies carried the highest risk.
In plain terms, the assessment showed where the system was most likely to break first and where the impact would spread the fastest. That gave the company a sharper basis for deciding what to change next in its sites, transportation routes, and inventory rules.
Adaptation Actions: Facility Upgrades, Network Changes, and Better Planning
After the assessment, the company moved on three fronts: site upgrades, network redesign, and planning. The findings didn't sit in a slide deck. They became the company's action map.
Site-Level Upgrades at Warehouses and Stores
The company upgraded backup power and temperature controls at its highest-risk warehouses and stores. It put the first dollars into sites with the largest revenue exposure, which is often where disruption hurts most and fastest.
Network Redesign and Inventory Resilience
The company also added backup capacity at regional hubs to cut single-point failure risk. That matters when one site, one route, or one partner can throw the whole system off balance.
Safety stock policies were updated to build seasonal buffer stock for high-demand SKUs in storm-prone regions. Carrier diversification and backup routes also reduced dependence on any single partner or corridor. In plain terms, the network gained more room to absorb shocks without stalling.
Forecasting, Governance, and Cross-Team Coordination
The company added weather forecasts and climate projections to logistics planning, so inventory positioning and carrier scheduling could be adjusted earlier in the planning process.
Leaders reviewed climate-risk metrics in cross-functional planning meetings and used them to adjust inventory, routing, and capital spending. That gave operations, supply chain, and finance a shared view of where pressure was building and what needed to change first.
These changes set up the performance gains described in the next section.
Results: Performance Gains, Financial Impact, and Lessons Learned
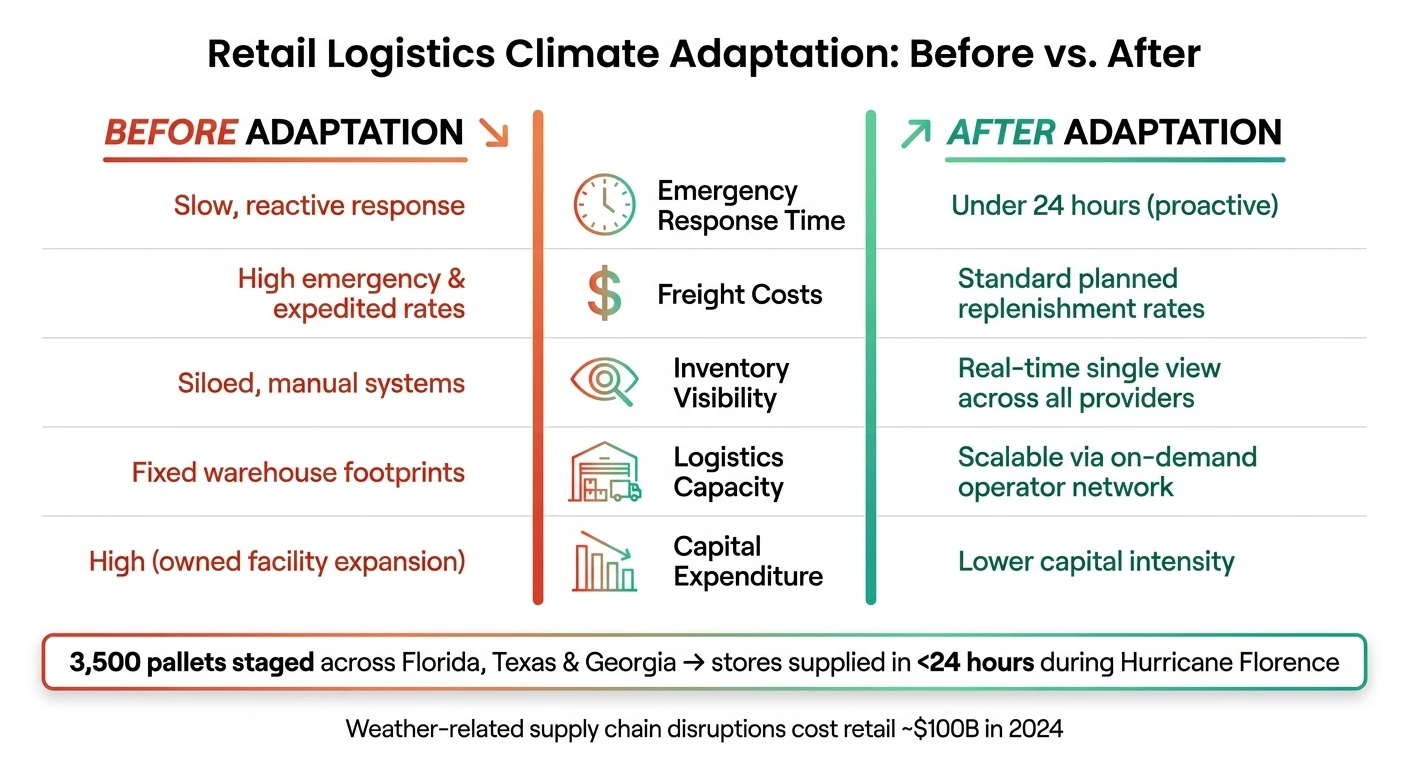
Retail Logistics Climate Adaptation: Before vs. After
Operational and Financial Outcomes After Adaptation
Ace Hardware's Hurricane Heroes network got critical goods to stores affected by Hurricane Florence in under 24 hours, a major step up from the company's 2017 Harvey response, when it had to lean on costly expedited freight to support Houston stores. [1] To make that happen, Ace staged nearly 3,500 pallets of generators, gas cans, and propane tanks across Florida, Texas, and Georgia. [1]
The lift did not come from one fix alone. It came from putting inventory closer to risk, adding backup capacity, and improving how the network could shift under pressure. Site upgrades mattered. Extra capacity mattered. Forward-deployed inventory mattered. Together, they changed the speed and cost of response.
Comparison Tables for a Quick Read of the Case Study
The tables below sum up the main operational shifts and outcomes.
Climate hazards, affected assets, and what changed:
Climate Hazard | Affected Logistics Asset | Adaptation Measure | Observed Outcome |
|---|---|---|---|
Hurricanes / Flooding | Regional distribution centers | Forward-deployed inventory in flexible warehouses | Delivery to stores in <24 hours; avoided emergency freight costs [1] |
Localized disasters | Single-source suppliers | Supply chain diversification across multiple regions | Lower reliance on any single region or carrier [1] |
Variable demand / Storms | Warehouse capacity | Flexible, on-demand third-party logistics network | Lower capital intensity [1] |
Before and after adaptation:
Metric | Before Adaptation | After Adaptation |
|---|---|---|
Emergency response time | Slow, reactive response | <24 hours (proactive, during/post-event) [1] |
Freight costs | High emergency and expedited rates | Standard planned replenishment rates [1] |
Inventory visibility | Disparate, siloed, manual systems | Real-time single view across all providers [1] |
Capital expenditure | High (owned facility expansion) | Lower capital intensity [1] |
Logistics capacity | Fixed warehouse footprints | Scalable via on-demand operator network [1] |
What Other Organizations Can Take From This Case
The lesson here is pretty plain: start with risk mapping, then send capital where exposure is highest. If a company doesn't know which sites, suppliers, and transport links face the most pressure, it is flying blind when the next storm hits.
Map climate exposure across owned facilities and key dependencies. Then pair site hardening with flexible logistics capacity. One without the other can leave gaps. A tougher site helps, but if inventory is in the wrong place or warehouse space can't expand fast enough, response still slows down.
For retail logistics teams, this case shows that speed is not just about transportation. It is also about where stock sits, how many options exist in the network, and whether operators can see inventory across providers in real time.
Conclusion: What This Case Study Shows About Climate-Ready Retail Logistics
Climate adaptation in retail logistics isn't a side project. It's a business continuity issue. Ace Hardware's preparation made that plain when it delivered shipments to affected areas in under 24 hours during Hurricane Florence.[1]
The bigger lesson comes down to network design and ownership. Resilience works when companies build networks that can bend under pressure and when someone clearly owns the response. In practice, that means preventive planning - bringing climate risk into capital plans before disruption hits, not after the damage is done.[2]
This case lays out a direct path: assess exposure, make targeted changes, and track response in ways you can measure. That's a much stronger position than scrambling when a storm is already at the door.
As Ace Hardware's supply chain leader put it:
"Logistics is our differentiator. We have to have the right product selection at the right price, delivered on time, to support our retailers." - Kevin Kryscio, Senior Director of Supply Chain, Ace Hardware[1]
For organizations trying to build the same kind of resilience, governance matters just as much as physical infrastructure. Clear ownership of climate risk, disciplined capital allocation, and measurable performance indicators are what keep resilience programs working under stress.
That is the real shift: moving from reacting to storms to planning for them.
FAQs
How do retailers start climate risk mapping?
Start with a clear inventory of your physical footprint: warehouses, distribution centers, stores, and the infrastructure those sites depend on to keep operating.
Next, plot each asset by geographic coordinates and compare those locations with hazard projections through tools like the NOAA Climate Explorer or FEMA National Risk Index. Look at both acute risks and chronic risks, then record the likely impact and probability in a risk register. That gives you a plain way to rank resilience spending and focus funds where disruption could hit hardest.
Which products need buffer stock before storms?
Retailers often set aside buffer stock for storm-related basics such as generators, power cords, tarps, and box fans. They also hold extra bottled water, nonperishable food, batteries, and shelf-stable milk, along with plywood, gas cans, propane tanks, extension cords, and tube sand.
That reserve stock matters when severe weather hits. It helps stores keep key goods on hand during cleanup and recovery, when demand can spike almost overnight. In practical terms, this kind of planning supports climate resilience and gives communities a better shot at finding what they need when the power is out, roads are blocked, or supply shipments are delayed.
What metrics show if adaptation is working?
Track results you can measure across operations, finances, the environment, and safety. That way, the work doesn’t sit in a slide deck - it shows up in day-to-day performance.
Operational: less downtime, fewer infrastructure failures, faster recovery
Financial: lower energy and fuel costs
Environmental: lower emissions intensity, temperature reductions, stormwater interception
Safety: fewer heat-related medical incidents, higher staff training completion
Related Blog Posts
How to Build a Climate Resilience Plan for Maritime & Logistics Companies
How to Integrate Climate Risk into Infrastructure Planning for Maritime & Logistics Companies
How to Build Heat Resilience & Urban Greening for Maritime & Logistics Companies
How to Build a Climate-Ready Energy & Water Infrastructure Plan for Maritime & Logistics Companies
Latest Articles
©2026

Narrative Change and Power Building: The Missing Half of Advocacy
Narrative change is the process of disrupting dominant narratives that normalize inequity and advancing new narratives from historically marginalized communities.

Funding Resilience Without Federal Grants
BRIC is unreliable and FEMA is shrinking. Here's how cities fund climate resilience with dedicated revenue, blended finance, and a coordinating authority.

The ESG Blind Spot: How AI Is Finding Risks in Companies Nobody Else Is Watching
Norway's sovereign wealth fund uses AI to screen 7,200 portfolio companies for forced labor and corruption within 24 hours. The real story is the emerging-market coverage gap that traditional ESG data vendors miss — and what it means for any company with a global supply chain.
Narrative Change and Power Building: The Missing Half of Advocacy
Narrative change is the process of disrupting dominant narratives that normalize inequity and advancing new narratives from historically marginalized communities.
Funding Resilience Without Federal Grants
BRIC is unreliable and FEMA is shrinking. Here's how cities fund climate resilience with dedicated revenue, blended finance, and a coordinating authority.
The ESG Blind Spot: How AI Is Finding Risks in Companies Nobody Else Is Watching
Norway's sovereign wealth fund uses AI to screen 7,200 portfolio companies for forced labor and corruption within 24 hours. The real story is the emerging-market coverage gap that traditional ESG data vendors miss — and what it means for any company with a global supply chain.
FAQ
01
What does it really mean to “redefine profit”?
02
What makes Council Fire different?
03
Who does Council Fire work with?
04
What does working with Council Fire actually look like?
05
How does Council Fire help organizations turn big goals into action?
06
How does Council Fire define and measure success?
07
How does technology fit into Council Fire’s work?
Jul 25, 2026
Case Study: Climate Adaptation in Retail Logistics
Sustainability Strategy
In This Article
Efficiency isn't enough: map climate risk, harden sites, and pre-position inventory so retail networks can deliver after storms.
Case Study: Climate Adaptation in Retail Logistics
If you want the short version, here it is: I saw a retailer move from reacting to storms to planning ahead by fixing four weak points - sites, routes, inventory, and response planning. The company mapped risk across warehouses and freight lanes, added backup power and temperature controls, placed storm goods closer to demand, and lined up extra warehouse and carrier capacity before trouble started.
A few facts stand out:
Weather-related supply chain disruption cost retail about $100 billion in 2024
The network had key exposure in Florida, Texas, Georgia, and California
Lean inventory left little room for emergency items like generators, propane tanks, and fans
During Hurricane Florence, Ace staged nearly 3,500 pallets of storm goods
Result: stores in affected areas were supplied in less than 24 hours, with less need for costly expedited freight
For me, the main lesson is simple: efficiency alone is not enough. If you run a retail network, you need to know which buildings, routes, and products fail first, and you need backup options in place before a storm, heat wave, flood, or wildfire disrupts the flow.
What this article shows, in plain terms:
Risk mapping first: find exposed warehouses, routes, and single points of failure
Site fixes next: improve backup power and heat protection where outages hurt most
Network changes: add backup hubs, extra carriers, and alternate routes
Inventory shifts: hold buffer stock for storm-season demand in high-risk regions
Shared planning: use weather data in supply chain, finance, and store planning meetings
Here’s the case in one view:
Focus area | Main problem | What changed | Result |
|---|---|---|---|
Warehouses and stores | Heat, outages, flood and fire exposure | Backup power and temperature controls | Less downtime and product loss |
Distribution network | Too much reliance on a few RDCs | Backup capacity and flexible warehousing | Lower single-site risk |
Inventory | Lean stock, weak storm readiness | Seasonal buffer stock near risk zones | Faster response to demand spikes |
Freight | Standard routes failed in bad weather | More carriers and backup routes | Fewer delays and lower emergency shipping costs |
Planning | Reactive decisions | Weather and climate data in planning | Earlier action before disruptions spread |
If I had to sum it up in one line, it would be this: the retailer did not just harden buildings - it changed where goods sat, how freight moved, and who made the call when pressure built.
That shift is the core takeaway from the full case.
Gaining a Competitive Edge: Building Climate-Resilient Supply Chains
Starting Point: Logistics Model and Climate Vulnerabilities
The company relied on regional distribution centers (RDCs) to restock thousands of stores, using a lean inventory model with very little room for disruption. Stock levels stayed low to cut carrying costs, but that also meant there was almost no extra capacity for emergency items like generators, propane tanks, and box fans [1].
Where the Network Was Exposed
The weak spots came down to location, concentration, and poor backup design. Several facilities were placed in hurricane-prone corridors across Florida, Texas, and Georgia, along with wildfire-prone areas in California [1]. A small number of RDCs handled most store replenishment, so if just one site went down, many stores could feel it fast. Most warehouses also had limited backup power and weak temperature control for goods that could be damaged by heat.
The table below shows the company’s main exposure points before adaptation [1].
Risk Area | Pre-Adaptation Condition | Climate Threat |
|---|---|---|
Facility Location | RDCs in Florida, Texas, Georgia, and California | Hurricanes, flooding, wildfire risk |
Inventory Model | Lean/JIT, limited emergency SKU capacity | Demand surges during disasters |
Hub Concentration | Few critical RDCs serving many stores | Single-point failure risk |
Backup Systems | Limited backup power and temperature controls | Extreme heat, power outages |
Transportation Network | Reliance on standard replenishment routes | Delays from severe weather disruptions |
When climate events hit, the company often had to rush goods in from far-off hubs. That slowed recovery and left shelves empty for longer stretches.
How the Company Measured Current and Future Risk
To move from reacting to planning ahead, the company first needed a clear view of both current exposure and future climate risk. That meant using a structured vulnerability assessment to rank where the network was under the most strain - pinpointing which sites, routes, and inventory policies carried the highest risk.
In plain terms, the assessment showed where the system was most likely to break first and where the impact would spread the fastest. That gave the company a sharper basis for deciding what to change next in its sites, transportation routes, and inventory rules.
Adaptation Actions: Facility Upgrades, Network Changes, and Better Planning
After the assessment, the company moved on three fronts: site upgrades, network redesign, and planning. The findings didn't sit in a slide deck. They became the company's action map.
Site-Level Upgrades at Warehouses and Stores
The company upgraded backup power and temperature controls at its highest-risk warehouses and stores. It put the first dollars into sites with the largest revenue exposure, which is often where disruption hurts most and fastest.
Network Redesign and Inventory Resilience
The company also added backup capacity at regional hubs to cut single-point failure risk. That matters when one site, one route, or one partner can throw the whole system off balance.
Safety stock policies were updated to build seasonal buffer stock for high-demand SKUs in storm-prone regions. Carrier diversification and backup routes also reduced dependence on any single partner or corridor. In plain terms, the network gained more room to absorb shocks without stalling.
Forecasting, Governance, and Cross-Team Coordination
The company added weather forecasts and climate projections to logistics planning, so inventory positioning and carrier scheduling could be adjusted earlier in the planning process.
Leaders reviewed climate-risk metrics in cross-functional planning meetings and used them to adjust inventory, routing, and capital spending. That gave operations, supply chain, and finance a shared view of where pressure was building and what needed to change first.
These changes set up the performance gains described in the next section.
Results: Performance Gains, Financial Impact, and Lessons Learned
Retail Logistics Climate Adaptation: Before vs. After
Operational and Financial Outcomes After Adaptation
Ace Hardware's Hurricane Heroes network got critical goods to stores affected by Hurricane Florence in under 24 hours, a major step up from the company's 2017 Harvey response, when it had to lean on costly expedited freight to support Houston stores. [1] To make that happen, Ace staged nearly 3,500 pallets of generators, gas cans, and propane tanks across Florida, Texas, and Georgia. [1]
The lift did not come from one fix alone. It came from putting inventory closer to risk, adding backup capacity, and improving how the network could shift under pressure. Site upgrades mattered. Extra capacity mattered. Forward-deployed inventory mattered. Together, they changed the speed and cost of response.
Comparison Tables for a Quick Read of the Case Study
The tables below sum up the main operational shifts and outcomes.
Climate hazards, affected assets, and what changed:
Climate Hazard | Affected Logistics Asset | Adaptation Measure | Observed Outcome |
|---|---|---|---|
Hurricanes / Flooding | Regional distribution centers | Forward-deployed inventory in flexible warehouses | Delivery to stores in <24 hours; avoided emergency freight costs [1] |
Localized disasters | Single-source suppliers | Supply chain diversification across multiple regions | Lower reliance on any single region or carrier [1] |
Variable demand / Storms | Warehouse capacity | Flexible, on-demand third-party logistics network | Lower capital intensity [1] |
Before and after adaptation:
Metric | Before Adaptation | After Adaptation |
|---|---|---|
Emergency response time | Slow, reactive response | <24 hours (proactive, during/post-event) [1] |
Freight costs | High emergency and expedited rates | Standard planned replenishment rates [1] |
Inventory visibility | Disparate, siloed, manual systems | Real-time single view across all providers [1] |
Capital expenditure | High (owned facility expansion) | Lower capital intensity [1] |
Logistics capacity | Fixed warehouse footprints | Scalable via on-demand operator network [1] |
What Other Organizations Can Take From This Case
The lesson here is pretty plain: start with risk mapping, then send capital where exposure is highest. If a company doesn't know which sites, suppliers, and transport links face the most pressure, it is flying blind when the next storm hits.
Map climate exposure across owned facilities and key dependencies. Then pair site hardening with flexible logistics capacity. One without the other can leave gaps. A tougher site helps, but if inventory is in the wrong place or warehouse space can't expand fast enough, response still slows down.
For retail logistics teams, this case shows that speed is not just about transportation. It is also about where stock sits, how many options exist in the network, and whether operators can see inventory across providers in real time.
Conclusion: What This Case Study Shows About Climate-Ready Retail Logistics
Climate adaptation in retail logistics isn't a side project. It's a business continuity issue. Ace Hardware's preparation made that plain when it delivered shipments to affected areas in under 24 hours during Hurricane Florence.[1]
The bigger lesson comes down to network design and ownership. Resilience works when companies build networks that can bend under pressure and when someone clearly owns the response. In practice, that means preventive planning - bringing climate risk into capital plans before disruption hits, not after the damage is done.[2]
This case lays out a direct path: assess exposure, make targeted changes, and track response in ways you can measure. That's a much stronger position than scrambling when a storm is already at the door.
As Ace Hardware's supply chain leader put it:
"Logistics is our differentiator. We have to have the right product selection at the right price, delivered on time, to support our retailers." - Kevin Kryscio, Senior Director of Supply Chain, Ace Hardware[1]
For organizations trying to build the same kind of resilience, governance matters just as much as physical infrastructure. Clear ownership of climate risk, disciplined capital allocation, and measurable performance indicators are what keep resilience programs working under stress.
That is the real shift: moving from reacting to storms to planning for them.
FAQs
How do retailers start climate risk mapping?
Start with a clear inventory of your physical footprint: warehouses, distribution centers, stores, and the infrastructure those sites depend on to keep operating.
Next, plot each asset by geographic coordinates and compare those locations with hazard projections through tools like the NOAA Climate Explorer or FEMA National Risk Index. Look at both acute risks and chronic risks, then record the likely impact and probability in a risk register. That gives you a plain way to rank resilience spending and focus funds where disruption could hit hardest.
Which products need buffer stock before storms?
Retailers often set aside buffer stock for storm-related basics such as generators, power cords, tarps, and box fans. They also hold extra bottled water, nonperishable food, batteries, and shelf-stable milk, along with plywood, gas cans, propane tanks, extension cords, and tube sand.
That reserve stock matters when severe weather hits. It helps stores keep key goods on hand during cleanup and recovery, when demand can spike almost overnight. In practical terms, this kind of planning supports climate resilience and gives communities a better shot at finding what they need when the power is out, roads are blocked, or supply shipments are delayed.
What metrics show if adaptation is working?
Track results you can measure across operations, finances, the environment, and safety. That way, the work doesn’t sit in a slide deck - it shows up in day-to-day performance.
Operational: less downtime, fewer infrastructure failures, faster recovery
Financial: lower energy and fuel costs
Environmental: lower emissions intensity, temperature reductions, stormwater interception
Safety: fewer heat-related medical incidents, higher staff training completion
Related Blog Posts
How to Build a Climate Resilience Plan for Maritime & Logistics Companies
How to Integrate Climate Risk into Infrastructure Planning for Maritime & Logistics Companies
How to Build Heat Resilience & Urban Greening for Maritime & Logistics Companies
How to Build a Climate-Ready Energy & Water Infrastructure Plan for Maritime & Logistics Companies
Latest Articles
©2026
Narrative Change and Power Building: The Missing Half of Advocacy
Narrative change is the process of disrupting dominant narratives that normalize inequity and advancing new narratives from historically marginalized communities.
Funding Resilience Without Federal Grants
BRIC is unreliable and FEMA is shrinking. Here's how cities fund climate resilience with dedicated revenue, blended finance, and a coordinating authority.
The ESG Blind Spot: How AI Is Finding Risks in Companies Nobody Else Is Watching
Norway's sovereign wealth fund uses AI to screen 7,200 portfolio companies for forced labor and corruption within 24 hours. The real story is the emerging-market coverage gap that traditional ESG data vendors miss — and what it means for any company with a global supply chain.
FAQ
01
What does it really mean to “redefine profit”?
02
What makes Council Fire different?
03
Who does Council Fire work with?
04
What does working with Council Fire actually look like?
05
How does Council Fire help organizations turn big goals into action?
06
How does Council Fire define and measure success?
07
How does technology fit into Council Fire’s work?
Jul 25, 2026
Case Study: Climate Adaptation in Retail Logistics
Sustainability Strategy
In This Article
Efficiency isn't enough: map climate risk, harden sites, and pre-position inventory so retail networks can deliver after storms.
Case Study: Climate Adaptation in Retail Logistics
If you want the short version, here it is: I saw a retailer move from reacting to storms to planning ahead by fixing four weak points - sites, routes, inventory, and response planning. The company mapped risk across warehouses and freight lanes, added backup power and temperature controls, placed storm goods closer to demand, and lined up extra warehouse and carrier capacity before trouble started.
A few facts stand out:
Weather-related supply chain disruption cost retail about $100 billion in 2024
The network had key exposure in Florida, Texas, Georgia, and California
Lean inventory left little room for emergency items like generators, propane tanks, and fans
During Hurricane Florence, Ace staged nearly 3,500 pallets of storm goods
Result: stores in affected areas were supplied in less than 24 hours, with less need for costly expedited freight
For me, the main lesson is simple: efficiency alone is not enough. If you run a retail network, you need to know which buildings, routes, and products fail first, and you need backup options in place before a storm, heat wave, flood, or wildfire disrupts the flow.
What this article shows, in plain terms:
Risk mapping first: find exposed warehouses, routes, and single points of failure
Site fixes next: improve backup power and heat protection where outages hurt most
Network changes: add backup hubs, extra carriers, and alternate routes
Inventory shifts: hold buffer stock for storm-season demand in high-risk regions
Shared planning: use weather data in supply chain, finance, and store planning meetings
Here’s the case in one view:
Focus area | Main problem | What changed | Result |
|---|---|---|---|
Warehouses and stores | Heat, outages, flood and fire exposure | Backup power and temperature controls | Less downtime and product loss |
Distribution network | Too much reliance on a few RDCs | Backup capacity and flexible warehousing | Lower single-site risk |
Inventory | Lean stock, weak storm readiness | Seasonal buffer stock near risk zones | Faster response to demand spikes |
Freight | Standard routes failed in bad weather | More carriers and backup routes | Fewer delays and lower emergency shipping costs |
Planning | Reactive decisions | Weather and climate data in planning | Earlier action before disruptions spread |
If I had to sum it up in one line, it would be this: the retailer did not just harden buildings - it changed where goods sat, how freight moved, and who made the call when pressure built.
That shift is the core takeaway from the full case.
Gaining a Competitive Edge: Building Climate-Resilient Supply Chains
Starting Point: Logistics Model and Climate Vulnerabilities
The company relied on regional distribution centers (RDCs) to restock thousands of stores, using a lean inventory model with very little room for disruption. Stock levels stayed low to cut carrying costs, but that also meant there was almost no extra capacity for emergency items like generators, propane tanks, and box fans [1].
Where the Network Was Exposed
The weak spots came down to location, concentration, and poor backup design. Several facilities were placed in hurricane-prone corridors across Florida, Texas, and Georgia, along with wildfire-prone areas in California [1]. A small number of RDCs handled most store replenishment, so if just one site went down, many stores could feel it fast. Most warehouses also had limited backup power and weak temperature control for goods that could be damaged by heat.
The table below shows the company’s main exposure points before adaptation [1].
Risk Area | Pre-Adaptation Condition | Climate Threat |
|---|---|---|
Facility Location | RDCs in Florida, Texas, Georgia, and California | Hurricanes, flooding, wildfire risk |
Inventory Model | Lean/JIT, limited emergency SKU capacity | Demand surges during disasters |
Hub Concentration | Few critical RDCs serving many stores | Single-point failure risk |
Backup Systems | Limited backup power and temperature controls | Extreme heat, power outages |
Transportation Network | Reliance on standard replenishment routes | Delays from severe weather disruptions |
When climate events hit, the company often had to rush goods in from far-off hubs. That slowed recovery and left shelves empty for longer stretches.
How the Company Measured Current and Future Risk
To move from reacting to planning ahead, the company first needed a clear view of both current exposure and future climate risk. That meant using a structured vulnerability assessment to rank where the network was under the most strain - pinpointing which sites, routes, and inventory policies carried the highest risk.
In plain terms, the assessment showed where the system was most likely to break first and where the impact would spread the fastest. That gave the company a sharper basis for deciding what to change next in its sites, transportation routes, and inventory rules.
Adaptation Actions: Facility Upgrades, Network Changes, and Better Planning
After the assessment, the company moved on three fronts: site upgrades, network redesign, and planning. The findings didn't sit in a slide deck. They became the company's action map.
Site-Level Upgrades at Warehouses and Stores
The company upgraded backup power and temperature controls at its highest-risk warehouses and stores. It put the first dollars into sites with the largest revenue exposure, which is often where disruption hurts most and fastest.
Network Redesign and Inventory Resilience
The company also added backup capacity at regional hubs to cut single-point failure risk. That matters when one site, one route, or one partner can throw the whole system off balance.
Safety stock policies were updated to build seasonal buffer stock for high-demand SKUs in storm-prone regions. Carrier diversification and backup routes also reduced dependence on any single partner or corridor. In plain terms, the network gained more room to absorb shocks without stalling.
Forecasting, Governance, and Cross-Team Coordination
The company added weather forecasts and climate projections to logistics planning, so inventory positioning and carrier scheduling could be adjusted earlier in the planning process.
Leaders reviewed climate-risk metrics in cross-functional planning meetings and used them to adjust inventory, routing, and capital spending. That gave operations, supply chain, and finance a shared view of where pressure was building and what needed to change first.
These changes set up the performance gains described in the next section.
Results: Performance Gains, Financial Impact, and Lessons Learned
Retail Logistics Climate Adaptation: Before vs. After
Operational and Financial Outcomes After Adaptation
Ace Hardware's Hurricane Heroes network got critical goods to stores affected by Hurricane Florence in under 24 hours, a major step up from the company's 2017 Harvey response, when it had to lean on costly expedited freight to support Houston stores. [1] To make that happen, Ace staged nearly 3,500 pallets of generators, gas cans, and propane tanks across Florida, Texas, and Georgia. [1]
The lift did not come from one fix alone. It came from putting inventory closer to risk, adding backup capacity, and improving how the network could shift under pressure. Site upgrades mattered. Extra capacity mattered. Forward-deployed inventory mattered. Together, they changed the speed and cost of response.
Comparison Tables for a Quick Read of the Case Study
The tables below sum up the main operational shifts and outcomes.
Climate hazards, affected assets, and what changed:
Climate Hazard | Affected Logistics Asset | Adaptation Measure | Observed Outcome |
|---|---|---|---|
Hurricanes / Flooding | Regional distribution centers | Forward-deployed inventory in flexible warehouses | Delivery to stores in <24 hours; avoided emergency freight costs [1] |
Localized disasters | Single-source suppliers | Supply chain diversification across multiple regions | Lower reliance on any single region or carrier [1] |
Variable demand / Storms | Warehouse capacity | Flexible, on-demand third-party logistics network | Lower capital intensity [1] |
Before and after adaptation:
Metric | Before Adaptation | After Adaptation |
|---|---|---|
Emergency response time | Slow, reactive response | <24 hours (proactive, during/post-event) [1] |
Freight costs | High emergency and expedited rates | Standard planned replenishment rates [1] |
Inventory visibility | Disparate, siloed, manual systems | Real-time single view across all providers [1] |
Capital expenditure | High (owned facility expansion) | Lower capital intensity [1] |
Logistics capacity | Fixed warehouse footprints | Scalable via on-demand operator network [1] |
What Other Organizations Can Take From This Case
The lesson here is pretty plain: start with risk mapping, then send capital where exposure is highest. If a company doesn't know which sites, suppliers, and transport links face the most pressure, it is flying blind when the next storm hits.
Map climate exposure across owned facilities and key dependencies. Then pair site hardening with flexible logistics capacity. One without the other can leave gaps. A tougher site helps, but if inventory is in the wrong place or warehouse space can't expand fast enough, response still slows down.
For retail logistics teams, this case shows that speed is not just about transportation. It is also about where stock sits, how many options exist in the network, and whether operators can see inventory across providers in real time.
Conclusion: What This Case Study Shows About Climate-Ready Retail Logistics
Climate adaptation in retail logistics isn't a side project. It's a business continuity issue. Ace Hardware's preparation made that plain when it delivered shipments to affected areas in under 24 hours during Hurricane Florence.[1]
The bigger lesson comes down to network design and ownership. Resilience works when companies build networks that can bend under pressure and when someone clearly owns the response. In practice, that means preventive planning - bringing climate risk into capital plans before disruption hits, not after the damage is done.[2]
This case lays out a direct path: assess exposure, make targeted changes, and track response in ways you can measure. That's a much stronger position than scrambling when a storm is already at the door.
As Ace Hardware's supply chain leader put it:
"Logistics is our differentiator. We have to have the right product selection at the right price, delivered on time, to support our retailers." - Kevin Kryscio, Senior Director of Supply Chain, Ace Hardware[1]
For organizations trying to build the same kind of resilience, governance matters just as much as physical infrastructure. Clear ownership of climate risk, disciplined capital allocation, and measurable performance indicators are what keep resilience programs working under stress.
That is the real shift: moving from reacting to storms to planning for them.
FAQs
How do retailers start climate risk mapping?
Start with a clear inventory of your physical footprint: warehouses, distribution centers, stores, and the infrastructure those sites depend on to keep operating.
Next, plot each asset by geographic coordinates and compare those locations with hazard projections through tools like the NOAA Climate Explorer or FEMA National Risk Index. Look at both acute risks and chronic risks, then record the likely impact and probability in a risk register. That gives you a plain way to rank resilience spending and focus funds where disruption could hit hardest.
Which products need buffer stock before storms?
Retailers often set aside buffer stock for storm-related basics such as generators, power cords, tarps, and box fans. They also hold extra bottled water, nonperishable food, batteries, and shelf-stable milk, along with plywood, gas cans, propane tanks, extension cords, and tube sand.
That reserve stock matters when severe weather hits. It helps stores keep key goods on hand during cleanup and recovery, when demand can spike almost overnight. In practical terms, this kind of planning supports climate resilience and gives communities a better shot at finding what they need when the power is out, roads are blocked, or supply shipments are delayed.
What metrics show if adaptation is working?
Track results you can measure across operations, finances, the environment, and safety. That way, the work doesn’t sit in a slide deck - it shows up in day-to-day performance.
Operational: less downtime, fewer infrastructure failures, faster recovery
Financial: lower energy and fuel costs
Environmental: lower emissions intensity, temperature reductions, stormwater interception
Safety: fewer heat-related medical incidents, higher staff training completion
Related Blog Posts
How to Build a Climate Resilience Plan for Maritime & Logistics Companies
How to Integrate Climate Risk into Infrastructure Planning for Maritime & Logistics Companies
How to Build Heat Resilience & Urban Greening for Maritime & Logistics Companies
How to Build a Climate-Ready Energy & Water Infrastructure Plan for Maritime & Logistics Companies
Latest Articles
©2026
Narrative Change and Power Building: The Missing Half of Advocacy
Narrative change is the process of disrupting dominant narratives that normalize inequity and advancing new narratives from historically marginalized communities.
Funding Resilience Without Federal Grants
BRIC is unreliable and FEMA is shrinking. Here's how cities fund climate resilience with dedicated revenue, blended finance, and a coordinating authority.
The ESG Blind Spot: How AI Is Finding Risks in Companies Nobody Else Is Watching
Norway's sovereign wealth fund uses AI to screen 7,200 portfolio companies for forced labor and corruption within 24 hours. The real story is the emerging-market coverage gap that traditional ESG data vendors miss — and what it means for any company with a global supply chain.
FAQ
What does it really mean to “redefine profit”?
What makes Council Fire different?
Who does Council Fire work with?
What does working with Council Fire actually look like?
How does Council Fire help organizations turn big goals into action?
How does Council Fire define and measure success?
How does technology fit into Council Fire’s work?