In This Article
Screen peers with ESG scores; use raw metrics to explain gaps—align definitions, boundaries, and data quality first.
ESG Scores vs. Raw Data: Competitor Benchmarking
I use ESG scores to screen competitors and raw metrics to explain the gaps - not to name a winner. Before comparing peers, I check reporting dates, company boundaries, calculation methods, and missing data. A score of 72 versus 71 tells me little without that context.
Here’s how I separate the two:
Quick Comparison
| What I check | ESG scores | Raw metrics |
|---|---|---|
| Best use | Screen peers and flag issues | Explain results and track progress |
| Speed | Fast to review | Takes more time to collect and check |
| Comparability | Same provider, rules, and peer group | Matching definitions, periods, boundaries, units, and denominators |
| Transparency | Depends on disclosed inputs and weights | Depends on sources and calculation details |
| Data needs | Combined indicators and provider estimates | Individual values with reporting details |
| Main limit | One score can hide trade-offs | Figures can mislead when coverage differs |
I keep performance separate from <u>data quality</u>: missing information is not zero, and assurance of selected figures does not cover an entire report. I then turn verified gaps into actions with an owner, baseline, deadline, and measurable goal. This approach helps organizations build climate resilience by turning data into long-term growth.
ESG Data, Measurement and Performance Management
sbb-itb-8baf5f1
ESG Scores vs. Raw Data: Key Differences
ESG scores turn multiple indicators into one signal based on a provider’s methodology. Raw metrics retain the underlying values, but comparisons work only when definitions match.
| Criterion | ESG scores | Raw metrics |
|---|---|---|
| Comparability | Useful when competitors share the same provider and methodology; scores may be sector-specific rather than absolute. | Strong only when definitions, boundaries, periods, units, and denominators align. |
| Speed | Fast for screening many peers. | Slower to collect, validate, and interpret. |
| Transparency | Depends on the indicators, weights, scoring rules, and peer group. | Depends on documented calculations, sources, estimates, and assurance details. |
| Data requirements | Can combine disclosures, questionnaires, public records, media, and estimates. | Requires individual values plus reporting and calculation details. |
| Diagnostic value | Shows assessed risk or standing, but may hide trade-offs. | Pinpoints emissions, safety, resource-use, or governance gaps. |
The table shows what each approach reveals. Before comparing peers, check how the provider builds its scores.
ESG Scores: Indicators, Weights, and Rules
A composite score puts indicators on one scale, assigns weights, and combines them into a single result for peer ranking. Materiality rules set which issues matter most; peer groups shape relative rank. Controversy rules may adjust results based on an event’s severity, harm to stakeholders, or financial exposure.
Risk scores and impact scores measure different things. Risk scores assess exposure to ESG-related financial effects. Impact scores assess effects on people and the environment.
| Methodology field | What to check |
|---|---|
| Coverage | Companies, sectors, regions, subsidiaries, and indicators included. |
| Scale | Letter grade, numerical score, percentile, or risk category - and whether higher means better. |
| Absolute versus relative meaning | Whether the score measures performance against a standard, financial risk, or standing among peers. |
| Weighting transparency | Published indicators, materiality rules, weights, normalization, and aggregation formulas. |
| Update frequency | Timing of company-data updates, controversy updates, and methodology changes. |
| Source mix | Disclosures, questionnaires, public records, government and NGO publications, media, and estimates. |
| Missing-data treatment | Penalties, estimates, exclusions, sector averages, or redistributed weights. |
Record the score date and methodology version with these fields. A score can change because the rules or peer group changed - not because the company performed differently. Raw metrics help explain the operating details behind the assessed standing.
Raw Metrics: Values, Boundaries, and Intensity
Raw metrics help explain peer differences through individual reported or estimated indicators: Scope 1 and Scope 2 emissions, energy use, injury rates, board composition, water withdrawal, and waste.
Pair totals with intensity measures, such as emissions per metric ton produced, resource use per employee, or emissions per $1 million in revenue. Lower revenue intensity does not always mean lower physical emissions: rising prices alone can improve the ratio.
Use the same denominator across peers, and align definitions, fiscal years, boundaries, acquisitions, restatements, and estimation methods. For Scope 2, location-based figures use grid-average emissions, while market-based figures reflect qualifying contractual electricity instruments. Where GHG Protocol guidance applies, report both methods and compare like with like.[5][6]
Missing Data and Reporting Quality
Missing data can distort competitor benchmarks as much as weak performance. Assess reporting quality separately from performance: a missing value may reflect a delay, an exclusion, or unavailable data - not zero.
A score may penalize gaps, estimate values, exclude indicators, or redistribute their weights. Each choice can affect rankings. Before accepting a raw-metric comparison, check its source, period, boundary, unit, denominator, assurance scope, estimation method, restatements, exclusions, and treatment of missing values.
Assurance of selected indicators does not cover an entire report. Label gaps “not reported,” “estimated,” or “not applicable,” and leave comparisons open when the evidence is insufficient.
When to Use Scores, Raw Metrics, or Both
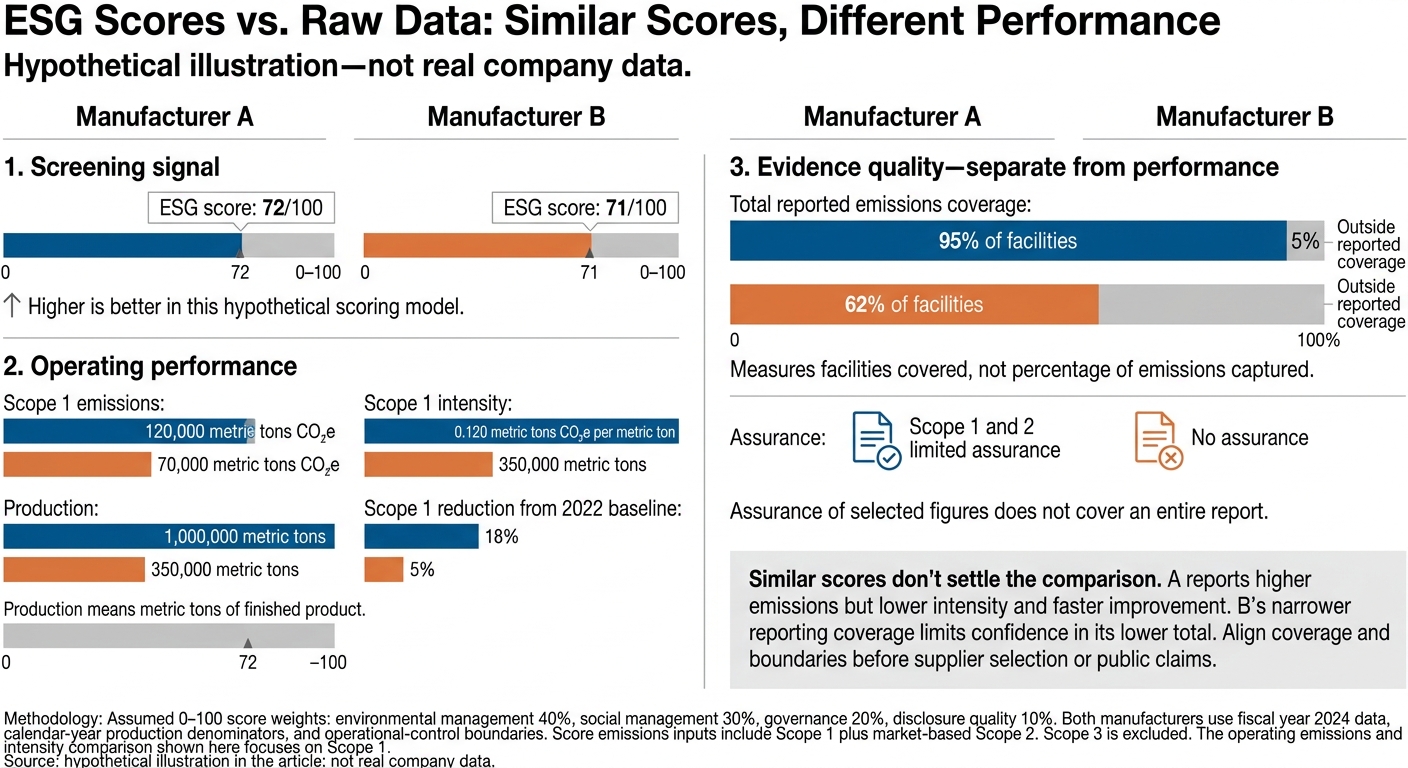
ESG Scores vs. Raw Data: Similar Scores, Different Performance
Once you’ve checked scoring methods and reporting quality, match the comparison to the decision: scores for screening, raw metrics for explanation, and both for procurement, investment, or public claims.
| Benchmarking task | Best approach | Main limitation | Required checks |
|---|---|---|---|
| Screen competitors | Scores first | Strong scores can hide material issues | Peer group, rating date, score direction |
| Prioritize suppliers or portfolio companies | Both | A low score may reflect missing disclosure rather than poor outcomes | Materiality, missing-data treatment |
| Track broad trends | Scores plus selected metrics | Methodology changes can create artificial movement | Methodology revisions, peer changes |
| Explain emissions or efficiency gaps | Raw metrics | Boundaries and operating conditions may differ | Scopes, boundaries, Scope 2 method, denominator |
| Assess target progress | Metrics and target data | Baseline revisions or acquisitions can obscure progress | Base year, recalculations, milestones |
| Support a public comparison | Both | A single rank can suggest more precision than the data supports | Reporting periods, boundaries, confidence in the data |
Use Scores to Screen and Compare Peers
Scores help identify companies that need a closer look - not name one company as the best across the board. Before screening, check the peer group, rating date, methodology version, score direction, and treatment of missing data.
Absolute scores measure performance against a fixed framework; relative ranks depend on the peer set. A company can improve yet fall in rank if its peers improve faster or the comparison group changes.
To track trends, keep records of the methodology and peer group alongside each rating. Check for revised weights, estimates, or industry classifications before linking score movements to company activity. Then use the scores to decide which peers need a closer raw-metric review.
Use Raw Metrics to Explain Performance Gaps
Choose indicators that answer the question at hand: emissions for decarbonization, energy and water for efficiency, injuries and turnover for workforce outcomes, and fines or recalls for compliance exposure. To assess target progress, compare actual reductions with the stated baseline and milestones. A commitment alone doesn’t show progress.
A small score gap can hide a large gap in operations.
Hypothetical illustration - not real company data. The assumed 0–100 score weights environmental management at 40%, social management at 30%, governance at 20%, and disclosure quality at 10%. Higher is better. Both manufacturers use fiscal year 2024 data, calendar-year production denominators, operational-control boundaries, and Scope 1 plus market-based Scope 2 emissions for the score’s emissions inputs. Scope 3 is excluded. Production means metric tons of finished product. The operational comparison below focuses on Scope 1.
Indicator Manufacturer A Manufacturer B ESG score 72/100 71/100 Scope 1 emissions 120,000 metric tons CO₂e 70,000 metric tons CO₂e Production 1,000,000 metric tons 350,000 metric tons Scope 1 intensity 0.120 metric tons CO₂e per metric ton 0.200 metric tons CO₂e per metric ton Scope 1 reduction from 2022 baseline 18% 5% Total reported emissions coverage 95% of facilities 62% of facilities Assurance Scope 1 and 2 limited assurance No assurance
Similar scores don’t settle the comparison. A reports higher emissions but lower intensity and faster improvement. B’s narrower reporting coverage limits confidence in its lower total. Before using these figures for supplier selection or public claims, align coverage and boundaries.
The next step is to standardize peers and definitions before comparing results.
Build a Consistent Competitor Benchmark
After screening scores and checking raw-data quality, standardize the benchmark before comparing results.
Before collecting data, write one sentence that defines its purpose:
This benchmark will support [decision-maker] by comparing [companies] across [material ESG issues] for [reporting periods].
Also set the decision date, evidence standard, and selection thresholds upfront. Track rank, performance, and evidence quality separately so differences in methodology don’t look like gaps in performance.
Choose Peers and Align Metric Definitions
Define the core peer group by primary business activity, geography, business model, ownership structure, and reporting year. Keep broader reference companies outside the like-for-like ranking.
Create a shared metric dictionary that records each metric’s name, definition, formula, unit, numerator, denominator, organizational boundary, operational boundary, reporting period, source, acceptable proxy, and restatement rules. Apply the same organizational and operational boundaries when comparing emissions.[7][8]
Keep original values beside converted or normalized figures. Report emissions in metric tons of CO2e and label operating measures clearly. Retain original currencies, document conversion methods, and format U.S. dollar amounts as $2.4 billion. Write dates as March 31, 2025, and use each company’s actual fiscal-year dates.
Assess Scores, Metrics, and Data Confidence
Maintain a source record for every entry: document, publication date, page or section, reported value, boundary, unit, conversion, and reviewer note. For scores, also record the provider, methodology version, score date, scale, weights, peer universe, and missing-data rules.
Label each metric as reported, estimated, not disclosed, not applicable, or not comparable. For estimates, document the assumptions and methods.[9] Assess confidence separately across coverage, assurance scope, consistency over time, recency, and methodology transparency.[3]
Show Results Without a Forced Overall Rank
When methods or boundaries differ, present benchmark results in rows rather than forcing them into one leaderboard. Use the worksheet to organize raw inputs and score outputs - not to present final findings. It checks comparability; unresolved gaps should remain unresolved, not be backfilled.
Include the scoring methodology, version, weights, score date, and comparison date in the table note or caption. Show overall and pillar scores where available, but leave the combined rank blank when comparability remains unresolved.
| Company | Peer rationale | Score provider and comparison date | Overall score | Pillar scores | Score rank | Absolute metrics | Intensity metrics | Reporting period | Coverage | Trend | Target progress | Confidence | Data-quality notes |
|---|---|---|---|---|---|---|---|---|---|---|---|---|---|
| Core competitors | Eligible peer set | Enter provider and date | Record if available | Record separately | Within peer set | Boundary-aligned totals | Same denominator | Actual start and end dates | Included operations | Comparable observations only | Against stated baseline | Assessed separately | Sources, estimates, exclusions |
| Regional reference companies | Context group | Enter provider and date | Record if available | Record separately | Context only | Retain local boundaries | Check operating conditions | Actual start and end dates | Geographic scope | Flag boundary changes | Check target scope | Assessed separately | Explain regional differences |
| Broader reference companies | Reference context | Enter provider and date | Record if available | Record separately | Exclude from core rank | Keep company-specific basis | Mark noncomparable definitions | Actual start and end dates | Disclosed scope | Show available history | Company-specific only | Assessed separately | Explain limits on comparison |
Conclusion: Turn Benchmark Findings Into Action
Once the benchmark shows where peers diverge, turn those findings into a short action plan. Use scores to flag where to investigate; use raw metrics to diagnose why. Before committing resources, check that boundaries align, weights are known, and missing data is labeled separately from performance gaps. Address the control gaps behind incomplete disclosure and the process issues behind weak results.
Give each priority a clear owner and metrics to turn the benchmark into a work plan.
Set Owners, Deadlines, and Measurable Goals
For each priority, assign an owner and define the baseline year, scope, deadline, milestones, resources, and outcome metric. For decarbonization, name the emissions scopes covered and state whether the target is absolute or intensity-based. For resilience or circular-economy work, identify the facilities or material flows covered and the outcome metric.
Track leading and outcome indicators together:
Facilities assessed alongside avoided downtime, or recycled-input share alongside virgin material use.
Keep the boundary, denominator, methodology, and units consistent at every review. That way, changes reflect performance rather than shifts in calculation.[4]
Where support is needed, Council Fire can help turn benchmark findings into action. Measure success through milestones and measurable outcomes - not an ESG score alone.
FAQs
How can I tell if an ESG score gap is meaningful?
Look beyond the headline score. Check whether sector models, peer groups, scope, measurement methods, and weights are comparable. Review how each rating handles missing data and controversies. A higher peer-group rating doesn’t necessarily mean better absolute performance.
If the gap remains, compare raw metrics, such as emissions or board diversity percentages. Use consistent units and reporting boundaries to check whether the gap reflects an actual difference in performance.
How should I compare peers with incomplete ESG data?
Start with commonly reported metrics, such as Scope 1 and 2 emissions, safety rates, or board diversity. Add aggregated benchmarks from industry-specific initiatives to put those figures in context.
When you need estimates, document data gaps, explain your methodology, label the estimates, and track them in a controlled register. If data is still limited, pair quantitative models with qualitative assessments and human judgment. Don’t rely solely on aggregate scores - they may hide uncertainty.
How can I test whether score weights change my findings?
Run a sensitivity analysis by adjusting score weights to match your ESG priorities, then compare the resulting 0–100 scores and rankings [1][2]. Before changing weights, check that your metrics are consistent, normalized, and validated. Indicator definitions and data treatment matter more than weight variations [2].
Stable rankings suggest the findings hold up across weight changes. Large shifts point to results that depend on score weights and need a closer look [2][1].




FAQ